Conflating Queensland's Coking and Thermal Coal Industries
←
→
Page content transcription
If your browser does not render page correctly, please read the page content below
Tim Buckley, Director of Energy Finance Studies Australasia 1
Simon Nicholas, Energy Finance Analyst
June 2019
Conflating Queensland’s Coking and
Thermal Coal Industries
Thermal Coal Adds Little to Queensland’s State
Budget
Executive Summary
Coking coal (also known as metallurgical coal) is used for steel manufacturing.
Thermal coal is used to generate electricity.
Coking coal and thermal coal are two completely different products of vastly
different value to Queensland, supplying entirely different industries and with very
different volume trajectories going forward.
According to IEEFA estimates for the calendar year of 2018 for Queensland coal
exports:
Coking coal royalties are
seven times more than
thermal coal royalties in the
Queensland budget,
estimated at $3,626m
versus just $538m from
export thermal coal.
Coking coal contributes an
overwhelming 87% of the
coal royalties to the
Queensland government.
Standalone thermal coal
mines generate less than
10% of Queensland coal
royalties.
Coking coal royalties averaged at $23/tonne for coking coal vs. just A$8/tonne
for thermal coal.
Coking coal contributes 71% of total Queensland export coal volumes, but a
much more significant 82% of the value of coal exports.
Given a progressive royalty rate for higher value products, coking coal export
royalties reach 15% of value (in-excess of A$150/t), whereas thermal coal export
royalties are predominantly charged a 7% royalty rate. In calendar year 2018,
thermal coal export royalties averaged just A$8/t vs. $23/t for coking coal.
Conflating Queensland’s Coking and Thermal Coal Industries                                 2

Coking coal is used for steel manufacturing and is far from technologically
obsolete. But there are alternatives to coking coal in supplying steel. One quarter of
steel is made with scrap and electric arc furnaces, and at some point, if the world is
to achieve the Paris Agreement, coking coal emissions will need to be addressed.

Coking coal is valued at three times
the price of thermal coal, far more
able to carry the internalised cost of
                                                  Coking coal is valued at
carbon emissions and is significantly              three times the price
less challenged by lower cost                        of thermal coal.
technology innovations.

Thermal coal is used to generate electricity and is rapidly approaching
technological obsolesce.

As a result, new thermal coal basins are un-bankable and of marginal viability.

Stranded asset risks for thermal coal, the associated supporting infrastructure
investments and coal-fired power plants are rising. The urgency of dealing with the
climate crisis is increasingly clear to financial institutions and financial regulators.

To date, 112 globally significant financial institutions have introduced thermal coal
policy restrictions.

Adani has found it impossible to secure financial backers for its Carmichael thermal
coal mine proposal in Queensland’s Galilee Basin.

Given a three-year construction timeline and the proposed 7-year royalty holiday
gifted by the Queensland government, the often-touted benefit of additional
royalties from the Carmichael thermal coal mine proposal ignores that zero
royalties are likely to be paid in the coming decade.

Queensland Treasury forecasts point to speeding and red-light camera
penalties being likely to contribute more to the Queensland budget than
thermal coal in the next few years.

A tonne of coking coal in Queensland pays four times the export royalties and is
worth three times as much as low energy, high ash Carmichael thermal coal.

Queensland is the world leading supplier of coking coal for steel manufacture.

And coking coal, iron ore, and liquid natural gas (LNG) are Australia’s three top
mining and energy exports, rivalling tourism and education in their export value to
Australia, highlighted by the Office of the Chief Economist (Figure 1).

In contrast, thermal coal use peaked globally back in 2014 and is set for terminal
decline by 2050 if we are to limit global warming below dangerous levels (+1.5-2°C).
The costs to Australia of extreme weather events and climate inaction are already
A$19bn annually and set to double.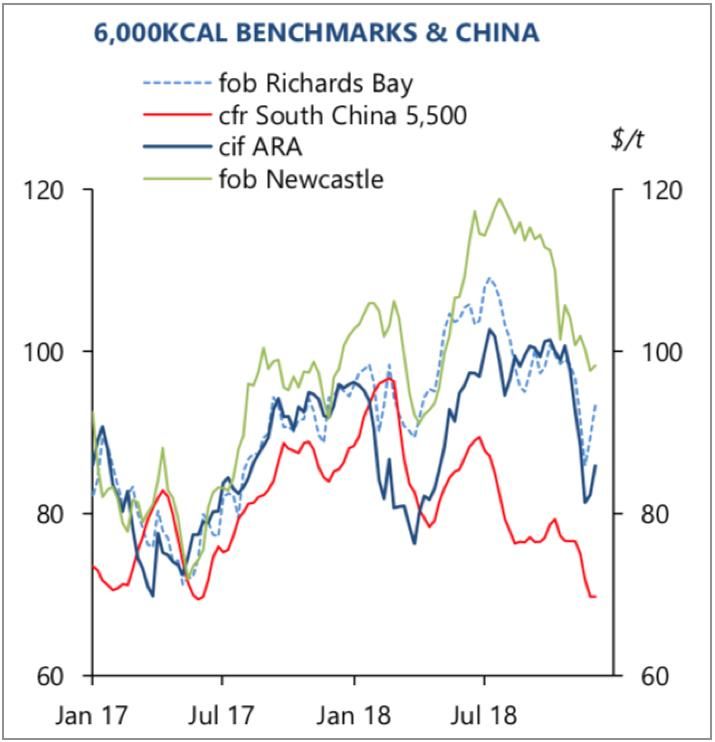
Conflating Queensland’s Coking and Thermal Coal Industries                             3

Conflating coking coal with structurally challenged thermal coal tarnishes the
overall resource sector’s social licence to operate. Global mining houses are being
tarred defending the indefensible.

Forward looking mining houses like Rio Tinto planned their exit from thermal coal
long ago. Andrew Forrest’s Fortescue Metals have ruled out entering the thermal
coal mining sector in favour of investing in value-added opportunities in mining and
new energy industries of the future, like hydrogen and lithium. BHP has now drawn
the distinction with their no new thermal coal investments position.

Queensland needs to be strategic and develop those resources that have the
highest value to the State.

For IEEFA, the first step for Queensland would
be a ‘no new thermal coal mine’ policy,
highlighting the distinctly differing outlook of
higher value-added coking coal for steel                    The first step for
manufacturing vs. thermal coal. This would                Queensland would be a
allow a sensible, bi-partisan debate and buy                ‘no new thermal
Queensland’s industry, community and
workforce the time needed for an orderly
                                                            coal mine’ policy.
transition over the coming decade.

A ‘no new thermal coal mines’ policy would materially reduce the stigma and
associated blame being felt by the state’s world-leading coking coal export sector,
differentiating coking coal from the terminal decline prospects facing the thermal
coal sector.

Expanding the extraction and use of thermal coal undermines the Paris Agreement,
and is a policy objective of zero relevance to the outlook for Queensland’s coking
coal, LNG or mining activities in rare earths, lithium and cobalt, all critical
components of the supply chain for zero emissions industries of the future.

Figure 1: Australia’s Top Resource and Energy Exports 2018-19 (A$bn)

Source: Australian Government’s Office of the Chief Economist, March 2019.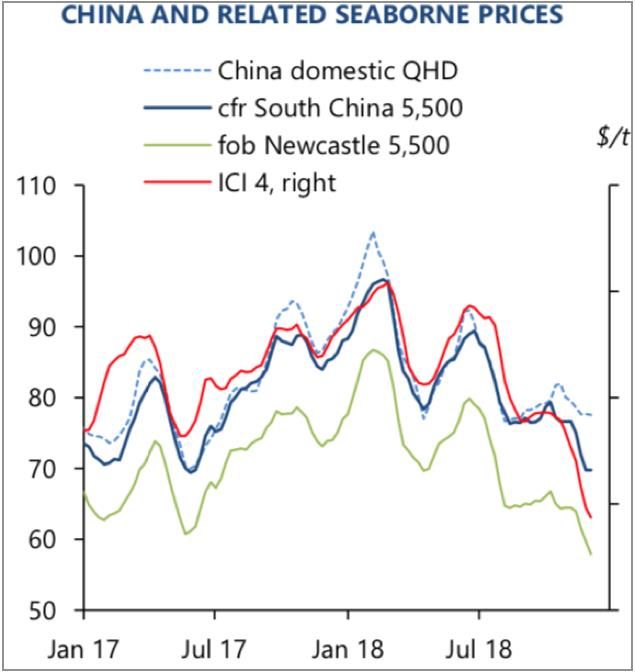
Conflating Queensland’s Coking and Thermal Coal Industries                                                                                                        4

 Table of Contents
 Executive Summary ....................................................................................................................................... 1
 Section 1. Coking Coal Is Used to Manufacture Steel, Thermal Coal Is Used to
 Generate Electricity ....................................................................................................................................... 6
       Coking Coal for Manufacturing Steel............................................................................................... 6
       Thermal Coal for Generating Electricity ........................................................................................ 7
       Queensland Produces 96% of Australia’s Hard Coking Coal ................................................ 9
       Critical Headwinds Affecting Queensland’s Galilee Basin...................................................... 9
 Section 2: Queensland Government Coal Royalties ...................................................................... 11
       Combining Royalties from Coking Coal and Thermal Coal Muddies the Waters ...... 12
       Global Finance is Exiting the Thermal Coal Sector ................................................................ 13
       Carmichael Royalty Holiday: No Royalties to Queensland for a Decade ...................... 13
       Coking Coal Royalties Nearly Seven Times More than Thermal Coal Royalties
       in the Queensland Budget ................................................................................................................. 13
       The Mining Industry’s Reputation is Being Tied to Thermal Coal but Rio Tinto’s
       Actions Highlight a Split is Coming ............................................................................................... 14
       Acknowledging the Difference Between Thermal and Coking Coal for Better
       Public Discourse in Queensland ..................................................................................................... 16
       Case Study: Olive Downs Coking vs. MacMines Thermal Coal .......................................... 17
 Section 3. Coal Quality Issues ................................................................................................................. 20
       The Galilee Thermal Coal Is of Inferior Quality ....................................................................... 20
       Low Grade Thermal Coal (5,500 kcal) at a 2018 Low .......................................................... 21
 Section 4. Scenarios Foretell Coal’s Structural Decline ............................................................... 23
 Section 5. Commitment to Paris Agreement .................................................................................... 30
 Section 6: Carbon Risk ............................................................................................................................... 32
 Section 7. Global Divestment from Coal-fired Power ................................................................... 33
       Financial Institutions Pivot Away from Thermal Coal ......................................................... 33
       Japan, Australia’s Biggest Export Customer, is Pivoting ...................................................... 37
 Section 8. India’s Sustained Pivot to Renewables .......................................................................... 38
 Annexure I. Alternatives to Coking Coal ............................................................................................ 41
 About the Authors ....................................................................................................................................... 45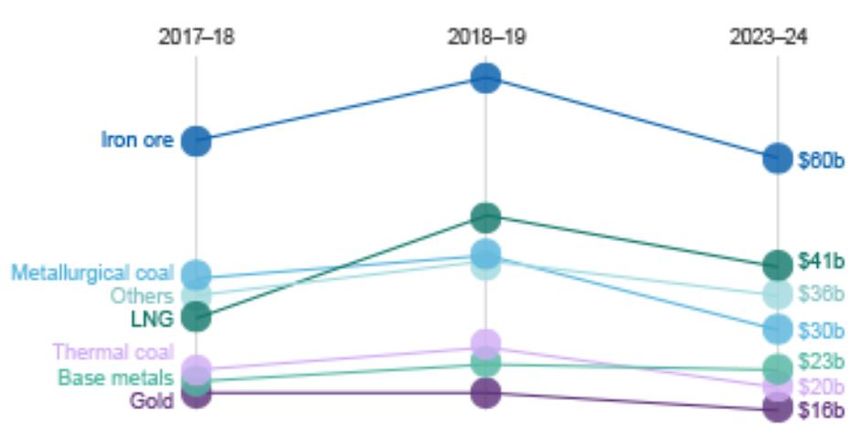
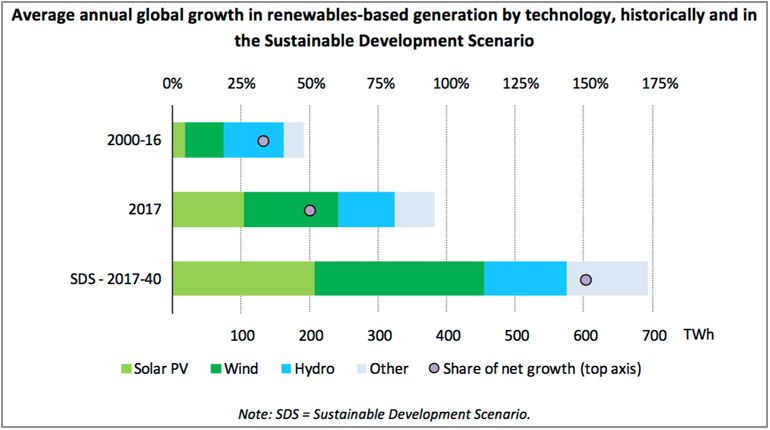
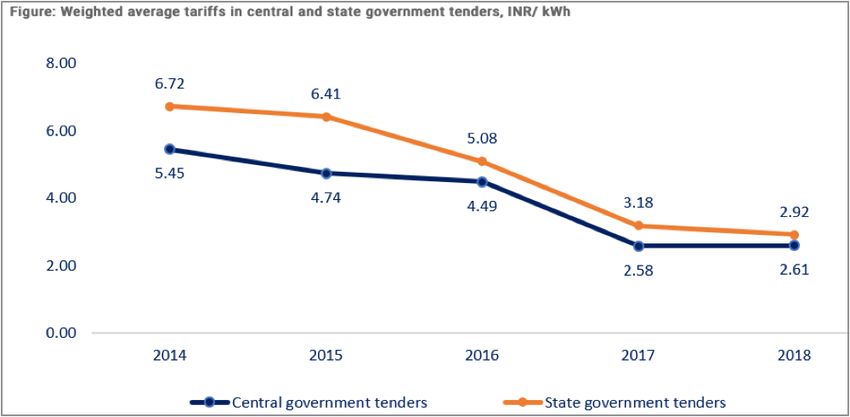
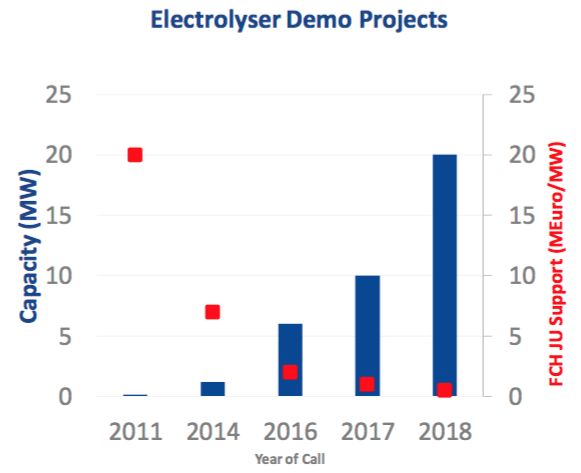
Conflating Queensland’s Coking and Thermal Coal Industries                                                                                       5

 Table of Figures
 Figure 1: Australia’s Top Resource and Energy Exports 2018-19 (A$bn) ............................. 3
 Figure 1.1: Australia’s Coking vs. Thermal Coal Exports by State (CY2018) ........................ 9
 Figure 2.1: Queensland Royalties – Coking vs. Thermal Coal (CY2018) .............................. 11
 Figure 2.2: Queensland Royalties.......................................................................................................... 12
 Figure 3.1: 6,000kcal Newcastle Benchmark Thermal Coal Price (US$/t) ......................... 20
 Figure 3.2: 5,500kcal Newcastle Benchmark Thermal Coal Price (US$/t) ......................... 21
 Figure 3.3: The High Ash Coal Price Discount Hit an Unprecedented High ........................ 22
 Figure 3.4: Carmichael’s High Ash Coal Price Discount likely 50% ....................................... 22
 Figure 4.1: Possible Carbon Emissions Pathways Reflecting IEA Scenarios ...................... 23
 Figure 4.2: IEA Global Coal Demand Actual and Estimates 2018 vs. 2017 (Mtce) .......... 24
 Figure 4.3: Global Coal-fired Power Plant Capacity and Utilisation Rate ............................ 26
 Figure 4.4: Net Global Coal-fired Power Plant Capacity Expansion ....................................... 27
 Figure 4.5: IEA Global Coal Power Plants Reaching FID Sign-off (GW) ................................ 28
 Figure 4.6: IEA Global Coal 2014-17 vs. Forecast 2040: NPS vs. SDS (Mtce) ..................... 28
 Figure 4.7: IEA Global Seaborne Coal 2014-17 vs. 2040: NPS vs. SDS (Mtce) ................... 29
 Figure 4.8: The IEA SDS Forecasts Renewable Energy Will Supply 150% of Net
 Growth in Electricity Demand Globally over 2017-2040 ........................................................... 29
 Figure 6.1: European Union’s Emissions Allowance Units (€/t)............................................. 32
 Figure 8.1: Solar Tariff Declines Continue to Drive Indian Deflation .................................... 38
 Figure 8.2: Indian Thermal and Renewable Power Capacity Adds (MW) ........................... 39
 Figure A.1: Hydrogen Electrolyzer Demonstration Projects Accelerate .............................. 42
Conflating Queensland’s Coking and Thermal Coal Industries                                    6

Section 1. Coking Coal Is Used to Manufacture Steel,
Thermal Coal Is Used to Generate Electricity
Coking coal (also known as metallurgical coal) is used for steel manufacturing and is
far from technologically obsolete.

Coking coal as a product holds a much higher value than thermal coal, with average
export prices more than double those for thermal coal.

Thermal coal is used to generate electricity.

In a carbon constrained world, thermal
coal is rapidly approaching
technological obsolescence and                         Thermal coal is rapidly
struggling to compete with ever-lower                approaching technological
cost, zero emissions renewable energy
                                                           obsolescence.
alternatives, as well as energy efficiency
technologies, gas and hydro-electricity.

Proponents of coal conflate coking coal and thermal coal. They are two completely
different products of vastly different value to Queensland, supplying entirely
different industries and with very different volume trajectories going forward (refer
Appendix 1 for alternatives to coking coal).

Coking Coal for Manufacturing Steel
Coking coal is predominantly used in steelmaking as a reductant (to convert iron
oxide into metallic iron), as a carbon source to produce heat, and in the blast furnace
to support the burden (preventing the iron ore and fluxes from collapsing into the
liquid iron).

Queensland is the world’s largest supplier of seaborne coking coal globally,
with a market share of almost 50%.1

Queensland exports almost all of Australia’s highest value hard coking coal.
Queensland is also the major producer and exporter of two lower value coking coal
grades:

1. Pulverised Coal Injection (PCI) coal which is used for its heat value and injected
   directly into blast furnaces, reducing the amount of higher quality, higher cost
   coking coal required.

2. Semi-soft coking coal (SSCC) used in the coke blend along with hard coking coal,
   resulting in a lower quality product with more impurities.

1According to the Office of the Chief Economist, Australia has a 55% global market share in
seaborne coking coal in 2018. Queensland exported 159Mt of coking coal in CY2018, 89% of
Australia’s total.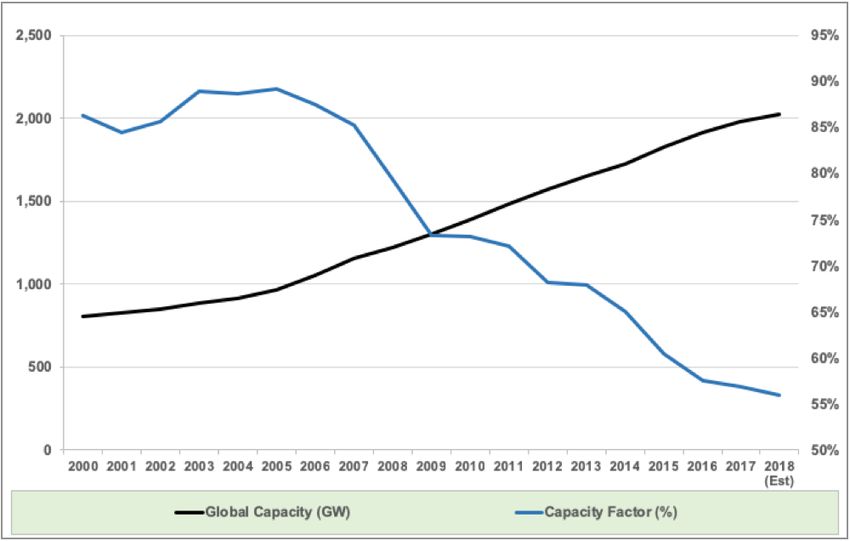
Conflating Queensland’s Coking and Thermal Coal Industries                                7

Alternatives to coking coal for the manufacture of steel are available. While
structural timber is a commercially viable and proven alternative to steel in house
frames and certain commercial building applications, and aluminium or carbon fibre
can substitute for steel in cars, these alternatives have not yet been widely adopted
globally.

Absent a sustained, high price on carbon emissions and further technological
innovation (for example, commercialising the use of zero emissions renewable
energy or gas generated hydrogen as a substitute for coking coal), current
alternatives to coking coal in the manufacturing of new steel have not been widely
adopted, and while this will change, it is not posing the same immediate disruption
as wind, solar and storage is posing to thermal coal (See Annexure 1 – Alternatives
to Coking Coal).

IEA Forecasts for Coking Coal
Even if the world acts to successfully limit global temperature rises to 1.5-2°C, the
International Energy Agency (IEA) acknowledges the limited scope for substitution
to coking coal on current technologies, and as such forecasts that seaborne coking
coal demand globally will only gradually decline.

The IEA forecasts coking coal will decline a cumulative 17% by 2040, while
thermal coal will show a much steeper 65% decline in the same period (refer
Figure 4.7).

The gradual decline in coking coal use primarily reflects the acceleration of scrap
steel recycling in China using electric arc furnaces as their economic growth profile
matures, along the lines of developments in North America and Europe in the last
two decades.

In sum, while the demand profile of coking coal is negative, the lack of direct and
commercially viable alternatives means that absent a very high global price on
carbon emissions, Queensland’s existing coking coal capacity has limited stranded
asset risk over the coming decade or two.

Thermal Coal for Generating Electricity
Thermal coal is used to generate electricity and therefore competes directly with a
range of alternatives, from hydro-electricity, nuclear, gas/LNG, as well as renewable
energy. A high price of coal and hence electricity will also drive the uptake of energy
efficiency as an alternative.

In an increasingly carbon constrained world, thermal coal is rapidly approaching
technological obsolesce and is struggling to compete with ever-lower cost, zero
emissions renewable energy alternatives. As a result of this loss of competitiveness
and combined with the massive externality costs of coal mining and use (water and
air pollution, problematic mine rehabilitation, fly-ash waste disposal post-use as
well as the obvious carbon emissions), thermal coal is increasingly becoming
unbankable.
Conflating Queensland’s Coking and Thermal Coal Industries                                 8

Greenfield thermal coal mine proposals are struggling with questions of
viability, particularly new basins, given the absence of prerequisite supporting
water, electricity and transport infrastructure, combined with reduced capital
access. This is the dilemma the Adani group is facing with its long delayed thermal
coal Carmichael mine proposal for Queensland. Since 2017, India’s domestic coal
and domestic renewable energy projects are the preferred and low-cost source of
new electricity supply, leaving Carmichael a stranded asset, unviable and
unnecessary if the world is to remain a liveable planet.

IEA Forecasts for Thermal Coal
The IEA very clearly states “unabated coal generation is incompatible with the long-
term emissions requirements of the Sustainable Development Scenario (SDS)... Only
5% of global electricity generation is based on thermal coal by 2040.”2

However, the IEA has also long assumed that carbon capture and storage (CCS) will
be rapidly deployed in the thermal coal-fired power sector. This is despite the near
global absence of a sufficiently strong carbon emissions price signal, leaving this
forecast increasingly unrealised.

The thermal coal industry has consistently campaigned against a price on
carbon, despite this being a critical prerequisite for this industry’s long-term
survival. The IEA concludes: “progress in CCS deployment and investment remains
limited in practice and lags well behind the pace that would be needed in this
scenario (the SDS).”

Likewise, the IEA continues to forecast that India will be the single largest source of
global demand growth for thermal coal. IEEFA has long questioned the validity of
this forecast in light of investment trends over the last three years (refer Section 8).

With global financial institutions
increasingly committing to a thermal coal
phaseout or outright lending ban (refer
Section 7), capital flight from thermal coal         Capital flight from thermal
is increasing at the same time as key coal               coal is increasing.
import nations are rapidly shifting their
energy targets towards renewable energy
and LNG, replacing high polluting, high
emissions imported coal.

As one example, in April 2019 South Korea proposed a new 30-35% renewable
energy target by 2040, up from the current 8%, as the latest iteration of their
strategic shift away from thermal coal. This builds on the 28% increase in South
Korea’s coal tax to US$40/t (effective April 2019), and combines with a national
emissions trading scheme which now prices carbon at US$20/t, making imported
coal less and less competitive.

2   IEA World Energy Outlook 2018, November 2018, page 232.
Conflating Queensland’s Coking and Thermal Coal Industries                                         9

Queensland Produces 96% of Australia’s Hard Coking Coal
In CY2018, Australia exported 385.8 million tonnes (Mt) of coal. Coking coal
comprised 46% of this total at 178.2Mt, while thermal coal comprised 54% or
207.6Mt (Figure 1.1). An analysis of the exposure of coal exports by state shows a
stark difference.

Queensland exported 58% of Australia’s total coal volumes while NSW exported the
balance at 42%.

Queensland is predominantly a coking coal exporter, making up 71% of total state
coal exports by volume and 83% by value (refer Figure 2.1). Queensland produces
96% of Australia’s high value hard coking coal, and a dominant 76% of Australia’s
lower value semi-soft coking coal (SSCC) and pulverised coal injection (PCI).

Thermal coal represents just 29% of Queensland’s coal export volumes (17%
by value).

NSW exported 163.2Mt of coal in CY2018, but 88% of this was lower value thermal
coal. Mirroring Queensland, NSW exports just 4% of Australia’s highest value hard
coking coal, and 25% of Australia’s total SSCC & PCI volumes.

Figure 1.1: Australia’s Coking vs. Thermal Coal Exports by State (CY2018)
 Exports CY2018                      Australian     Qld          Qld         NSW         NSW
 Millions of Tonnes                    Total       Total        Share        Total       Share
 Hard coking coal                        118.4        113.5         96%          4.8          4%
 Coking coal (SSCC & PCI)                 59.8         45.2         76%         14.7         25%
 Coking coal (hard, SSCC & PCI)          178.2        158.7         89%         19.5         11%
 Thermal coal                            207.6         64.0         31%        143.7         69%
 All coal exports                        385.8        222.7         58%        163.2         42%
 Coking coal as share of total volumes                 71%                       12%
Source: DFAT STARS Database, based on ABS Cat No 5368.0, December 2018 data, Office of the
Chief Economist, Department of Natural Resources and Mines Queensland, IEEFA calculations.

Critical Headwinds Affecting Queensland’s Galilee Basin
While the Galilee Basin has long been touted as a potential source of new thermal
coal exports for Queensland, this has ignored three critical headwinds:

1. The remote location of the Galilee Basin puts it 400km from a coal export port,
   without the prerequisite supporting water, electricity, roads and rail
   infrastructure.

2. Relative to the global seaborne thermal coal market, the Galilee Basin is high ash
   thermal, low energy (HALE) coal. Carmichael’s deposit has an energy content
   15% below that of NSW’s Hunter Valley thermal coal, and double the ash
   content.
Conflating Queensland’s Coking and Thermal Coal Industries                            10

3. Global demand for thermal coal peaked back in 2014 and is set for terminal
   decline by 2050 if the world is to successfully limit global warming to +2°C or
   less. Flooding the world with more supply in a declining demand market is not
   in Australia’s strategic interest and would only serve to lower the price of our
   existing thermal coal exports.
Conflating Queensland’s Coking and Thermal Coal Industries 11
Section 2: Queensland Government Coal Royalties
IEEFA estimates that royalties from coal exports due to the Queensland government
in CY2018 include:
$3,626m from coking coal for use in manufacturing steel.
$538m from export thermal coal destined for use to generating electricity
(as per Figure 2.1).
Figure 2.1: Queensland Royalties – Coking vs. Thermal Coal (CY2018)
Price Volume Value Royalties
A$/t Mt A$bn A$m
Coking coal 214 159 33.5 3,626
Thermal coal 111 64 7.1 538
Total n.a. 223 40.6 4,164
Coking coal 71% 82% 87%
Thermal coal 29% 18% 13%
Total 100% 100% 100%
Source: DFAT STARS Database, based on ABS Cat No 5368.0, December 2018 data, Office of the
Chief Economist, Department of Natural Resources and Mines Queensland, IEEFA calculations.
As discussed in Section 1, Queensland exported 223Mt of coal in CY2018. Some 71%
of this total included coking coal exports for use in steel manufacturing. Thermal
coal represents just 29% of Queensland’s total coal exports, by volume.
Coking coal is a much higher value product than thermal coal.
Queensland coking coal export prices averaged an estimated A$214/t in CY2018 in
comparison to just A$111/t for thermal coal – more than half the price.3 The coking
coal sector generated $33.5bn of exports, or 82% of Queensland’s total coal, by
value.
Queensland also has a strongly progressive royalty sharing policy. Above A$150/t,
coal royalties to the state are 15% of value, relative to just 7% on prices below
A$100/t (Figure 2.2).
In CY2018, Queensland thermal coal royalties averaged just A$8/t versus
A$23/t for coking coal.
3Calculated from the Office of the Chief Economist figures published in “Resources and Energy
Quarterly”, March 2019.Conflating Queensland’s Coking and Thermal Coal Industries 12
In sum, coking coal exports contributed an estimated $3,626m to the Queensland
government in CY2018, 87% of the state’s total coal royalty take.
Given lower quality thermal coal is a by-product of many coking coal mines in
Queensland, the contribution to state royalties from standalone thermal coal
mines is less than 10% of the state’s total.
Figure 2.2: Queensland Royalties
Average price per tonne for period
Up to and including $100 7% of value
Over $100 and up to and including $150 First $100 - 7% of value
Balance - 12.5% of value
More than $150 First $100 - 7% of value
Next $50 - 12.5% of value
Balance - 15% of value
Source: Queensland Government, accessed April 2019.
Combining Royalties from Coking Coal and Thermal Coal
Muddies the Waters
Conflating coking coal royalties and thermal coal royalties has significant strategic
implications for Queensland.
Many environmental groups are campaigning for a ‘No New Coal Mine Policy’, given
the mining and burning of coal is the largest single contributor to global carbon
emissions.
If the coal industry was able to highlight the global importance of Queensland’s
coking coal industry, and the lack of cost-effective, low emissions technology
alternatives available,4 much of the debate would rightly focus on the highest global
climate priority – to rapidly phase out reliance on high emissions thermal coal used
in generating electricity (refer Section 4).
4 IEEFA’s expert witness report to the NSW Land & Environment Court of 2018 highlighted that
the development of electric arc furnaces combined with rising recycling rates of steel scrap in
China is a key threat to coking coal longer term. Also, cost-competitive alternatives to coking coal
in the manufacturing of steel are emerging (primarily zero emissions hydrogen, incentivised in
Europe by the rapidly rising carbon price (refer Section 6)). The IEA forecasts only a gradual,
phased decline in global coking coal demand, rather than the precipitous and terminal decline in
global thermal coal demand by 2050 if we are to retain a liveable planet (refer Section 4).Conflating Queensland’s Coking and Thermal Coal Industries 13 Global Finance is Exiting the Thermal Coal Sector The divergence of views on coking versus thermal coal is clearly evident in the growing number of globally significant financial institutions announcing thermal coal and coal-fired power plant lending and insurance restrictions and/or complete divestment (refer Section 7). IEEFA also notes the global implications of Japan’s Marubeni Corporation’s new climate policy released in September 2018, announcing its decision to cease developing coal-fired power plants globally. Outside of China and India, Marubeni was the world’s largest developer of new thermal coal-fired power plants during the last five years. It is important to note that while Japanese trading houses are quickly exiting thermal coal mine ownership, they are generally choosing to retain their coking coal investments. Carmichael Royalty Holiday: No Royalties to Queensland for a Decade It has been suggested that opening up lower quality thermal coal mining in the Galilee Basin will provide a much needed influx of thermal coal royalties for the Queensland government. This statement ignores the significant and repeatedly downsized nature of the unfunded Adani Carmichael mine proposal, as well as the massive royalty subsidy demanded by Adani as the proposed first mover in the Galilee. Given a three-year construction timeline and the proposed 7-year royalty holiday being negotiated with the Queensland government,5 the often-touted benefit of Few, if any, Galilee coal additional royalties from the Carmichael royalties are likely to be paid thermal coal mine proposal ignores that in the coming decade. few, if any, Galilee coal royalties are likely to be paid at all in the coming decade. Coking Coal Royalties Nearly Seven Times More than Thermal Coal Royalties in the Queensland Budget Coking coal royalties contributed an estimated $3,626m to the Queensland government in CY2018 versus just $538m from export thermal coal. Considering the near 40% decline in global thermal coal prices since the start of 2019, the likely near-term contribution of thermal coal royalties to the 5While the Queensland Government is yet to sign the proposed seven-year royalty deferral, this is a massive capital subsidy, worth up to A$125m annually at Carmichael’s intermediate product coal export target of 27Mtpa.
Conflating Queensland’s Coking and Thermal Coal Industries                                            14

Queensland government is set to diminish. In the long term, Queensland’s thermal
coal royalty contributions will be very significantly challenged by the likely
progressive decline in import demand.

The IEA forecasts seaborne thermal coal markets will shrink two-thirds by 2040 if
the world is to successfully and collectively deliver on the Paris Agreement.

In light of the likely steady decline in demand for coal globally, Queensland
Treasurer Jackie Trad recently acknowledged the risks in Queensland’s over-
reliance on coal royalties, noting in the Mid-Year Fiscal and Economic Review:
"What we do need to do is focus on the diversification factor, we need to focus on
advanced manufacturing... encouraging new industries particularly in innovation
into Queensland."6

Unlike NSW, Queensland has time to build this economic transition.

Queensland government revenues in 2018/19 are forecast at $59bn. Beyond GST
receipts, payroll tax is forecast to be the top contributor at $4.1bn. This is followed
by coking coal royalties at $3.7bn. Thermal coal royalties are estimated at $560m.

Queensland Treasury forecasts point to speeding and red-light camera
penalties as likely to contribute more to the Queensland budget than thermal
coal in the next few years.7

The Mining Industry’s Reputation is Being Tied to Thermal
Coal but Rio Tinto’s Actions Highlight a Split is Coming
Back in 2013, the Australian Coal Association (ACA) lobby group was reported as
being taken over by the Minerals Council of Australia (MCA). In retrospect, this now
looks to have been more of a reverse takeover of the MCA by the ACA.

In IEEFA’s view, the dominant focus of the MCA in recent years has been: lobbying
to undermine and then dismantle Australia’s world leading carbon emissions price;
advocating for non-existent “clean coal”; calling for yet-more taxpayer funded
subsidies for coal carbon capture and storage (CCS); more recently, calling for even
more Australian taxpayer capital subsidies to underwrite an otherwise unbankable
investment in slightly lower emissions but high-cost new coal-fired power
generation (marketed as “High Energy, Low Emissions” (HELE) coal-fired power
plants); and finally, advocating against renewable energy policies.

IEEFA takes issue with the largely tax-haven based structured fossil fuel industry
(both in Australia and globally) spending far more on political donations, lobbying
and advertising on issues such as these, than on actual investment in research and
development which sits at a fraction of a single percent of coal industry revenues.

6 Brisbane Times, “Queensland's debt bill to hit more than $83 billion in three years”, 13
December 2018.
7 ABC News, “Queensland fines revenue on track to nudge half-a-billion dollars, figures reveal”, 20

March 2019.
Conflating Queensland’s Coking and Thermal Coal Industries                                 15

The MCA’s activities are intent on prolonging the extraction and use of
thermal coal, policy objectives that are of zero relevance to the outlook for coking
coal, iron ore, or any other Australian mining activities.

The MCA appears largely absent when it comes to advocating for the development
of mining and downstream Australian processing relating to industries of the future.

A recent survey by the Queensland Resources Council (QRC) highlighted that the
constant support for thermal coal has eroded the entire Queensland mining
industry’s social licence to operate, including that of the valuable coking coal sector.

While Australia’s current political discourse focuses on the merits and need for
thermal coal, most people in Australia would be surprised to learn that West
Australia is already a world leader in lithium (#1 globally), rare earths (#2
globally), cobalt (#3) and nickel (#4) - all critical minerals needed for
accelerating deployment of batteries, electric vehicles and renewable energy, the
massive growth industries of the future.

IEEFA views the climate denialism of the MCA as a direct contradiction to major
mining groups who are aligning with the global Paris Climate Agreement.

In December 2017, BHP acknowledged material differences of opinion and practice
by the World Coal Association, the US Chamber of Commerce and the MCA over
energy and climate policy. In April 2018, BHP finalised its exit from the World Coal
Association citing the lobby group’s stance on energy and climate change. BHP said
it would remain, for now, a key funder of the MCA after the MCA committed to being
technology neutral, and following the exit of its CEO in September 2017.

In May 2019, BHP announced it will no longer invest in thermal coal.

In April 2019, Rio Tinto confirmed it was actively reviewing its association
memberships after extensive stakeholder engagements on the issue of energy and
climate policy. Rio Tinto is now requiring its lobbyists to be consistent with the
Paris targets, to be technology neutral, and to advocate against public coal subsidies.

Rio Tinto was the first global mining conglomerate to exit coal mining, progressively
selling out of Mongolia, Mozambique and Australia, a process completed in 2018.

We also note Australian company Fortescue Metals have ruled out entering the coal
mining sector in favour of investing in value-added opportunities in mining and new
energy industries of the future, like hydrogen and lithium ion.

The Queensland Resources Council as well as Queensland’s state branch of the
Construction, Forestry, Maritime, Mining and Energy Union (CFMMEU) are well
aware of this technology transition, and it was an important message that saw the
CFMMEU’s Bob Carnegie prioritise climate change over the Galilee in his comments
of May 2019.

Both could better invest in highlighting the high value and necessary role of coking
coal as a completely different industry sector to thermal coal.
Conflating Queensland’s Coking and Thermal Coal Industries                                  16

Acknowledging the Difference Between Thermal and Coking
Coal for Better Public Discourse in Queensland
All coal is not the same; coking coal is used widely, despite the alternatives available.
Coking coal’s higher value (three times higher than thermal coal) allows more
optionality with respect to the eventual emergence of a carbon price or value to coal
CCS.

Thermal coal is already in terminal decline and is the single biggest target globally of
the scientific and environmental communities focussed on reducing emissions to
divert the climate crisis.

Acknowledging the critical difference between coking coal for steel manufacturing
and thermal coal for power generation, and the very different demand outlooks for
each, might allow a more positive public discourse that looks to the real and
sustainable opportunities for Queensland’s resource industry as a whole.

For instance, renewable energy is
another key natural and sustainable
resource of regional Queensland, both
for domestic use and longer term for
export.
                                                   Renewable energy is
The political and community discourse             another key natural and
about how to deal with the growing
cost to all Queenslanders of more                 sustainable resource of
frequent, more extreme weather                     regional Queensland.
events would be far less divisive if the
resources sector and their lobbyists
acknowledged both the real risks and
opportunities relating to the climate
crisis.

For IEEFA, the first step in this would be a ‘no new thermal coal mine’ policy. This
would allow a sensible, bi-partisan debate and buy the industry, community and
workforce the time needed for an orderly transition over the coming decade.

A ‘no new thermal coal mines’ policy could materially reduce the stigma and
associated blame being felt by the state’s world-leading coking coal export sector,
differentiating coking coal from the terminal decline prospects facing the thermal
coal sector.

For the world to limit global temperature rise to 1.5-2°C, thermal coal mining
and the associated coal-fired power plants must cease entirely by 2050.

Global investors managing US$32 trillion of assets have made this a clear priority
for all companies they invest in. Use of coking coal must reduce over time, but its
future is nowhere near as dire as thermal coal, and its higher value use gives it a far
greater capacity to viably internalise the real cost of its carbon emissions.
Conflating Queensland’s Coking and Thermal Coal Industries 17
Case Study: Olive Downs Coking vs. MacMines Thermal
Coal
In May 2019, there have been four distinct but (to IEEFA) related
announcements:
1. Pembroke Resources received Queensland Government approval for
their 15Mtpa Olive Downs coking coal export mine proposal in the
Bowen Basin.i
2. Macmines of China announced it was abandoning its 38Mtpa China
Stone HALE thermal coal export proposal in the Galilee Basin.ii
3. BHP’s CFO Peter Beaven announced the company’s plans to
maximise the value of its last two thermal coal mines in the Hunter
Valley in NSW, as the world inevitably moves away from high
emissions thermal coal for power generation.iii
4. China’s National Development and Reform Commission announced
the world’s largest renewable energy tender at 20.8GW, and awarded
with zero subsidy, marking in dramatic fashion China’s bid to reach
renewable grid parity with coal-fired power by 2020 (three years
ahead of its schedule for solar).iv
—
i Pembroke Resources, “Olive Downs Coking Coal Project Receives Approval”,
14 May 2019.
ii ABC, “Mega mine next to Adani quietly put on hold, thousands of promised jobs in
doubt”, 23 May 2019.
iii The AFR, “BHP dark on thermal coal's future”, 22 May 2019.
iv Bloomberg News, “China Unveils First Batch of Solar, Wind Farms That Won’t Be
Supported by Subsidies”, 22 May 2019.
Kickstarting Olive Downs Coking Coal
The relatively fast approval of the 15Mtpa Olive Downs coking coal mine near
Moranbah in Queensland’s Bowen Basin was achieved in part because there were no
objections lodged against the proposal on environmental grounds.
This illustrates the key distinction of coking vs. thermal coal.
The IEA clearly flags that unabated thermal coal use must cease by 2050 if the world
is to collectively deliver on the Paris Agreement. This alone is insufficient to deliver
the necessary limit to global warming but is the single most important step. Coking
coal use for steel manufacturing will continue for decades to come. Coking coal is
worth three times the value of the low energy high ash thermal coal in the Galilee
Basin.Conflating Queensland’s Coking and Thermal Coal Industries 18 The economics of the Olive Downs coking coal mine are greatly enhanced, and the project risks materially diminished, by the ability of this project to leverage existing road, rail, water, power and port infrastructure, along with the fully qualified workforce in the region, rather than having to build a new commercial airport to facilitate fly-in, fly-out workers, with all the associated family stress this brings. Olive Downs will produce up to 15Mtpa of coking coal. At the current price of US$200/t, and using the spot USD/AUD exchange rate of 0.69, this gives revenue of A$290/t. Total annual revenues would be over $4bn, generating A$618m annual royalties (A$41/t) to the Queensland government at the current spot hard coking coal price. A high value coking coal mine close to the coast generates exceptionally high revenues and leverages existing infrastructure. This makes commercial and political sense. In contrast, there is the Adani Carmichael project proposal. At 10Mtpa, Carmichael’s HALE thermal coal would sell at the current spot price of US$50/t, or A$72/t, giving annual revenues of A$725m. Coal royalties would be A$5/t (7%), or $50m annually - if there is no seven-year royalty holiday. In sum, Olive Downs coking coal mine on 50% more volume delivers six times more revenue annually than Adani’s thermal coal mine. This is a high value product compared to a low value product. The royalties per tonne are eight times higher at current spot prices for coking vs. thermal coal (A$40/t vs. A$5/t), acknowledging the estimated discount for HALE thermal coal in the Galilee. The total royalties of Olive Downs of up to A$618m are more than twelve times that generated by Adani’s stage I Carmichael proposal of A$50m. Olive Downs will employ up to 1,000 staff at 15Mtpa generating A$4bn of revenue. Adani Carmichael mine at 10Mtpa will have revenues of $725m. If Adani is employing 10,000 staff to generate a sixth of the revenue of Olive Downs, the proposal is clearly unviable. The operational staff of Carmichael are likely to be half of Olive Downs, say 500, and not the 1,464 testified by Adani’s economic expert in court in 2014, given the project has been downsized many times since then. Abandoning China Stone’s HALE Thermal Coal The decision to abandon the 38Mtpa China Stone HALE thermal coal proposal after a decade of investigation reflects the changing strategic landscape in China, the world’s largest producer, consumer and importer of coal. Macmines has clearly reassessed the outlook for thermal coal exports to China. Given China’s coal use peaked back in 2014, China is now looking to rapidly deploy well over US$60bn annually in domestic renewable energy infrastructure projects at or below the cost of coal-fired power plants. Further, China is looking to deliver on
Conflating Queensland’s Coking and Thermal Coal Industries                                19

its commitment to its people to progressively reduce air pollution, and its global
commitment to ratchet up its efforts to meet the Paris Agreement.

BHP’s Thermal Coal Exit
The BHP announcement to progressively exit thermal coal mining is a clear
independent assessment of the inevitable technology and policy driven changes
underway. The assessment by one of the world’s largest mining companies follows
the same assessment and conclusion by RIO Tinto (which entered this decade one of
the world’s largest coal mining firms, and which now owns no coal mines, coking or
thermal). Likewise, South32 has announced it will exit thermal coal mining globally.

There is a third global force at play. The world’s largest financial institutions are
announcing policies to cease lending, investing and insuring thermal coal mining
and coal-fired power plants. To date, 112 global financial institutions are exiting
coal. (Refer Section 7.)

China Is Set to Reach Renewable Grid Parity by 2020
In May 2019 China’s National Development and Reform Commission (NDRC) – the
country’s top economic planning agency – approved the first 224 wind and solar
projects under its new zero-subsidy policy. Of a total 20.8GW, this subsidy-free list
encompasses 56 onshore wind farms and 168 solar arrays across 16 provinces.8
China has long targeted subsidy free wind power by 2020, but while total installed
solar costs have been coming down in recent years, China’s solar was no-where near
cost competitive with coal-fired power generation – until 2019.

America has seen renewable energy costs below thermal power generation since
2017, but that is with a 30% investment tax credit subsidy. India saw renewables
move 20% below domestic coal fired power generation costs in 2017 (with a
dramatic 50% decline in both wind and solar costs in a single year due to the
introduction of transparent reverse auction tenders).

With domestic wind and solar in China now set to be delivered at grid parity by
2020 – even absent a cost of carbon emissions – the outlook for thermal coal has
dimmed even faster than most thought possible.

Economics, finance, climate and energy policy considerations all highlight that
thermal coal is strategically challenged. It is time to prioritise the limited global
carbon budget to make room for high quality energy sources like coking coal, and
join China, India, Japan and America in accelerating the deployment of low cost
sustainable renewable energy generation.

8   Recharge News, “China approves first 21GW of subsidy-free renewables”, 22 May 2019.
Conflating Queensland’s Coking and Thermal Coal Industries                            20

Section 3. Coal Quality Issues
The Galilee Thermal Coal Is of Inferior Quality
The Newcastle benchmark 6,000kcal 12-14% ash content thermal coal export price
ended the 2018 year at US$100t/free on board (fob) - Figure 3.1. This was a
dramatic improvement, double the 2016 lows of US$50/t. As of end of March 2019,
this price has fallen back to below USS$90/t.

The Newcastle 6,000kcal net as received (NAR) benchmark coal is a higher energy
product than Indonesian export coal which has a 4,000-5,500kcal range, 10-30%
below this top grade.

Coal quality is measured in terms of a number of attributes. After energy content,
ash content is the second most important determinant of pricing. Indonesian
thermal coal has an average ash content of 5-6%, half the Australian top benchmark.

Figure 3.1: 6,000kcal Newcastle Benchmark Thermal Coal Price (US$/t)

Source: Argus Consulting, December 2018.9

Coal promoters often talk about Australian thermal coal being higher quality than
domestic inland thermal coal in India, which is generally very low energy and high
ash content. While the statement is correct, in IEEFA’s view it is also entirely
misleading.

9   Argus Consulting Services, “Thermal Coal Outlook 2019”, 7 December 2018.
Conflating Queensland’s Coking and Thermal Coal Industries                               21

Indian coal is located inland and is largely unconnected to any distant coal ports. As
such, the vast majority of Indian coal power plants are entirely unable to use
imported coal, even if they could afford the significant premium price (mine-mouth
coal in India wholesales for ~US$20/t). Further, the inland Indian coal plants are
designed and engineered to use low energy, high ash thermal coal.

Low Grade Thermal Coal (5,500 kcal) at a 2018 Low
An important divergence emerged in the seaborne thermal coal market during
2018. The price discount of lower quality 5,500kcal coal to 6,000kcal coal reached a
record differential. This was also evident in European coal pricing and has
continued into 2019.

Figure 3.2: 5,500kcal Newcastle Benchmark Thermal Coal Price (US$/t)

Source: Argus Consulting, December 2018.

The Newcastle benchmark for 5,500kcal coal with 20% ash declined over 2018 and
exited the year at US$57/t (See Figure 3.2, in green), a 43% discount to the
6,000kcal benchmark. As at end March 2019, this price was USS$56/t, a discount of
38%.

IEEFA views this as reflective of the ongoing push to deal with critically dangerous
air pollution and lower emissions. China joined Japan, Taiwan and South Korea in
paying a record high price for lower ash, higher energy coal (See Figure 3.3).

Argus has normalised coal pricing to calculate that on an equivalent energy content
basis, high ash coal is now trading at a 30% discount to equivalent energy content
coal of lower ash. This is treble the discount that applied in previous years.
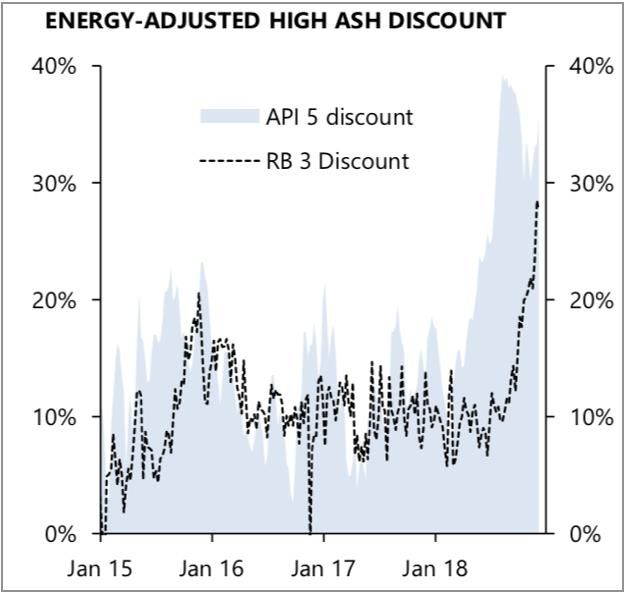
Conflating Queensland’s Coking and Thermal Coal Industries                            22

Figure 3.3: The High Ash Coal Price Discount Hit an Unprecedented High

Source: Argus Consulting, December 2018.

IEEFA concludes that, unwashed, the Carmichael 4,950kcal, 26% ash raw thermal
coal would sell internationally at a likely 50% discount to the 6,000kcal Newcastle
benchmark price (using the end-March 2019 price of US$90/t) – Figure 3.4.

Figure 3.4: Carmichael’s High Ash Coal Price Discount likely 50%
                                                               US$/t     Ash
Newcastle Benchmark (12-14% ash)                       6,000    $90.00   13%
Newcastle Benchmark                                    5,500    $56.00   20%
Price discount (%)                                       -8%   -37.8%

Carmichael Coal                                      4,950               26%
Discount vs 5,500kcal                              -10.0%
Implied Carmichael Price (USS$/t)                              $40.52
Discount 5,500kcal vs 6,000kcal                                -37.8%
Energy discount vs 5,500kcal                                   -10.0%
Discount 26% vs 20% ash                                         -7.2%
Total Discount                                                 -55.0%
Source: Platts, IEEFA calculations as at March 2019.
Conflating Queensland’s Coking and Thermal Coal Industries 23 Section 4. Scenarios Foretell Thermal Coal’s Structural Decline Each year, the International Energy Agency (IEA) releases the World Energy Outlook (WEO) which, among other things, models global energy demand using various scenarios. The scenarios are not predictions, rather tools to assess risks. The scenarios respond to global Paris Agreement targets aimed at keeping temperature rises to 1.5- 2°C. Should the world successfully limit climate change to well below 2°C of warming, fossil fuel extraction must rapidly decrease towards zero net emissions, starting immediately. Thermal coal is the most negatively exposed commodity in this scenario. All countries must instead accelerate reliance on sustainable, affordable and renewable non-fossil sources of energy to avoid catastrophic climate change. IEEFA sees the IEA’s Sustainable Development Scenario (SDS) as the most likely reflection of the world’s energy future. Global financial institutions exiting coal are generally committing10 to the IEA’s SDS or an even more ambitious transformation as outlined in the Beyond 2°C Scenario when they set Paris Agreement compliant targets. Figure 4.1: Possible Carbon Emissions Pathways Reflecting IEA Scenarios Source: Glen Peters, IEA WEO 2017, SS database (IIASA)P.11 10 See IEEFA, Over 100 Global Financial Institutions Are Exiting Coal, With More to Come Every Two Weeks a Bank, Insurer or Lender Announces New Restrictions on Coal, 27 February 2019. 11 Centre for International Climate Research (CICERO), Beyond Carbon Budgets and Back to Emissions Scenarios, Glen Peters, September 2018.
Conflating Queensland’s Coking and Thermal Coal Industries                              24

The Sustainable Development Scenario (SDS) presents a realistic, desirable scenario
whereby nations work together to successfully limit climate change by transforming
the energy market. Under the SDS, the planet’s ‘carbon budget’ will be exhausted as
early as 2023 under a 1.5°C target and by 2040 under a 2°C objective. The SDS
projects a significant decline in thermal coal demand, with global trade plummeting
65% by 2040.

The SDS falls short of meeting the Paris Agreement’s target with any certainty, given
the presumption that coal carbon capture and storage (CCS) is commercialised at
scale by 2030. IEEFA sees this as an improbable assumption absent a high price on
carbon emissions.

Reviewing IEA’s Thermal Coal Forecasts to 2040
The IEA acknowledges that global coal use likely peaked five years back in 2014
while modelling a stagnant near-term outlook to 2022 (See Figure 4.2). The global
seaborne thermal coal market is a sub-section of the global coal market. The IEA
also estimates seaborne thermal coal exports to have likely peaked in 2015.

Figure 4.2: IEA Global Coal Demand Actual and Estimates 2018 vs. 2017
(Mtce)

Source: OECD/IEA.

Despite coal’s peak back in 2014, coal lobbyists distract from the big picture by
claiming Southeast and South Asia will provide significant thermal coal demand into
the future.
Conflating Queensland’s Coking and Thermal Coal Industries 25
In IEEFA’s view, Southeast Asia represents a small fraction of the global seaborne
thermal coal market. The idea that this region will remain isolated from the global
energy transition and an untouched growth market to the benefit of Australian
thermal coal exporters is a highly optimistic or even false hope.
For instance, in May 2019 Thailand announced a new energy plan to 2037 halving
the role of imported thermal coal to just a 12% share.
IEEFA notes the global seaborne thermal coal market is not likely to reverse the
inevitable technology, cost and policy driven direction of a slow, steady and
ultimately terminal decline in volumes by 2050.
IEEFA makes this point relatively categorically given the rate of decline in the cost of
renewable energy and on the premise the world collectively makes further efforts to
implement the Paris Agreement, and absent the long touted but increasingly
unlikely development of yet-to-be-funded commercially viable CCS for coal-fired
power plants.
Rather than sinking more capital into expanding
redundant thermal coal capacity, Queensland
would be better placed optimising coking coal
ventures in existing coal basins with established Queensland would be
infrastructure already in place, while also better placed optimising
investing in new low emissions industries of the
future. This would best transition the
coking coal ventures.
Queensland, and ultimately Australian economy
and limit our collective exposure to stranded
assets.
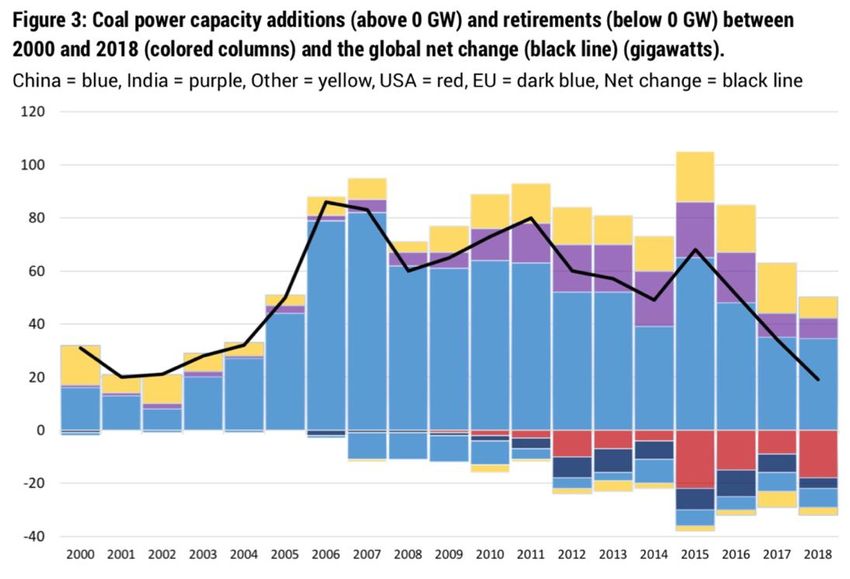
A Decade-long Global Over-investment in New Coal
Coal supporters often justify a positive outlook for thermal coal by referencing the
continued commissioning of new coal-fired power plants globally over the last
decade – a trend detailed in Figure 4.3.Conflating Queensland’s Coking and Thermal Coal Industries 26
Figure 4.3: Global Coal-fired Power Plant Capacity and Utilisation Rate
Source: Global Coal Plant Tracker, BP Statistics, IEEFA estimates & calculations.
This outlook however only tells the optimistic half of the story, with the narrative
missing several key globally entrenched developments:
As coal plant capacity has risen, coal plant utilisation has declined.
Coal consumption is not linked to increased thermal coal-fired power plant
capacity but to the use of a coal plant. An idle new coal plant does not use any
coal; it simply represents a stranded asset. The capacity utilisation rate of the
global thermal coal-fired power plant fleet hit a new record low in 2018,
exceeding the record low set in 2017, and in fact every year this past decade.
(See Figure 4.3. RHS is in blue).
Many coal lobbyists often cite new thermal coal plant development
pipelines while failing to mention the rate of coal plant retirements.
Global coal-fired power plant retirements are accelerating and by 2022 are
forecast to exceed new plant completions.12 In January 2019 Germany
announced it would close 12 GW of thermal coal plants by 2022 as part of its
accelerated 100% coal phaseout of its remaining 42 GW by 2038.13 Global
coal closures over 2015-2018 were 32 GW p.a., a 50% increase vs. the
previous four years – Figure 4.4.
The global thermal coal plant pipeline has shrunk by two-thirds.
The pipeline has shrunk by a cumulative US$1 trillion or 744 GW in a small
12 Carbon Brief, Global Coal Plant Tracker, “Guest post: ‘Peak coal’ is getting closer, latest figures
show”, July 2018.
13 Financial Times, “Germany plans to phase out coal-fired power stations by 2038”, 28 January
2019.Conflating Queensland’s Coking and Thermal Coal Industries 27
timeframe (the 30 months to July 2018). Stranded asset losses are rapidly
rising as renewable energy competition gets increasingly competitive.
New thermal coal plant FID proposals are slowing.
The IEA identifies 2017 as having a record low level of new thermal coal-
fired power plant proposals moving to final investment decision (FID), due to
investors reassessing coal’s future (Refer Figure 4.5).
Thermal coal-fired power plants are becoming, on average, more
efficient. Thermal plants are generating 0.5-1.0% p.a. more electricity per
tonne of coal used.
IEEFA notes there has been a decade-long over-investment in new coal-fired power
generation capacity, in excess of demand. By 2020, IEEFA expects global coal plant
capacity to reach a peak, and steadily decline thereafter, with thermal coal having
already peaked back in 2014.
The commercial viability of the global coal power fleet on aggregate is technically
challenged by collapsing utilisation rates which are sitting near 55%, suggesting
plants sit idle, on average, every second day. This is a long way below the optimal
75-85% assumption erroneously factored into optimistic and wrong past
projections.
Figure 4.4: Net Global Coal-fired Power Plant Capacity Expansion
Source: Global Coal Plant Tracker, March 2019.
Investors have responded by dramatically curtailing coal-fired power plant
expansion plans (Figure 4.5).You can also read