Consolidating Canada's Automotive Dealership Properties - Investor Presentation January 2021 - Automotive ...
←
→
Page content transcription
If your browser does not render page correctly, please read the page content below
Consolidating Canada’s Automotive Dealership Properties
Investor Presentation

                                                          January 2021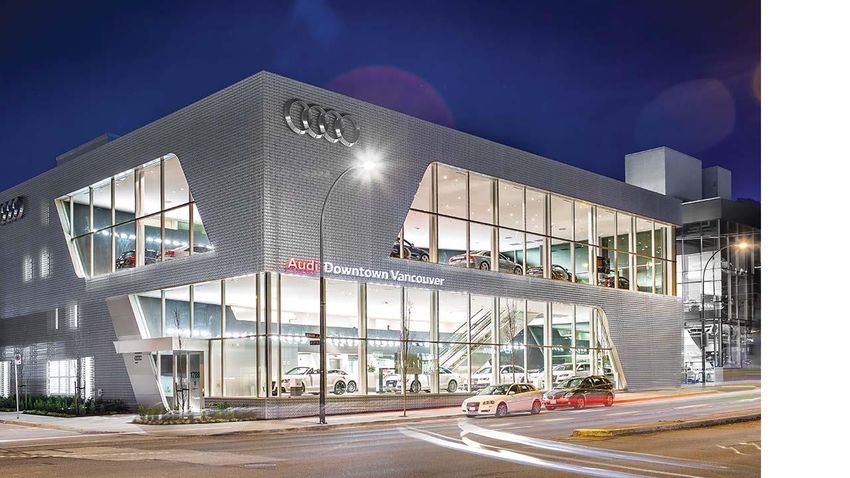
Disclaimer

FORWARD-LOOKING STATEMENTS
Certain statements contained in this presentation constitute forward-looking information within the meaning of applicable securities legislation. Forward-looking information may relate to the REIT’s future
outlook and anticipated events or results and may include statements regarding the financial position, business strategy, budgets, litigation, projected costs, capital expenditures, financial results, taxes, plans
and objectives of or involving the REIT. Particularly, statements regarding future results, performance, achievements, prospects or opportunities for the REIT or the real estate or automotive dealership
industry are forward-looking statements. The REIT has based these forward-looking statements on factors and assumptions about future events and financial trends that it believes may affect its financial
condition, results of operations, business strategy and financial needs, including that the Canadian economy will remain stable over the next 12 months, that tax laws remain unchanged, that conditions within
the automotive dealership real estate industry and the automotive dealership industry generally, including competition for acquisitions, will be consistent with the current climate, that the Canadian capital
markets will provide the REIT with access to equity and/or debt at reasonable rates when required and that the Dilawri Organization will continue its involvement with the REIT. Although the forward-looking
statements contained in this presentation are based upon assumptions that management believes are reasonable based on information currently available to management, there can be no assurance that
actual results will be consistent with these forward-looking statements. Forward-looking statements necessarily involve known and unknown risks and uncertainties, many of which are beyond the REIT’s
control, that may cause the REIT’s or the industry’s actual results, performance, achievements, prospects and opportunities in future periods to differ materially from those expressed or implied by such
forward-looking statements. The forward-looking statements made in this presentation relate only to events or information as of the date of this presentation. Except as required by law, the REIT and Dilawri
undertake no obligation to update or revise publicly any forward-looking statements, whether as a result of new information, future events or otherwise, after the date on which the statements are made or
to reflect the occurrence of unanticipated events. Please refer to “Forward-Looking Statements” in the REIT’s regulatory filings.
NON-IFRS MEASURES
This presentation makes reference to certain non-IFRS measures. Funds from operations (‘‘FFO’’), adjusted funds from operations (‘‘AFFO’’), net operating income (‘‘NOI’’), cash net operating income (‘‘Cash
NOI’’) and Same Property cash operating income (“Same Property Cash NOI”) are key measures of performance used by management and real estate businesses. However, such measures are not defined by
IFRS and do not have standardized meanings prescribed by IFRS. The REIT believes that AFFO is a key measure of economic earnings performance and is indicative of the REIT’s ability to pay distributions from
earnings, while FFO, NOI and Cash NOI are important measures of operating performance and the performance of real estate properties. The IFRS measurement most directly comparable to FFO, AFFO, NOI
and Cash NOI is net income. Please refer to “Non-IFRS Measures” in the REIT’s regulatory filings.

                                                                                                                                                                                                                        1
Capital Market Profile (TSX: APR.UN)

                                                                                                                     Investment properties:
                 Recent price: $10.82                     1
                                                                            REIT Units: 37.7 million                     $917 million2
                  Market capitalization:
                                                                           Class B Units: 9.93 million                   Total return:
                       $515 million1                                                                                 IPO to Jan. 5, 2021: 52%

    Annualized distribution                                   Yield ¹       Debt to GBV ³    TTM AFFO Payout Ratio          2019 tax treatment
                                                                                                                          78% Return of Capital
   $0.804 / unit                                        ~ 7.4%                44.8%                 97%
                                                                                                                          22% Interest income

  Analyst coverage

(1) As at January 5, 2021 (market capitalization includes Class B Units)
(2) As at Sept. 30, 2020, plus Laval, QC property acquisition
(3) As at Sept. 30, 2020
                                                                                                                                                  2
REIT Overview
High-quality portfolio of dealership properties in metropolitan markets across Canada
K-W/ Guelph 3.7%
Ottawa / Kingston 12.8%
Edmonton 7.4% GTA 29.2%
GMA 13.4%
Regina 8.6%
GVA 8.4%
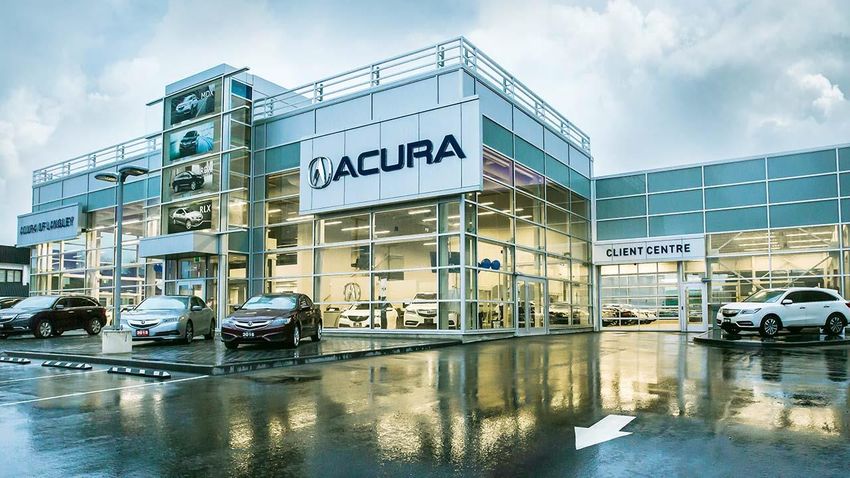
Audi Queensway (GTA) Calgary 12.4% Porsche Vancouver (GVA)
Winnipeg 4.1%
GLA by metro (Sept. 30, 2020)
Long-term, triple-net leases with contractual annual rent escalators 65 200 + acres
Representing 32 global manufacturers / brands income-producing properties of commercially-zoned
and one development property urban real estate
2.5 million > 80%
square feet of Gross Leasable exposure to VECTOM
Area (“GLA”) markets
CANADA’S ONLY PUBLIC VEHICLE CONSOLIDATING AUTOMOTIVE DEALERSHIP PROPERTIES
3
»Canadian Automotive Dealership Industry1

 Retail Sales                                                                                      160 162 165
 ($billions)

                       83    83   83   87   92   96   94   88   96   100 105
                                                                             113 122
                                                                                       132
                                                                                             146
                                                                                                                                  27%
                78
    70    74                                                                                                            Auto industry’s proportion of
                                                                                                                        Canada’s overall retail sales of
                                                                                                                      products and merchandise in 2019
   1999 2000 2001 2002 2003 2004 2005 2006 2007 2008 2009 2010 2011 2012 2013 2014 2015 2016 2017 2018 2019

Automotive dealership retail sales                                      New vehicle unit
include 4 revenue / profit centres                                   sales in Canada in 2019
  1 Parts, service and repair                                                                                              2016 - 2019
  2 Finance and Insurance                                              1.96 Million                              Represent the four highest years on
                                                                                                                  record for new vehicle unit sales
  3 New vehicle sales                                                     4th highest
                                                                        total in history
  4 Used vehicle sales
 (1) Source: Statistics Canada

 THE AUTOMOTIVE RETAIL SALES INDUSTRY IS CANADA’S LARGEST RETAIL SEGMENT
                                                                                                                                                           4
Strong Lead Tenants

 ▪ 76 automotive dealerships,                  ▪ 46 automotive dealerships,    ▪ 66 automotive dealerships,
   representing ~30 brands                       representing ~20 brands         representing ~27 brands
 ▪ Presence in QC, ON, SK, AB, BC              ▪ Presence in ON, AB, BC, NWT   ▪ Presence in NS, NB, QC, ON, MB, SK,
 ▪ REIT has the first right to acquire from                                      AB, BC and United States
   Dilawri development and acquisition
                                                                               ▪ TSX: ACQ
   pipeline

 ▪ 17 automotive dealerships,                 ▪ 11 automotive dealerships,     ▪ 9 automotive dealerships,
   representing ~15 brands                      representing 10 brands           representing 6 brands
 ▪ Presence in ON, BC                         ▪ Presence in ON                 ▪ Located in Greater Toronto Area

                                                                                                                       5
COVID-19 Impact

Impact on Dealerships                                          Impact on the REIT
                                                               • Temporary shift away from acquisition focus towards capital
• Dealerships were closed, or operating on a limited basis
                                                                 preservation with ability to take advantage of expected
  across Canada from mid-March to late May 2020
                                                                 acceleration in consolidation opportunities
• Dealerships fully open as of the end of May 2020
                                                               • Strong liquidity position with: Debt to GBV of 44.8%, $60.6
• Canadian new vehicle sales are expected to decline by 15 -     million of undrawn credit facilities, $0.4 million of cash on hand
  20% in 2020 compared to 2019 ¹                                 and nine unencumbered properties valued at $141.7 million
• Strong vehicle sales and service recovery since June 2020    • Limited rent deferral agreements: APR collected 100% of its Q3
• Dealership businesses have benefitted from CEWS program,       2020 contractual base rent due under its leases (excluding 3% of
  providing improved stability and road to profitability         contractual base rent that is subject to deferral agreements), and
• 2020 supply chain disruptions resulted in reduced              approximately 94% of its base rent for YTD 2020, with the
  inventories and enhanced dealer profit margins                 remaining amount subject to deferral agreements.

• Dealerships reduced SG&A expenses, enhanced their e-         • Cap rate for overall portfolio was 6.9% as at Sept. 30, 2020 (6.6%
  commerce platforms and provided curbside delivery and          as at Dec. 31, 2019), reflecting $34 million market value
  drop-off service                                               adjustment in the first six months of 2020. Q3 2020 cap rate
 (1) Source: Scotiabank Auto Industry Report
                                                                 unchanged from Q2 2020, reflecting stabilization

 MANAGEMENT CONTINUES TO CLOSELY MONITOR THE IMPACT OF THE COVID-19 PANDEMIC
                                                                                                                                      6
2020 New Car Sales in Canada

         - 40%                                        - 3.9%                          - 2.1%
 Canadian new car sales for                     Canadian new car sales for Q3   Canadian new car sales for
the five months ended May                       2020, compared to Q3 2019 ²     October 2020, compared to
 31, 2020, compared to the                                                           October 2019 ²
   same period in 2019 ¹

(1) Source: Statistics Canada
(2) Source: DesRosiers Automotive Consultants

 IMPROVING SALES AND SERVICE LEVELS HAVE RESULTED IN NO NEW REQUESTS FOR
 RENT DEFERRALS FROM APR’S TENANTS
                                                                                                             7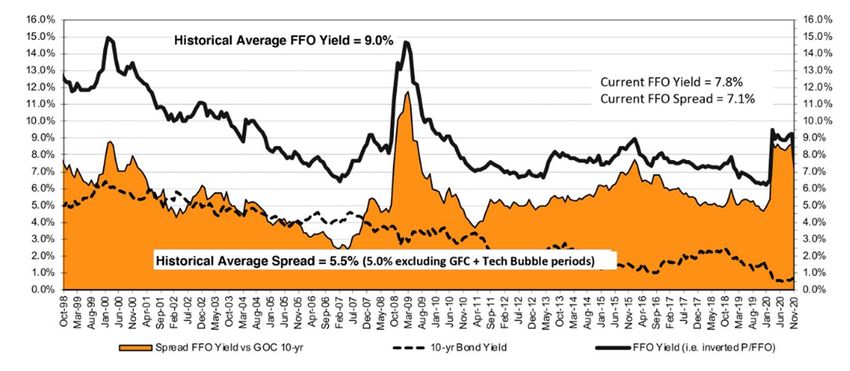
Strong Auto Dealership Performance

    Stock Performance (Trailing 12 Months)1
200%

150%                                                                                      • Sales have rebounded from lows in spring of 2020
                                                                                          • Record earnings for many dealers during Q3 2020
100%
                                                                                               ̶   Rapid cost reduction achieved due to high variable cost
                                                                                                   component
  50%
                                                                                          • Profit margins per unit sold being enhanced through:
   0%                                                                                          ̶   Technological improvements / enhanced e-commerce
                                                                                                   offerings and curbside pick-up for sales & service
 -50%                                                                                          ̶   Reduced headcounts
                                                                                               ̶   Lower SG&A costs
-100%

           Asbury           AutoNation   Group 1   Lithia   Penske   Sonic   AutoCanada

(1) As at January 5, 2021

    THE AUTOMOTIVE DEALERSHIP INDUSTRY IS HIGHLY RESILIENT AND HAS RESPONDED
    EFFECTIVELY TO THE DISRUPTION CREATED BY THE COVID-19 PANDEMIC
                                                                                                                                                             8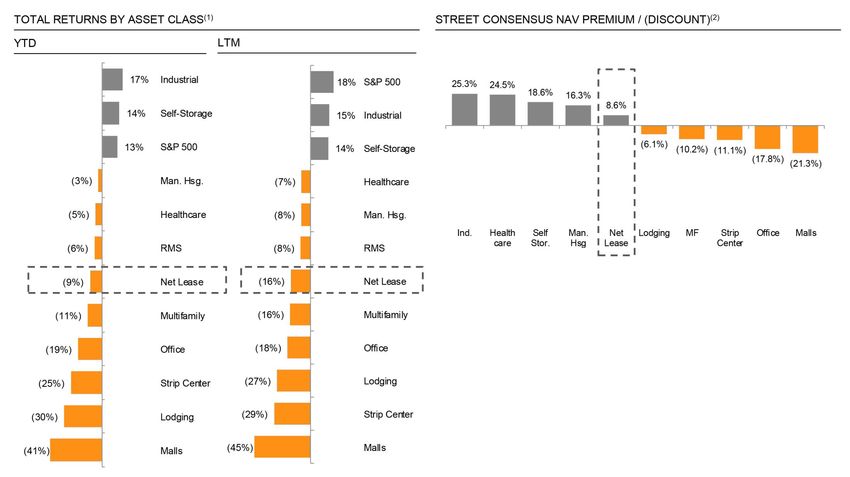
Automotive Dealership Group Profit Centres

       Average revenue / profit % contribution per business segment for major
       North American automotive dealership groups¹

          Parts, service and repair

          Finance and Insurance

          New vehicle sales

          Used vehicle sales
                                                               10%             20%             30%             40%             50%

                              Percentage of total revenue (average)                        Percentage of total profit (average)

(1) Chart data is derived from the public disclosure of AutoCanada, Lithia, Penske Automotive, AutoNation, Group 1 Automotive, Asbury Automotive and Sonic Automotive for the nine months ended Sept 30, 2020

     > 80% OF PROFITS ARE GENERATED FROM REVENUE SOURCES OTHER THAN NEW CAR SALES
                                                                                                                                                                                                                9
APR Rent Collection
Base rent collected & limited rent deferral agreements
100% 94%
Q3 2020 base rent collected Base rent collected for YTD 2020,
under tenant leases and rent with remaining amounts
deferral agreements subject to deferral agreements
Temporary support for our tenants
with no impact to distribution policy
APR HAS WORKED WITH ITS TENANT PARTNERS TO PROVIDE SUPPORT DURING
PANDEMIC-RELATED ECONOMIC DISRUPTION
10Strong Rent Collection
Peer Rent Collection for Q3 2020
100.0% 98.0% 99.0%
95.0% 94.8% 93.4% 95.0% 93.0% 95.9%
92.0%
Automotive Choice Crombie CT REIT First Capital Plaza Retail RioCan Slate Retail SmartCentres Weighted
Properties Properties Average
Source: Scotiabank, based on company filings
A PR IS A TOP PERFORMER AMONG ALL REAL ESTATE SUB-ASSET CLASSES IN RENT COLLECTION
11Growth
Acquisition Growth (July 2015 IPO to Present)

                                                                                       70                                                           2,700,000
• 39 properties (including recent property acquisition in
  Laval, QC) and three expansions                                                      65                                                           2,500,000

• ~$513.5 million combined purchase price                                              60                                                           2,300,000

                                                                                                                                                                Gross Leasable Area (square feet)
• Added ~1.6 million square feet of GLA to portfolio

                                                                Number of Properties
                                                                                       55                                                           2,100,000

• Acquisitions indirectly funded by six fully-subscribed                               50                                                           1,900,000

  equity offerings totaling ~$409.5 million                                            45                                                           1,700,000

• Increased brand, geographic and tenant diversification                               40                                                           1,500,000

• Enhanced capital market liquidity                                                    35                                                           1,300,000

• Accretive to AFFO per Unit                                                           30                                                           1,100,000

• Current acquisition capability of ~ $150 million to 53% LTV                          25                                                           900,000

                                                                                             Q3
                                                                                             Q4
                                                                                             Q1
                                                                                             Q2
                                                                                             Q3
                                                                                             Q4
                                                                                            YTD
                                                                                            2015   2016       2017     2018          2019    2020
                                                                                                          Properties   Gross Leasable Area

                                                                                                                                                                                                    13
Portfolio Diversification & Growth
At July 2015 IPO As at Sept. 30, 2020 ¹
K-W/ Guelph 3.5%
Ottawa / Kingston 12.2%
Regina 18%
Edmonton 7% GTA 27.7%
Markets > GTA 46%
GVA 18%
(By GLA) GMA 17.8%
Regina 8.2%
Calgary 18% GVA 8%
Calgary 11.8%
Winnipeg 3.9%
Tenants >
Dilawri 100% Dilawri 61.9%
Base Rent Dilawri 100%
Investment Properties > $357.6 million $917 million¹
Market capitalization > $180.0 million $515 million²
(1) As at Sept. 30, 2020, plus recent Laval, QC property acquisition
(2) As at January 5, 2021 (Includes Class B units).
14Internalization
Termination of Administration Agreement with Dilawri
• REIT internalization became effective December 31, 2019
• The REIT’s management, operating and support personnel now
employed directly by the REIT
• Consistent with the REIT’s stated strategy to pursue
Internalization once it could be achieved on an economic basis
• No termination fees paid to Dilawri
• Strategic Alliance Agreement between the REIT and Dilawri
remains intact
INTERNALIZATION REPRESENTS IMPORTANT MILESTONE FOR THE REIT
15Further Opportunity to Consolidate Highly Fragmented Industry
Proportion of Canada’s ~ 3,500 Auto Dealerships 10 Dealership Groups: Approximately 11% of the Market
Owned by Size of Ownership Group1
Company Dealerships % of Total
Dilawri Group (2) (3) 76 2.2%
AutoCanada(2) (3) 53 1.5%
Go Auto(2)(3)(4) 46 1.3%
35% Steele Automotive Group (2) 41 1.2%
5 or more Murray Auto Group(2) 33 0.9%
Dealerships 50% Gabriel-Prestige-President
31 0.9%
Single Group(2)
Dealership Zanchin Automotive Group(2) 29 0.8%
Performance Group (2) 28 0.8%
15% Albi Group (2) 20 0.6%
2-4 O’Regan’s Group(2) 20 0.6%
Dealerships Top 10 subtotal 377 10.8%
Other ~ 3,123 89.2%
Total ~ 3,500(1) 100.0%
(1) Source: DesRosiers Automotive Consultants Inc.
(2) Information based on publicly available information
(3) Denotes current tenants of the REIT
(4) Excludes collision centres and RV/Marine dealerships 16Automotive Industry Developments & Evolution
• 373 new / refreshed /redesigned models planned for
production by existing OEMs for 2019 – 2022
• New entrants expected into NA market (China & India)
• Consumer buying habits being met by enhanced dealership
e-commerce offerings and curbside pick-up and service
• Electric vehicles – low penetration, expected to increase
̶ Implication on dealer infrastructure
• Automated vs. autonomous
̶ Automated – safety / technology expected
to be regulated
̶ Autonomous – cultural shift
• Other influencers
̶ Ride Sharing Platforms – Uber, Lyft
CONTINUED FOCUS ON DEALERSHIP MODEL AND CONSOLIDATION
17Stability
Stable Growth Platform

          5.2 years                   3.77%                         95%                      > 80%
     Weighted average term          Weighted average          Portion of total debt at   exposure to VECTOM
     of fixed interest rates¹       fixed interest rate        fixed interest rates¹
             (swaps)                     on debt¹                                             markets1

     12.6 years                        1.1%
         Weighted average
                                     YTD Same Property
                                Cash NOI growth as a result
                                                                   100%                      44.8%
                                                               Effective occupancy           Debt to GBV ¹
           lease term1           of contractual annual rent
                                         increases1

1) As at Sept. 30, 2020
                                                                                                              19
Strong Leasing Profile 1
• Triple-net leases • Weighted average term of 12.6 years
• 96% of leases are indemnified by multi-brand, multi- • Fixed 1.5% annual rent escalator for the 35 Dilawri
location operators (e.g. AutoCanada, Dilawri Group, Go properties over the next 6 – 17 years
Auto and Pfaff Automotive Partners)
Lease Maturity Schedule2
(1) As at Sept. 30, 2020
(2) Based on 12-month rolling average as at Sept. 30, 2020
RELIABLE LONG-TERM CASH FLOW, WITH CONTRACTED, LONG-TERM RENTAL INCOME GROWTH
20Solid Performance for U.S. Net Lease REITS Amid Market Volatility
Source: FactSet, Green Street Advisors, S&P Global
Note: Pricing as of 17-Nov-20, unless noted otherwise.
1. Total returns include change in share price and dividends using a weighted average by market cap.
2. Based on latest data published by Green Street Advisors as of 17-Nov-20 except for net lease sector which is a weighted
average of prem. / (disc.) to NAV based on market capitalization of the peer set as of 17-Nov-20.
21Manufacturer / Brand Diversification
Manufacturers by Region Brands by Market Segment
(% of Cash NOI from Dealership Properties)1 (% of Cash NOI from Dealership Properties)1
North America 8.5% Ultra Luxury5 7.2%
Asia 50% Luxury4 34.5%
Europe 41.5% Mass Market3 58.3%
13.0% 12.6%
10.2% 9.6% Manufacturer / Brand (By % of Dealership GLA)²
8.5%
6.5% 5.9%
4.0% 3.4% 3.4% 3.3% 3.3% 3.3% 3.4%
2.5% 1.8% 1.6% 1.6% 0.8% 0.7% 0.6%
Tesla Other
# of REIT Locations
7 9 7 6 5 6 2 2 3 2 2 4 4 1 4 2 1 2 1 2 7
(1) As at Dec. 31, 2019
(2) As at Sept. 30, 2020, plus Laval, QC, property acquisition
(3) Mass Market segment includes: Chrysler, Ford, General Motors, Kia, Nissan (including Infiniti), Honda, Hyundai, Mazda, Mitsubishi, Subaru, Toyota and Volkswagen
(4) Luxury segment includes: Acura, Audi, BMW, Infiniti, Tesla and Lexus
(5) Ultra-Luxury segment includes: Aston Martin, Bentley, Lamborghini, Land Rover, Lincoln, Porsche, Maserati, McLaren and Mercedes-Benz 8Debt Strategy
• As at Sept. 30, 2020, the REIT had cash on hand of ~$0.4 million, undrawn credit facilities of $60.6 million and nine
unencumbered properties valued at $141.7 million
• Debt to GBV as at Sept. 30, 2020 was 44.8%, compared to 49.6% as at Sept. 30, 2019
• Proactively amended covenants to remove the cap on the REIT’s distributions at 100% of AFFO payout ratio on a rolling four
quarter basis¹
• Certain credit facilities were increased and extended in Q4 2018 / Q1 2019, providing a well-balanced level of annual maturities
• With interest rate SWAPs, the weighted average term to maturity is approximately 5.2 years as at Sept. 30, 2020
Principal Effective Fixed Rate of Amount withdrawn against
At June 30, 2020 ($000s) Maturity Repayment
Amount Interest Revolving Credit Facility
Facility 12 June 2023 $202,930 3.75% $14,400 of $30,000 Open
Facility 23 June 2024 $96,448 3.54% $0 of $15,000 Open
Facility 34 Dec. 2023 $86,688 4.05% $0 of $30,000 Open
Mortgages Multiple $15,049 3.52% n/a Closed
Total/Weighted Average: $399,148 3.77% $14,400 of $75,000
(1) Please refer to the REIT’s Q3 2020 MD&A.
(2) Facility 1 consists a non-revolving loan worth $202.9 million and a $30 million revolving credit facility (of which 14,400 was drawn as at Sept. 30, 2020)
(3) Facility 2 consists of a non-revolving loan worth $96.5 million, and a $15 million revolving credit facility (of which nil was drawn as at Sept. 30, 2020)
(4) Facility 3 consists of a non-revolving loan worth $86.7 million, and a $30 million revolving credit facility (of which nil was drawn as at Sept. 30, 2020)
23Performance
Q3 2020 Financial Review

   Cash NOI ($000s)                                                                                                  FFO ($000s)

                                                 15,243                                                                                                                 11,124
                        13,783                                       Same Property                                                             9,830
                                                                                                                    $0.246                                                                $0.231 ¹
                                                                       Cash NOI                                                                                                            per Unit
                                                                                                                     per Unit
                                                                           1.2%                                      (diluted)                                                             (diluted)
                                                                                                                      81.7%                                                                87.0% ¹
                                                                                                                  Payout Ratio                                                          Payout Ratio

                       Q3 2019                  Q3 2020                                                                                      Q3 2019                   Q3 2020

   AFFO ($000s)                                                                                                      Debt to GBV
                                                  10,338
     $0.224              8,974                                       $0.215 ¹                                                               49.6%
     per Unit                                                        per Unit                                                                                         44.8%
     (diluted)                                                       (diluted)

      89.7%                                                         93.5% ¹
 Payout Ratio                                                     Payout Ratio

                       Q3 2019                   Q3 2020                                                                                   Q3 2019                  Q3 2020
(1) The declines in FFO per Unit and AFFO per Unit in Q3 2020 were primarily due to the issuance of 7,900,500 Units through a $92 million equity offering completed on December 23, 2019 (the “Offering”),
    and the partial deployment of proceeds from the Offering. The FFO and AFFO payout ratios for Q3 2020 were higher as a result of the Offering                                                             25
YTD 2020 Financial Review
($000s, except per unit amounts Nine months ended Nine months ended Variance
and payout ratios) Sept. 30, 2020 Sept. 30, 2019
Revenue from investment properties $ 56,033 $ 49,458 13.3%
Cash NOI 44,914 39,543 13.6%
Same property Cash NOI1 38,066 37,641 1.1%
FFO 32,552 27,165 19.8%
AFFO1 30,165 24,680 22.2%
Per Unit Amounts / Payout Ratios
Distributions $ 0.603 $ 0.603 --
FFO (diluted) 0.677 0.782 -0.105
AFFO (diluted)1 0.627 0.711 -0.084
FFO payout ratio 89.1% 77.1% 12.0%
AFFO payout ratio1 96.2% 84.8% 11.4%
(1) Excluding bad debt expense 26Investment Highlights
• APR a top performer in rent collection, solid growth in key performance
metrics in Q3 2020
• Canadian automotive dealership industry proving its resilience as an essential
business with increasing sales and service levels
̶ Dealers have lowered operating expenses and leveraged e-commerce offerings
• APR’s diversified lead tenants are well positioned to play a leading role in
consolidating automotive dealerships in Canada
• High-quality portfolio of strategically located dealership properties across
Canada, representing 32 global manufacturers / brands
• Long-term, triple-net leases with fixed rent escalators provide stable,
predictable cash flows
• Strong liquidity position with $150 million in acquisition capacity
28
27Appendix
Strong Majority Independent Board

             Name & Domicile                                          Principal Occupation

  Louis Forbes
                                Former Senior Vice President and Chief Financial Officer, CT Real Estate Investment Trust
  Ontario, Canada

  Patricia Kay
                                Former Senior Vice President, Dealer Finance – Bank of America Merrill Lynch
  Massachusetts, US

  Milton Lamb
                                President & CEO of Automotive Properties REIT
  Ontario, Canada

  Stuart Lazier
                                Chairman, Northbridge Investment Management Inc.
  Ontario, Canada

  John Morrison, Lead Trustee
                                Former Vice Chairman, Choice Properties Real Estate Investment Trust
  Ontario, Canada

  Kapil Dilawri, Chair
                                Co-founder, Vice President and Secretary of the Dilawri Group
  Ontario, Canada

  James Matthews
                                Executive Vice President of the Dilawri Group
  Ontario, Canada

MANAGEMENT & TRUSTEES FOCUSED ON LONG-TERM AFFO PER UNIT GROWTH
AND SOUND GOVERNANCE
                                                                                                                            29
Acquisitions with Leading Dealership Tenants
Porsche Centre / Go Mazda Ericksen Infiniti Southtown Hyundai Kentwood Ford
Jaguar Land Rover Edmonton, AB Edmonton, AB Edmonton, AB Edmonton, AB
Edmonton, AB March 2017
December 2015 $8.0 million
$23.2 million for three-property
$23.0 million Portfolio (December 2017)
BMW Laval Sherwood Park VW McNaught Cadillac St. James VW Abbotsford VW Guelph Hyundai Wellington Motors
Montreal, QC Edmonton, AB Buick GMC Winnipeg, MB Abbotsford, BC Guelph, ON Guelph, ON
Winnipeg, MB
$55.5 million for two-property $24.0 million for two-property $30.4 million for three-property
portfolio (Sept. 2018) portfolio (March 2019) portfolio (June 2019)
9 Dealership Portfolio Tesla Service Centre Straightline Kia Tesla Service Centre
Ottawa & Kingston, ON Kitchener-Waterloo, ON Calgary, AB Laval, QC
December 2018 February 2018 December 2019 August 2020
$101.4 million for 303,817 SF across 6 properties $7.5 million $8.4 million $13.5 million
occupied by 9 dealerships, and 5 properties
designated for ancillary dealership services
Pfaff Audi
Brimell Toyota
Vaughan, ON
Scarborough, ON
September 2016
December 2018
$17.2 million
$26.0 million
30Acquisitions with Dilawri as Operating Tenant
Mazda des Sources Heritage Honda
Dorval, QC Calgary, AB
December 2017 April 2017
$8.0 million $23.6 million
Barrie Volkswagen Audi Barrie
Barrie, ON Barrie, ON
March 2017 January 2016
$8.9 million $11.1 million
Mercedes-Benz West Island St. Bruno Audi & Volkswagen
Dollard-des-Ormeaux, QC St. Bruno, QC
December 2016 December 2016
$20.3 million $14.3 million
Toyota Woodland Country Hills Volkswagen
Montreal, QC Calgary, AB
December 2015 June 2018
$7.2 million $18.0 million
Audi Queensway Regina BMW Acura North Vancouver
Toronto, ON Regina, SK North Vancouver, BC
September 2019 February 2020 February 2020
$36.5 million $11.35 million $17.5 million
31Dilawri Group
Dilawri 5-Year Historical Revenues ($millions)
• REIT has the first right to acquire from Dilawri
development and acquisition pipeline
$3,800
o Historically, Dilawri has, on average,
opened or acquired five new automotive $2,810
$3,000
dealerships per year, including two to $2,400
LTM Revenue¹
three automotive dealership properties $2,000 $3.4 Billion
• Pro forma adjusted rent coverage ratio of 3.4x LTM EBITDA¹
as at Sept. 30, 2020 (LTM)
$127.6 Million
• Pro forma adjusted rent coverage ratio of 3.4x
as at Sept. 30, 2019 (LTM) 2015 2016 2017 2018 2019
EBITDA $76.6 $72.8 $94.8 $85.6 $123.7
CAGR of ~10%
1) Unaudited, as at Sept. 30, 2020
ALIGNMENT OF INTERESTS THROUGH DILAWRI’S 25.6% EFFECTIVE OWNERSHIP INTEREST IN THE REIT
32REIT FFO Yield Versus 10-year Government of Canada Bond Yield¹
• REITs/REOCs within TD Securities coverage universe currently trade at a 7.1% spread to the GoC 10-year bond yield,
up 300 basis points from the 5.2% spread at the beginning of 2020, and the long-term average 4.9% spread
(1) Source: TD Securities
REITS / REOCS ARE TRADING WELL ABOVE HISTORICAL SPREAD COMPARED TO 10-YEAR CANADA BOND YIELD
33APR.UN Price Performance
Twelve months ended January 5, 2021
13
12
11
10
9
8
7
6
5
34You can also read