COVID-19 Executive Briefing - Just Style

Page created by Richard Wolfe
 
CONTINUE READING
COVID-19 Executive Briefing - Just Style
COVID-19
Executive Briefing

Understand the COVID-19 outbreak and its impact
on the global economy

Last Updated: January 19, 2022
Fifty-second in the series

                                                                               Copyright @ GlobalData PLC. All rights reserved.
                                                  Reproduction of part or all of this contents without permission is prohibited.
COVID-19 Executive Briefing - Just Style
Key developments
                                                   ▪ The virus has now spread to 199 countries with more than 270 million confirmed cases and more than 5.3
Infection rates continue to increase                                                                                                                                Slide 5
                                                     million deaths.

The US recorded the highest number of infections   ▪ The number of confirmed cases in the US is over 50 million, with more than 800,000 deaths. Deaths in the US
                                                                                                                                                                    Slide 6 – 9
and cases in India continue to rise                  and India are the highest.

                                                   ▪ China has administered the most single doses of COVID-19 vaccines worldwide, followed by India and the US.
Total COVID-19 vaccine doses administered has
                                                   ▪ China leads top economies in the percent of population that received one dose and two doses of vaccine.
surpassed total confirmed cases of COVID-19                                                                                                                         Slide 10 – 16
                                                   ▪ Gibraltar leads in fully vaccinating the largest percentage of its population, but herd immunity threshold
                                                     needs to be re-evaluated.

                                                   ▪ Positive GDP growth is forecast in all countries; 2022 consensus forecast for global GDP growth is currently
Worldwide GDP forecast looks positive                                                                                                                               Slide 18 – 20
                                                     4.5%​.

                                                   ▪ According to the OECD, the nations stood at 5.5% in November 2021 as compared to 5.7% in October 2021.
Unemployment continues to be high                                                                                                                                   Slide 21
                                                     Unemployment rate among G7 nations declined from 4.7% in October 2021 to 4.5% in November 2021

Top countries’ response to COVID-19                ▪ Managing lockdown and recovery measures in the world’s largest economies.                                      Slide 22 – 27

                                                   ▪ Asian nations top of GlobalData’s COVID-19 economic recovery scorecard
Economic recovery                                                                                                                                                   Slide 29 - 50
                                                   ▪ Successful distribution of vaccines has resulted in an upwards revision of GDP growth

                                                   ▪ Concern over the spread of COVID-19 remains volatile, so does the business optimism
GlobalData polls                                   ▪ Hiring prospects continue to improve in 2022                                                                   Slide 52 – 60
                                                   ▪ Offices are expected to return to at least 50% capacity in the next 3-6 months

Sector impact                                      ▪ Sector insight summaries; cross sector indices                                                                 Slide 62 - 75

                                                                                                                                                                                    2
COVID-19 Executive Briefing - Just Style
Contents
COVID-19 Infection Update
▪ Spread of COVID-19
▪ Testing statistics by country
▪ COVID-19 vaccine
Economic Impact
▪ Overview of top economies
▪ Stock market indices and GDP
▪ Unemployment
GlobalData’s economic recovery scorecard
▪ Economic recovery across major nations
GlobalData Polls
▪ Business optimism and future of work
Sectoral Impact
▪ Sector insight summaries
▪ Cross sector indices
▪ Sector winners and losers

Appendices
COVID-19 Executive Briefing - Just Style
1. COVID-19 Infection
Update
COVID-19 Executive Briefing - Just Style
Infection Rates Continue to Rise
Impact of COVID-19 +/- change between 30 November and December 19, 2021
as of December 19, 2021

                                                               Deaths       Recovered         In Treatment
                                                                                                                                                                    12,623,908 new cases in the
           300                                                                                                                                                      past 20 days

                                                                                                                                                                    COUNTRIES/TERRITORIES AFFECTED
           250                                                                                                                                                      199
                                                                                                                                                                    CONFIRMED CASES
           200                                                                                                                                                      274,679,470 + 12,623,908
                     Note: Confirmed cases of COVID-19 does not represent the true
                     extent of cases in each country. The number of confirmed cases is                                                                              IN TREATMENT
Millions

           150       heavily dependent on the extent of testing.                                                                                                    125,444,602 + 12,475,862
                                                                                                                                                                    RECOVERED
           100                                                                                                                                                      143,880,898
                                                                                                                                                                    DEATHS
            50                                                                                                                                                      5,353,970 + 148,046

             0
             Mar 20 Apr 20May 20 Jun 20 Jul 20 Aug 20 Sep 20 Oct 20 Nov 20Dec 20 Jan 21 Feb 21Mar 21 Apr 21May 21 Jun 21 Jul 21 Aug 21 Sep 21 Oct 21 Nov 21Dec 21
 Note: Recovered cases data is not available since Aug’2021
 Source: GlobalData; 2019 Novel Coronavirus COVID-19 (2019-nCoV) Data Repository by Johns Hopkins CSSE                                                                                               5
COVID-19 Executive Briefing - Just Style
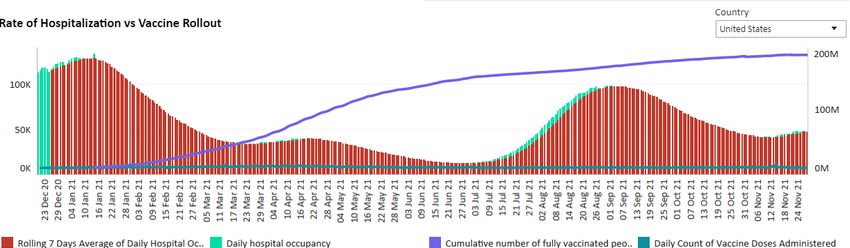
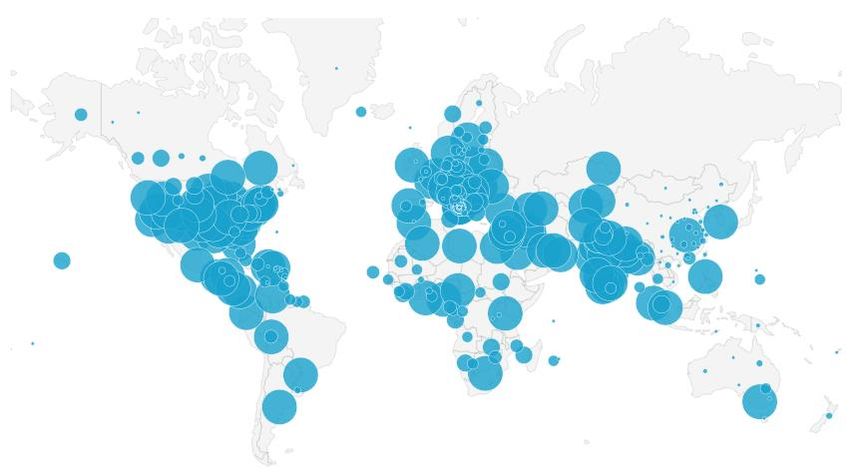
COVID-19 is a Worldwide Problem
Affected Countries
as of December 19, 2021
                                                                                                                        Confirmed    Recovered    Deaths
                                                                                                                        Cases

                                                                                                        United States   50,846,828   12,497,981   806,439
                                                                                                                        +2,431,229   --           +28,339
                                                                                                        India           34,740,275   30,974,748   477,422
                                                                                                                        +159,443     --           +8,632
                                                                                                        Brazil          22,212,343   18,100,232   617,754
                                                                                                                        +127,594     --           +3,378
                                                                                                        United Kingdom 11,425,657    24,692       147,679
                                                                                                                        +1,181,041   --           +2,426
                                                                                                        Russia          10,037,546   5,629,581    291,336
                                                                                                                        +600,896     --           +22,631
                                                                                                        Turkey          9,173,089    5,478,185    80,415
                                                                                                                        +400,747     --           +3,780
                                                                                                        France          8,730,140    415,705      122,478
                                                                                                                        +998,789     --           +2,481
                                                                                                        Germany         6,812,746    3,659,510    108,285
                                                                                                                        +987,120     --           +7,225
                                                                                                        Iran            6,170,979    3,467,765    131,083
Note:                                                                                                                   +57,787      --           +1,372
Confirmed cases of COVID-19 do not represent the true extent of cases in each country. The number of
confirmed cases is heavily dependent on the extent of testing.                                          Spain           5,455,527    150,376      88,708
Recovered cases data is not available since Aug’2021                                                                    +301,604     --           +700

Source: GlobalData; 2019 Novel Coronavirus COVID-19 (2019-nCoV) Data Repository by Johns Hopkins CSSE                                                       6
The United States Continues to Report the Highest Number of Total Confirmed Cases Globally
COVID-19 Confirmed Case Trajectories for Countries With The Highest Infection Numbers
Cumulative confirmed cases, by days since 100th case for top five countries by confirmed cases till the 660th day, as of December 19, 2021

                  50,000,000       Note: Confirmed cases of COVID-19 do not
                                   represent the true extent of cases in each
                  45,000,000       country. The number of confirmed cases is
                                   heavily dependent on the extent of testing.
                  40,000,000

                  35,000,000                                                                                                                                               United States
Confirmed cases

                  30,000,000                                                                                                                                               India

                  25,000,000                                                                                                                                               Brazil

                  20,000,000                                                                                                                                               United Kingdom

                                                                                                                                                                           Russia
                  15,000,000

                  10,000,000

                   5,000,000

                          0
                               0   20   40   60   80 100 120 140 160 180 200 220 240 260 280 300 320 340 360 380 400 420 440 460 480 500 520 540 560 580 600 620 640 660

  Source: GlobalData; 2019 Novel Coronavirus COVID-19 (2019-nCoV) Data Repository by Johns Hopkins CSSE                                                                                     7
GlobalData Pharma Analysis                                                   14-Day Average Rates of Total Confirmed Cases, New Cases, and Deaths Per
▪ In the 4 weeks leading up to December
                                                                              One Million Population
  20, the UK reported the highest rates of           Trends for top infected countries, 14-day average rates per one million population for Nov 22–Dec 19, 2021
  new cases among the top 10 infected                as of December 20, 2021
  countries. While the UK’s fall wave has

                                               Total Confirmed Cases, per 1
                                                                              200,000
  been driven by the Delta variant, more                                                                                                                                                                 Nov 22–Dec 5

                                                    Million population
  than 10,000 new Omicron cases were                                                                                                                                                                     Dec 6–Dec 19
                                                                              150,000
  confirmed in the country as of
  yesterday. Members of the Scientific
                                                                              100,000
  Advisory Group for Emergency warn
  that hospital admissions could reach                                         50,000
  3,000 per day without new measures to
  curb the spread.                                                                     0
▪ France reported the second highest rate                                                  United Kingdom United States    France       Argentina     Turkey    Brazil   Germany       Iran    Russia          India

                                               New cases, per 1 Million
                                                                               1,400
  of new cases among the top 10 infected
                                                                               1,200                                                                                                                     Nov 22–Dec 5
  countries. As in the UK, France’s surge is        population
                                                                                                                                                                                                         Dec 6–Dec 19
  driven by the Delta variant, although                                        1,000
  Omicron has now gained a foothold                                             800
  there. In response to the growing                                             600
  Omicron threat, France has imposed                                            400
  strict travel restrictions on UK visitors.
                                                                                200
▪ The US reached a grim milestone last                                            0
  week, surpassing 800,000 total deaths
                                               Deaths, per 1 Million

                                                                                             United        France         Germany     United States   Turkey    Russia   Argentina     Iran     Brazil          India
  from COVID-19. After trending                                                             Kingdom
                                                   population

  downward earlier in the fall, daily                                          4,000                                                                                                                       Nov 22–Dec 5
  confirmed cases are once again rising                                        3,000                                                                                                                       Dec 6–Dec 19
  and exceeded 202,000 on December 15.                                         2,000
  Daily confirmed deaths have averaged                                         1,000
  over 1,000 during the past several
                                                                                  0
  weeks.                                                                                      Brazil     Argentina    United States     United        Russia   France     Iran       Germany   Turkey          India
                                                                                                                                       Kingdom                                                                         8
                                                         Source: GlobalData
Deaths in the US and India are the highest
 COVID-19 Death Trajectories for Select Countries
 Seven-day rolling average of new deaths, by days since 5th death for top five countries by variant of concern (Delta variant) till the 660th day, as of December 19, 2021

                                     5000

                                     4500                          Note: COVID-19 deaths do not represent
                                                                   the true extent of deaths in each country.
                                     4000                          The number of deaths is heavily
New Deaths (7 day rolling average)

                                                                   dependent on the extent of testing and                                                                               United States
                                     3500                          the attribution criteria used by each
                                                                   country.                                                                                                             United
                                     3000
                                                                                                                                                                                        Kingdom
                                                                                                                                                                                        India
                                     2500

                                     2000                                                                                                                                               Germany

                                     1500                                                                                                                                               Denmark

                                     1000

                                     500

                                        0
                                            0   20   40   60   80 100 120 140 160 180 200 220 240 260 280 300 320 340 360 380 400 420 440 460 480 500 520 540 560 580 600 620 640 660
                                                                                                           Days since 5th death

      Source: GlobalData; 2019 Novel Coronavirus COVID-19 (2019-nCoV) Data Repository by Johns Hopkins CSSE                                                                                             9
Testing for COVID-19
Tests Per Million of Population for Top Economies and Positive Test Rates
as of December 19, 2021

                     Tests Per million of Population for Top Economies                                                                         Positive Test Rates (%)

 United States                                                                  2,094,852                    Brazil                                                                                33.91
 China                                                                          170,266                      Mexico                                                                                24.42
 Japan                                                                          226,999                      Spain                                                                                  8.24
 Germany                                                                        1,069,683                    Germany                                                                                7.60
 India                                                                          481,964                      United States                                                                          7.33
 United Kingdom                                                                 5,582,617                    Japan                                                                                  6.02
 France                                                                         2,770,342                    India                                                                                  5.22
 Italy                                                                          2,156,216                    France                                                                                 4.83
 Brazil                                                                         308,138                      Russia                                                                                 4.28
 Canada                                                                         1,341,625                    Italy                                                                                  4.13
 Russia                                                                         1,607,465                    Canada                                                                                 3.73
 South Korea                                                                    361,312                      South Korea                                                                            3.05
 Spain                                                                          1,416,194                    United Kingdom                                                                         3.01
 Australia                                                                      2,025,823                    Australia                                                                              0.49
 Mexico                                                                         124,924                      China                                                                                  0.04
Note: Positive test rate is derived by this formula: (total confirmed cases/total tests) x 100. For Test Per Million of Population for Top Economies, additions to the previously reported values are in a darker
shade. Canada, Japan, and South Korea reports data related to number of people tested.

The number of the arrow indicates the change in position (shown only for upward movement). For example, Germany and Russia has moved up one place since the last update.
Source: GlobalData; Government/Ministry of Health websites                                                                                                                                                     10
COVID-19 Vaccine Availability by Country
Pfizer/BioNTech Leads in Overall Approvals for COVID-19 Vaccines within Top Economies
as of December 19, 2021

              Comirnaty                                                                             EpiVacCorona                 Ad26COV                              Recombina      Kconvac
                                                                       BBIBP-                                                                             COVID-19
              (BNT162b2                                                        CoronaVa Covaxin     (Vector State     CoviVac       S1      Ad5-CoV                    nt COVID-   (Shenzhen     ZyCoV-D
                           mRNA-1273        AZD-1222       Sputnik V    CorV                                                                              vaccine 2
                    )                                                          c (Sinovac (Bharat   Virology and    (Chumako     (Johnson   (CanSino                  19 Vaccine     Kangtai      (Zydus
                           (Moderna)      (AstraZeneca)   (Gamaleya) (Sinophar                                                                           (Sinopharm
                (Pfizer/                                                        Biotech) Biotech)   Biotechnology    v Centre)       &      Biologics)                 (Chinese     Biological    Cadila)
                                                                     m Group)                                                                               Group)
               BioNTech)                                                                               Center)                   Johnson)                                 CDC)      Products)

US                ✔             ✔              ✖              ✖            ✖        ✖       ✖            ✖             ✖           ✔           ✖            ✖            ✖            ✖            ✖

China             ✖             ✖              ✖              ✖            ✔        ✔       ✖            ✖             ✖           ✖           ✔            ✔            ✔            ✔            ✖

Japan             ✔             ✔              ✔              ✖            ✖        ✖       ✖            ✖             ✖           ✖           ✖            ✖            ✖            ✖            ✖

Germany           ✔             ✔              ✔              ✖            ✖        ✖       ✖            ✖             ✖           ✔           ✖            ✖            ✖            ✖            ✖

India             ✖             ✔              ✔              ✔            ✖        ✖       ✔            ✖             ✖           ✔           ✖            ✖            ✖            ✖            ✔

UK                ✔             ✔              ✔              ✖            ✖        ✖       ✖            ✖             ✖           ✔           ✖            ✖            ✖            ✖            ✖

France            ✔             ✔              ✔              ✖            ✖        ✖       ✖            ✖             ✖           ✔           ✖            ✖            ✖            ✖            ✖

Italy             ✔             ✔              ✔              ✖            ✖        ✖       ✖            ✖             ✖           ✔           ✖            ✖            ✖            ✖            ✖

Brazil            ✔             ✖              ✔              ✔            ✖        ✔       ✔            ✖             ✖           ✔           ✖            ✖            ✖            ✖            ✖

Canada            ✔             ✔              ✔              ✖            ✖        ✖       ✖            ✖             ✖           ✔           ✖            ✖            ✖            ✖            ✖

Russia            ✖             ✖              ✖              ✔            ✖        ✖       ✖            ✔             ✔           ✖           ✖            ✖            ✖            ✖            ✖

South Korea       ✔             ✔              ✔              ✖            ✖        ✖       ✖            ✖             ✖           ✔           ✖            ✖            ✖            ✖            ✖

Spain             ✔             ✔              ✔              ✖            ✖        ✖       ✖            ✖             ✖           ✔           ✖            ✖            ✖            ✖            ✖

Australia         ✔             ✔              ✔              ✖            ✖        ✖       ✖            ✖             ✖           ✔           ✖            ✖            ✖            ✖            ✖

Mexico            ✔             ✔              ✔              ✔            ✔        ✔       ✔            ✖             ✖           ✔           ✔            ✖            ✖            ✖            ✖
                                                                                                                                                                                                            11
Source: GlobalData Pharmaceutical Intelligence Center, Accessed December 19, 2021       ✔ Approval or Emergency Use Authorization (EUA) ✖ Under review or not yet approved
China Leads in Number of COVID-19 Vaccinations, While
▪ China has administered the           Gibraltar Leads in Vaccinations Per 1,000 Population
  most single doses of COVID-         Top 10 Countries/ Regions, Total COVID-19                                               Top 10 Countries/Regions, COVID-19 Vaccine Doses
  19 vaccines worldwide,              Vaccine Doses Administered (N)                                                          Administered Per 1,000 Population
                                      as of December 19, 2021                                                                 as of December 19, 2021
  followed by India and the US.
  However, the US has lost its
                                                   China                                                 2674                       Gibraltar                                   3182
  position in top 10 countries
  globally in the vaccination                       India                           1373                                                Cuba                            2458
  rate per 1,000 population.
                                            United States             494                                                               Chile                        2260

▪ Gibraltar has administered                       Brazil         325                                                    United Arab Emirates                        2252
  the most single doses of
                                               Indonesia         258                                                                   Malta                      2069
  COVID-19 vaccine per 1,000
                                   Market

                                                                                                                Market
  population worldwide,                            Japan        198                                                                  Uruguay                      2000
  followed by Cuba and United
  Arab Emirates.                                Germany         141                                                                   Iceland                     1978

                                                 Mexico         140                                                           Cayman Islands                     1959

                                                  Russia        140                                                                    China                     1920

                                                Pakistan        138                                                                    Israel                   1846

                                                            0    500        1000   1500    2000   2500   3000                                   0    1000     2000       3000      4000

                                                                 Doses Administered (Millions)                                            Doses Administered (Per 1,000 Population)
                                  Note: Figures represent men and women, all ages.                                                                                                        12
                                  Source: GlobalData; Our World In Data
China Leads Top Economies in Percent of Population that Received One Dose of Vaccine; and in
   Percent of Population that Received Two Doses of Vaccine
% of Population Received One Dose and % of Population Received Two Doses for Top Economies
as of December 19, 2021

                      % of Population Received 1 Dose                                               % of Population Received 2 Doses

                   China                                                          84.8            China                                       83.1
           South Korea                                                            84.4      South Korea                                      81.2
                   Spain                                                         82.6             Spain                                      80.4
                 Canada                                                          82.5           Canada                                      79
                   Japan                                                     79.4              Australia                                    78.2
                    Italy                                                    79.3                 Japan                                     77.6
               Australia                                                    78.8                   Italy                                73.5
                  France                                                    77.6                 France                               70.4
                   Brazil                                                   77.3         United Kingdom                               70.4
       United Kingdom                                                      75.4                Germany                                70.4
          United States                                                   72.7                    Brazil                             67.5
               Germany                                                    72.6             United States                         61.8
                 Mexico                                            62.8                         Mexico                        52.8
                    India                                       59.4                             Russia                 43.3
                  Russia                                  49                                       India               40.3

Source: GlobalData; Government/Ministry of Health websites; Our World In Data                                                                        13
Gibraltar Leads in Fully Vaccinating the Largest Percentage of
                                           Its Population But Herd Immunity Threshold Needs to be Re-evaluated
▪ Globally, Gibraltar has the largest
  percentage of its population to         Top 10 Countries/ Regions, Proportion of the Population Fully Vaccinated (%) vs Herd Immunity Threshold,
  have received all required doses of     Men and Women, All Ages
                                          as of December 19, 2021
  the prescribed vaccine, followed by
  United Arab Emirates and Malta.

▪ Gibraltar has the                                               Gibraltar                                                                               119%

  unusual distinction of
                                                       United Arab Emirates                                                                 92%
  vaccinating over 100% of its
  population most likely because it                                  Malta                                                                 90%
  is administering doses
  to individuals who are traveling to                              Portugal                                                               88%
  Gibraltar for vacation or for work,
  but are not technically counted                           Cayman Islands                                                                88%
                                              Market
  as residents, thus the vaccination
  rate can be 100%.                                                   Chile                                                           87%

                                                                 Cambodia                                                          84%

                                                                 Singapore                                                         83%

                                                                     China                                                         83%

                                                                    Brunei                                                         83%

                                                                              0%   20%            40%        60%             80%                 100%   120%     140%
                                                                                                        Proportion Fully Vaccinated (%)

                                                       Fully Vaccinated Herd Immunity Threshold
                                                                                                                                                                        14
                                        Source: GlobalData; Our World In Data
At Present Rate, It Will Take 273 Days to Fully Vaccinate 85% of
▪ At its present rate, the US will have          the Total Population in the United States
  been able to administer two doses               as of December 20, 2021
  of any vaccine to 85% of its entire
  population within 273 days, a                                 400               Days to Reach % Receiving One Dose
  timeframe which is continually
                                                                                  Days to Reach % Receiving Two Doses
  drawn out due to decreasing                                                                                                                                                                339
                                                                350
  vaccination rates in adults, as it
  appears that those willing to
  receive a vaccine have already                                300
                                                                                                                                                      273
  received one. However, this rate
  may increase significantly upon                               250                                   238
  EUA for children under the age of

                                                         Days
  12 to be vaccinated.                                          200
▪ Importantly, a significant
                                                                                                                                                                                 146
  percentage of adults in the US                                150                                                                     131
  remain hesitant to receive a COVID-                                                   115
  19 vaccine, with some surveys                                 100
  indicating that up 30% of US adults
  would “probably” or “never”
                                                                 50
  receive a COVID-19 vaccine. This
  trend may dampen the benefit of
  the vaccine rollout and may make                                -
  the herd immunity target of 70%                                                             75%                                 85%                                                  95%
  difficult to achieve.                                                                                       Percentage of Adult US Population Vaccinated
                                          Note: Estimates were calculated for the US using a combination of publicly available information and data from GlobalData’s COVID-19
                                          dashboard, including the number of individuals in the US having received one or two doses of a COVID-19 vaccine, the number remaining to be
                                          vaccinated, and the current vaccination rate.
                                                                                                                                                                                                   15
                                           Source: GlobalData; Our World In Data
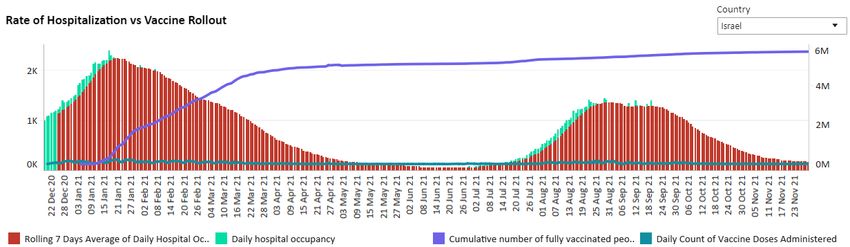
                                           https://www.pewresearch.org/science/2021/03/05/growing-share-of-americans-say-they-plan-to-get-a-COVID-19-vaccine--or-already-have/
The US and Israel Are Seeing an Increase in Hospitalizations Due to the
  GlobalData Pharma Analysis                  Delta Variant and Infections in Unvaccinated Individuals
▪ These charts depict the rate of        Trends for Hospitalizations Rates vs Vaccine Implementation for the US and Israel
                                         as of December 20, 2021
  hospitalization versus the vaccine
  rollout for the US and Israel.
▪ Both countries have shown
  decreases in hospitalization
  following vaccine implementation,
  but with different initial results,
  particularly as the Delta VoC has
  taken hold.
▪ The daily hospitalization rate for
  both countries stabilized and
  subsequently decreased;
  however, vaccine hesitancy and
  removal of social distancing
  measures caused increases in
  hospitalizations, which are now
  declining again, more so in Israel
  than the US.
▪ The increase in hospitalizations was
  worrisome as it was close to the
  peak observed early in 2021. The
  majority of hospitalizations and
  deaths are occurring in unvaccinated
  individuals, though the Delta and
  Omicron variants are easily spread                                                                                         16
  regardless of vaccination status.
                                         Source: GlobalData
2. Economic Impact
Equity indices│ After a widespread crash, markets have returned to pre-COVID valuations
          As of January 18, 2022. Indexed to 100 on January, 2020
Index                                                                                                                                                                                                                 Index
                        US (S&P 500 Index)                           China (Shanghai SE Composite)                            Japan (NIKKEI 225)                                 Germany (DAX)
 150                                                                                                                                                                                                                   150

 100                                                                                                                                                                                                                   100

  50                                                                                                                                                                                                                    50
          Jan-20 May-20 Sep-20 Jan-21 May-21 Sep-21 Jan-22   Jan-20 May-20 Sep-20 Jan-21 May-21 Sep-21 Jan-22   Jan-20 May-20 Sep-20 Jan-21 May-21 Sep-21 Jan-22   Jan-20 May-20 Sep-20 Jan-21 May-21 Sep-21 Jan-22
Index                                                                                                                                                                                                                 Index
 150
                        India (NSE CNX NIFTY)                              France (CAC 40)                                       UK (FTSE 100)                                      Brazil (IBOVESPA)                  150

 100                                                                                                                                                                                                                   100

  50                                                                                                                                                                                                                    50
          Jan-20 May-20 Sep-20 Jan-21 May-21 Sep-21 Jan-22   Jan-20 May-20 Sep-20 Jan-21 May-21 Sep-21 Jan-22   Jan-20 May-20 Sep-20 Jan-21 May-21 Sep-21 Jan-22   Jan-20 May-20 Sep-20 Jan-21 May-21 Sep-21 Jan-22
Index                                                                                                                                                                                                                 Index
 150                        Italy (FTSE MIB)                                  Canada (S&P/TSX 60)                                Russia (IMOEX)                                     South Korea (KOSPI)                 150

 100                                                                                                                                                                                                                    100

  50                                                                                                                                                                                                                       50
          Jan-20 May-20 Sep-20 Jan-21 May-21 Sep-21 Jan-22   Jan-20 May-20 Sep-20 Jan-21 May-21 Sep-21 Jan-22   Jan-20 May-20 Sep-20 Jan-21 May-21 Sep-21 Jan-22   Jan-20 May-20 Sep-20 Jan-21 May-21 Sep-21 Jan-22

       Source: GlobalData                                                                                                                                                                                             18
2022 GDP growth is forecast to be positive in all countries
    Maximum, Minimum and Mean of all new GDP growth estimates by week, as of January 10, 2022
                              World                                                 US                                                  China                                                 Japan
10                                                                                                                                                                                                                        10

5                                                                                                                                                                                                                         5

0                                                                                                                                                                                                                         0
         Jan-21    Apr-21     Jul-21    Oct-21     Jan-22     Jan-21     Apr-21     Jul-21     Oct-21     Jan-22   Jan-21     Apr-21     Jul-21     Oct-21     Jan-22       Jan-21   Apr-21    Jul-21   Oct-21   Jan-22

10
                             Germany                                               India                                                 UK                                                   France
                                                                                                                                                                                                                      10

5                                                                                                                                                                                                                     5

0                                                                                                                                                                                                                     0
         Jan-21     Apr-21     Jul-21     Oct-21     Jan-22   Jan-21     Apr-21     Jul-21     Oct-21     Jan-22   Jan-21     Apr-21     Jul-21     Oct-21     Jan-22       Jan-21   Apr-21    Jul-21   Oct-21   Jan-22

10
                              Italy                                               Brazil                                               Canada
                                                                                                                                                                        10

5
                                                                                                                                                                        5

0
                                                                                                                                                                        0
         Jan-21    Apr-21      Jul-21    Oct-21     Jan-22    Jan-21     Apr-21     Jul-21     Oct-21     Jan-22   Jan-21     Apr-21     Jul-21     Oct-21     Jan-22

     Note: GlobalData use a consensus-based forecasting methodology for its key macroeconomic indicators, which combines and standardizes inputs from up to 32 different contributors.                                    19
     Source: GlobalData; Bloomberg
Consensus expects a global recovery
Estimated 2022 GDP Growth
GDP data as of January 10, 2022

                                  Real GDP Growth (%) Rate Projections                            Countries have positive GDP growth
                                                       Mean Estimate                              ▪   According to China’s General Administration of Customs, the country’s trade surplus rose to
                                          4.2%                                                        $676.4 billion in 2021, the highest since records began in 1950. Exports during the year rose
 Canada
                                                                                                      by 29.9%, driven by higher shipments of mechanical and electronic products. (Jan 14)
                      1.2%
 Brazil                                                                                           ▪   According to the ONS, the UK’s economy grew by 0.9% in November 2021, surpassing its
 Italy                                    4.2%                                                        pre-pandemic level GDP. (Jan 14)

                                         3.9%                                                     ▪   The World Bank projects that the Vietnamese economy will grow by 5.5% in 2022, following
 France                                                                                               an estimated 2.6% growth recorded in 2021. (Jan 13)
                                               4.7%
 UK                                                                                               ▪   According to the World Bank, real GDP growth rate of the Indian economy is forecast at 8.3%
                                                              7.9%                                    in FY22 and by 8.7% in FY23. (Jan 11)
 India
                                         4.0%                                                     ▪   US investment bank Goldman Sachs estimates that the Chinese economy will grow by 4.3%
 Germany                                                                                              in 2022, which is a downward revision from its previous estimate of 4.8% due to expected
                                  3.0%                                                                restrictions on business activity to contain the spread of the Omicron variant. (Jan 11)
 Japan
                                                5.0%                                              ▪   UK thinktank, the Centre for Economics and Business Research (CEBR), projects global
 China                                                                                                economy growth at 4% in 2022, compared to an estimated 5.1% growth in 2021. (Jan 1)
                                           4.5%
 US                                                                                               ▪   Japanese government forecasts that the economy will grow by 3.2% in the fiscal year
                                           4.5%                                                       2022–23, which is an upward revision from the 2.2% previously estimated. (Dec 29)
 Worldwide
                 0%          2%           4%           6%      8%      10%      12%        14%    ▪   Germany's Bundesbank projects that the economy will expand by 4.2% in 2022, which is
                                                                                                      lower than its June projection of 5.2% due to supply-side constraints and spread of the new
                                                                                                      variant. (Dec 17)

Note: GlobalData use a consensus-based forecasting methodology for its key macroeconomic indicators, which combines and standardizes inputs from up to 32 different contributors.
                                                                                                                                                                                                      20
Source: GlobalData; national statistics offices; World Bank; IMF
Unemployment rate declines marginally
 Job Trends
 as of December 14, 2021

 Unemployment headlines
 ▪   According to the OECD, the unemployment rate in OECD nations stood at 5.5% in November 2021, compared to 5.7% in October 2021. Unemployment rate among G7
     nations declined from 4.7% in October 2021 to 4.5% in November 2021. (Jan 17)

 ▪   The unemployment rate in the Euro area stood at 7.2% in November 2021, a marginal decline from 7.3% in October 2021, according to Eurostat. The rate declined during the
     month in France (7.5% in Nov vs 7.6% in Oct), Germany (3.2% vs 3.3%), Spain (14.1% vs 14.4%), and Italy (9.2% vs 9.4%) among others. (Jan 13)

 ▪   123,000 full-time jobs were added in Canada in December 2021, with the unemployment rate declining to 5.9%, according to Statistics Canada. 55,000 jobs were added in
     the goods producing sector, 27,000 jobs in the constructions sector, and 17,000 jobs in the educational services during the month. (Jan 8)

 ▪   According to the Philippine Statistics Authority, the unemployment rate declined to its lowest level since January 2021, to 6.5% in November 2021 from 7.4% in October
     2021. The number of people out of work were at 3.16 million during the month, which is 345,000 less compared to last month. (Jan 7)

 ▪   According to the US Labor Department, 199,000 jobs were added in December 2021, with the unemployment rate declining by 0.3 percentage points to 3.9% in the US. Labor
     force participation rate stood at 61.9% in December 2021, which was unchanged from the previous month but 1.5 percentage points lower when compared to February
     2020. (Jan 7)

 ▪   The unemployment rate (adjusted values) in Germany declined to 3.2% in November 2021 from 3.3% in October 2021. The unemployment rates among men and women
     stood at 3.6% and 2.9%, respectively, during the month according to Destatis. (Jan 4)

 ▪   According to the Center for Monitoring Indian Economy (CMIE), the unemployment rate increased to a four-month high of 7.9% in December 2021, up from 7% in November
     2021. The unemployment rate in urban and rural areas rose to 9.3% and 7.3%, respectively, in December 2021 from 8.2% and 6.4% in the previous month. (Jan 3)

 ▪   According to the Australian Bureau of Statistics, 366,100 jobs were added in the country in November 2021, with the unemployment rate declining by 0.6 percentage points
     over the previous month to 4.6%. (Dec 16)

                                                                                                                                                                                21
Source: GlobalData; International Labour Organization; US Department of Labor; Goldman Sachs; IMF
Response to COVID-19: US and China

                            United States                                                                        China

                           Confirmed cases            50,846,828                                                Confirmed cases       100,285
                           Deaths                         806,439                                               Deaths                  4,634
                           Recovered                  12,497,981                                                Recovered              87,245

Managing lockdown                                                                      Managing lockdown
▪ Wearing of masks in indoor public places has been made mandatory for all in          ▪ The country gradually started easing restrictions from the city of Xi’an in the Henan
  California, Delaware, Hawaii, Illinois, Nevada, New Mexico, New York, Oregon, and      Province. (Jan 16)
  Washington. Indoor mask wearing is mandatory for unvaccinated people in              ▪ Anyang, home to 5.5 million people in the Henan Province, has been put under
  Connecticut. (Jan 14)                                                                  lockdown. Total number of residents under strict quarantine in China increased to
▪ Canada and Curacao moved to the 'Level 4: COVID-19 Very High' category on Jan          20 million. (Jan 13)
  10, 2022. (Jan 11)                                                                   ▪ China bans four more flights operated by Air Canada from Vancouver to China from
                                                                                         Jan 17 onwards. (Jan 12)
▪ Major European nations including France, Germany, Greece, Ireland, Italy, the
  Netherlands, Portugal, Spain, Switzerland, and the UK continue to remain in the US   ▪ China imposed travel curbs by suspending ticket sales for passenger trains from
  Centers for Disease Control and Prevention (CDC)’s Level 4 list. (Jan 5)               the port city of Tianjin to the capital Beijing, after 21 COVID-19 cases were
                                                                                         reported in the port city. (Jan 10)
▪ Azerbaijan, Moldova, Mongolia, Romania, the Bahamas, Sint Maarten, Kenya, and
  Suriname were moved to the 'Level 3: COVID-19 High' category. (Jan 5)                ▪ Locked down the city of Xi’an and Yuzhou in the Henan Province. (Jan 5)

Recovery measures                                                                      Recovery measures
                                                                                       ▪ Overall fiscal stimulus worth $903.4 billion (6.1% of GDP).
▪ The Federal Reserve announced in December 2021 its plans to end its
  pandemic-era bond purchases in March 2022, paving the way for three interest         ▪ The People's Bank of China slashed its one-year loan prime rate by 5bps to 3.8% in
  rate hikes by the end of 2022. (Dec 15)                                                December 2021, to support growth amid property debt woes and persistent
                                                                                         COVID-19 outbreaks. (Dec 20)
▪ Overall stimulus package worth $7.8 trillion (37.2% of GDP).

 Source: GlobalData; Client & Subject Matter Expert Interviews; Press Articles; OECD                                                                                             22
Response to COVID-19: Japan and Germany

                            Japan                                                                                Germany

                           Confirmed cases         1,729,030                                                    Confirmed cases     6,812,746
                           Deaths                     18,375                                                    Deaths               108,285
                           Recovered                 858,305                                                    Recovered           3,659,510

Managing lockdown                                                                       Managing lockdown
▪ All cross-border returnees or travelers to Japan from countries where Omicron         ▪ Effective January 9, 2022, Germany added 39 countries to the list of high-risk
  variant is dominant are required to self-quarantine themselves in their own             areas. Travelers from these countries will face tighter entry restrictions upon their
  residence or accommodation from Jan 15 onwards. (Jan 15)                                arrival in Germany. (Jan 8)
▪ Extends entry ban on non-resident foreigners until the end of Feb 2022. (Jan 11)      ▪ The UK, Botswana, Eswatini, Lesotho, Malawi, Mozambique, Namibia, Zimbabwe,
▪ Effective Dec 5, 2021, Japanese nationals travelling to Japan from India, Greece,       and South Africa moved to list of high-risk areas from Jan 4. (Dec 31)
  Romania and four US states (Colorado, Hawaii, Minnesota, and New York) will have      ▪ Officials have further tightened domestic restrictions nationwide. Individuals will
  to undergo tightened quarantine regulations. (Dec 5)                                    be asked to present proof of a booster vaccine to access certain non-essential
                                                                                          venues. Vaccinated and recovered individuals will also need to produce negative
▪ Effective from Dec 2, 2021, Japan has expanded its travel ban on foreigners with
                                                                                          COVID-19 test result to access these venues. (Jan 8)
  Japanese resident status from ten southern African countries including South
  Africa, Eswatini, Namibia, Zambia, Malawi, Mozambique, Lesotho, Angola,               ▪ Nationwide lockdown announced for all unvaccinated people banning access to all
  Botswana and Zimbabwe. (Dec 1)                                                          except the essential services. (Dec 3)
Recovery measures                                                                       Recovery measures
▪ Total stimulus package worth $3.4 trillion (67.6% of GDP).                            ▪   Approved a stimulus package worth $1.6 trillion. (41.8% of GDP)
▪ The Bank of Japan left its key short-term interest rate unchanged at -0.1% and kept   ▪   The government is expecting to pay out about EUR22 billion (US$26 billion) as
  the target for the 10-year Japanese government bond yield at around 0% in                 part of COVID-19 relief from January 2021 and June 2021 to companies and self-
  December 2021. (Dec 17)                                                                   employed people. (Nov 16)

 Source: GlobalData; Client & Subject Matter Expert Interviews; Press Articles; OECD                                                                                              23
Response to COVID-19: India and UK

                            India                                                                               United Kingdom

                           Confirmed cases 34,740,275                                                           Confirmed cases 11,425,657
                           Deaths                    477,422                                                    Deaths               147,679
                           Recovered             30,974,748                                                     Recovered                N/A

Managing lockdown                                                                       Managing lockdown
▪ As per India's revised travel guidelines (taking effect from January 11, 2022) all    ▪ Restrictions eased in Wales— the number of people allowed in outdoor events
  international passengers will be required to undergo home quarantine for seven          increased to 500 from 50 from January 15 onwards, crowds are allowed to return
  days, even if they test negative upon arrival at airport. (Jan 8)                       to sport events from January 21 onwards, nightclubs will reopen, and gathering in
                                                                                          pubs is no longer limited to six people from January 28 onwards.
▪ An air bubble arrangement between India and Saudi Arabia was effective from
  January 1, 2022. (Dec 24)                                                             ▪ Restrictions eased in Scotland—the limit on the number of people in outdoor
                                                                                          events lifted from January 17 onwards, though the COVID-19 certification scheme
▪ Several Indian states (including Tamil Nadu, West Bengal, Maharashtra, Jharkhand,
                                                                                          remains in place.
  and Karnataka, among others) extended their existing COVID-19 restrictions until
  January 31, 2022. (Dec/Jan)                                                           ▪ England to scrap Plan B measures from January 26 onwards, which includes
                                                                                          compulsory face coverings in all indoor public places. Everyone must show vaccine
▪ Extends ban on scheduled international passenger flights till Jan 31, 2022. (Dec 9)
                                                                                          status or negative test result when entering nightclubs or any large-scale events,
▪ On November 30, 2021, India removed Bangladesh from its list of "at-risk"               people should work from home, and all school staff and pupils must take two
  countries. (Dec 1)                                                                      lateral flow tests a week.
Recovery measures                                                                       ▪ The UK govt. raised the official COVID-19 threat level from three to four on a five-
▪ Benchmark repo rate was kept unchanged at 4% in the Reserve Bank of India’s             point scale due to the emergence of highly transmissible new strain. Score of five
  December 2021 meeting. (Dec 8)                                                          indicates the healthcare system to be overwhelmed. (Dec 12)

▪ Approved total stimulus package worth $418.2 billion (16.3% of GDP).                  Recovery measures
                                                                                        ▪ Stimulus package worth $995.9 billion. (37.8% of GDP)
                                                                                        ▪ The Bank of England increased the bank rate by 15bps to 0.25% in December 2021
 Source: GlobalData; Client & Subject Matter Expert Interviews; Press Articles; OECD      for the first time since the onset of the pandemic, as inflation pressures mounted     24
                                                                                          in the country. (Dec 16)
Response to COVID-19: France and Italy

                             France                                                                            Italy

                           Confirmed cases         8,730,140                                                   Confirmed cases    5,389,155
                           Deaths                    122,478                                                   Deaths              1345,641
                           Recovered                 415,705                                                   Recovered          4,147,979

Managing lockdown                                                                      Managing lockdown
▪ Approved a law that requires people to have a vaccine certificate to enter public    ▪ Super Green Pass has been made mandatory on all forms of public transport from
  venues. (Jan 16)                                                                       January 10 onwards and commuters are obliged to wear FFP2 mask. The pass is
▪ Imposed a mandatory 10-day quarantine on unvaccinated travelers coming to              also required to access indoor and outdoor public venues. (Jan 10)
  France from the US, as the French authorities have added the US to the COVID-19      ▪ All workers above 50 years of age in both the public and private sectors will only
  red list of countries. (Jan 2)                                                         be able to access their workplaces with a Super Green Pass from February 15
▪ Remote working made compulsory where possible and indoor public events                 onwards. (Jan 5)
  gathering limited to 2,000 people from January 3 onwards. (Dec 28)                   ▪ Travelers from Singapore will no longer be permitted to travel to Italy for
▪ French government has introduced a new list marked 'scarlet' that includes 10          non-essential purposes as the latter’s authorities have placed Singapore on the list
  southern African countries including South Africa, Lesotho, Botswana, Zimbabwe,        of countries that are highly affected by COVID-19 (List E). The tightened rules will
  Mozambique, Namibia, Eswatini, Malawi, Zambia, and Mauritius. According to the         remain effective until January 31, 2022. (Dec 18)
  Interior Ministry, scarlet list countries are where there is a particularly active   ▪ Extended the COVID-19 state of emergency until March 2022. Non-vaccinated
  circulation of the virus and/or discovery of a variant likely to present a risk of     people are required to show a proof of negative COVID-19 test (Green Pass) to
  increased transmissibility. (Dec 4)                                                    access any local transport or public venues. (Dec 14)
Recovery measures                                                                      Recovery measures
▪ The overall French stimulus package is worth $725.9 billion (28.0% of GDP).          ▪ Announced stimulus package worth $1.1 trillion (60.9% of GDP).
▪ The government announced a new package of EUR20bn (US$23.67bn) to provide            ▪ Approved stimulus package worth $48.7 billion to support the economy. (May 20)
  aid to small businesses and sectors that have been widely impacted due to the        ▪ Approved a stimulus package worth $37.7 billion to support the economy. (Mar
  coronavirus pandemic. (Oct 29)                                                         19)

 Source: GlobalData; Client & Subject Matter Expert Interviews; Press Articles; OECD                                                                                            25
Response to COVID-19: Brazil and Canada

                            Brazil                                                                               Canada

                           Confirmed cases 22,212,343                                                           Confirmed cases     1,889,428
                           Death                     617,754                                                    Deaths                 30,097
                           Recovered             18,100,232                                                     Recovered           1,406,372

Managing lockdown                                                                       Managing lockdown
▪ According to a new ordinance, international travelers must present proof of           ▪ The Canadian government removed several entry exemptions for travelers who are
  COVID-19 vaccination, a negative test result taken within 72 hours of boarding, and     not fully vaccinated. (Jan 14)
  a completed health declaration to enter Brazil. (Dec 22)                              ▪ Travel between Israel and Canada, for both Israelis and foreigners, is permitted as
                                                                                          Israel scraps its 'red list’. (Jan 6)
▪ Unvaccinated travelers arriving to Brazil by airplane must undergo a mandatory
  five-day quarantine at their destination from December 11 onwards. (Dec 10)           ▪ Lifts travel ban on foreigners from ten African countries including South Africa,
                                                                                          Mozambique, Botswana, Zimbabwe, Lesotho, Eswatini, Namibia, Nigeria, Malawi,
▪ Brazil announced on November 26, 2021, that the country's air borders with South        and Egypt. (Dec 17)
  Africa, Botswana, Eswatini, Lesotho, Namibia and Zimbabwe have been closed.
                                                                                        ▪ The Canadian government announced on Dec 4, 2021, that it would tweak newly
  (Nov 30)
                                                                                          implemented restrictions on travel from South Africa, allowing Canadians to return
▪ The Brazilian carrier GOL Linhas Aereas announced that it is resuming its               home if they have a negative molecular test taken within two days of departure
  international flights to three destinations, Montevideo (Uruguay), Cancún               and leave on flights transiting through Frankfurt on or before Dec 13, 2021. (Dec 5)
  (Mexico), and Punta Cana (Dominican Rep.) in November 2021. In December 2021,
                                                                                        ▪ On November 30, 2021, Canada banned foreign travelers from three more African
  GOL envisages resuming flights to Buenos Aires, Argentina. (Nov 11)
                                                                                          countries including Egypt, Nigeria and Malawi over fears of the spread of the new
Recovery measures                                                                         Omicron variant. (Dec 1)
▪ Brazil's central bank raised the Selic rate by 150 basis points to 9.25% on           Recovery measures
  December 8, 2021. It was the seventh consecutive interest rate hike in 2021. (Dec
  8)                                                                                    ▪ Announced total stimulus package worth $326.1 billion (20.3% of GDP).
▪ Overall stimulus package worth $244 billion (17.8% of GDP).                           ▪ The Bank of Canada kept its target for the overnight rate unchanged at 0.25%. (Dec
                                                                                          8)
 Source: GlobalData; Client & Subject Matter Expert Interviews; Press Articles; OECD                                                                                             26
Response to COVID-19: Russia and Spain

                            Russia                                                                                   Spain

                           Confirmed cases 10,037,546                                                               Confirmed cases     5,455,527
                           Deaths                    291,336                                                        Deaths                 88,708
                           Recovered               5,629,581                                                        Recovered             150,376

Managing lockdown                                                                           Managing lockdown
▪ Foreigners in Russia will be able to obtain a health pass to access public places. This   ▪ All European Union and Schengen Area countries (except Switzerland) will
  will be valid for six months. (Jan 16)                                                      continue to be a part of Spain’s COVID-19 risk list from January 17 to 23. (Jan 16)
▪ Travelers from Botswana, Eswatini, Lesotho, Madagascar, Mozambique, Namibia,              ▪ Extended health control measures have been imposed against the majority of third
  South Africa, Tanzania, and Zimbabwe are barred from entering Russia from                   countries until the end of January 2022. Travelers from third countries who are
  November 28, 2021. Russian nationals who have been to one of those countries or in          unable to present a valid vaccination certificate will be denied entry when reaching
  Hong Kong, China, Israel, and United Kingdom are permitted to enter but will be             Spain for travel purposes. (Dec 30)
  subject to a PCR test upon arrival and self-isolation until they have a confirmed         ▪ Spanish authorities have announced that arrivals from Botswana, Eswatini,
  negative result. (Nov 29)                                                                   Lesotho, Mozambique, Namibia, South Africa, and Zimbabwe will have to
▪ Russian authorities have announced the resumption of air travel with Argentina,             quarantine for 10 days, with the possibility to leave isolation after a virus test on
  Bangladesh, Brazil, Costa Rica and Mongolia; and also lifted all remaining restrictions     day seven. (Nov 29)
  on flights with Mexico, Cuba and Qatar from Dec 1, 2021. Trains to Finland to resume      ▪ Unvaccinated British tourists will be banned from entering Spain from Dec 1, 2021.
  from Dec 12, 2021. (Nov 22)                                                                 (Nov 28)
▪ Authorities in several regions have extended the “non-working week" till the second       ▪ Extended existing travel bans on arrivals from major third countries until
  week of Nov 2021. (Nov 8)                                                                   November 30, 2021. (Nov 1)
Recovery measures                                                                           Recovery measures
▪ Russian government’s overall stimulus package worth $88.8 billion (6.1% of GDP).          ▪ Announced a stimulus of $335.8 billion, equivalent to 26.9% of the country’s GDP.
▪ The Central Bank of Russia raised its benchmark policy rate by 100bps to 8.5% in
  December 2021, the highest since September 2017. (Dec 17)                                 ▪ Announced fresh stimulus package towards struggling sectors such as tourism,
                                                                                              restaurants, and small businesses worth $13.3 billion.
 Source: GlobalData; Client & Subject Matter Expert Interviews; Press Articles; OECD                                                                                                  27
3. Sector Impact
Sector Summaries
Sector insight summaries
                       ▪   Airbus now expects commercial aerospace to recover to pre-COVID levels between 2023 and 2025, led by single-aisle extra long-range aircraft.
                           The potential of further lockdowns and travel bans will impact the Primes unevenly, with Boeing having a higher exposure to the faster
                           recovering US domestic market. Omicron variant likely to complicate things further, returning to the travel bans of early 2020.
                       ▪   Defense markets, although relatively shielded from both immediate demand and supply side shocks, are looking vulnerable in many parts of the
Aerospace, Defense &
                           world as national debates are ignited around fiscal priorities. However, countries with large domestic capacity are utilizing defense as a stimulus
Security
                           measure and to offset impact in related aerospace markets. Both the US & UK defense markets have seen significant uplift as a result.
                       ▪   The future role of the military in supporting civil contingency planning is also under consideration, as is a redefinition of security to implicitly
                           encompass public health and biosecurity aspects. Western supply chain concerns stemming from Chinese-US rivalry have also been exacerbated
                           by COVID-19. This will result in greater FDI scrutiny, multi-sourcing, and onshoring in key areas such as microelectronics.

                       ▪   The vaccination rollout in Western countries was leading to an opening up of society, with more social occasions and a return to the office for
                           some, leading to new incentives to buy more formal clothing, which has helped boost sales of retailers who have a compelling offer. Luxury
Apparel
                           retailers have seen boosts to sales in the APAC region in particular. As a new variant enters Europe there is the fear of further lockdowns hitting
                           sales at a peak period – the so-called Golden Quarter, with the prospect of more inflation cutting spending on discretionary items in Q1 2022.

                       ▪   October’s sales finished broadly in line with expectations as inventory issues continued to bite. There was a marginal improvement in the SAAR
                           for October with the rate easing up to 74.8m from September’s 72.8m. However, for recent context the rate was still the lowest for October
Automotive                 since 2011 when markets were recovering from the global financial crisis. The sales declines that began in August were a watershed moment for
                           not only the 2021 outlook, but also for what 2022 and beyond will look like. Initial results for November look to be more of the same, but just
                           as supply issues are easing the markets have been thrown into more uncertainty due to the looming presence of the Omicron variant.
                       ▪   The volume and velocity of channel shifts amid the pandemic has focused retail banks on operational agility. Redesigning core infrastructure to
                           be more modular has helped reduce interdependencies between processes, expediting time-to-market and limiting overall complexity and cost.
Banking & Payments         As the low interest rate environment continues, agile tech platforms will help banks pivot to new business models, such as Bank-as-a-Service
                           (Baas) propositions and various types of B2B data sharing and/or enrichment. These alternative monetization strategies will bring data security
                           and privacy into even sharper focus, while financial wellness and ESG considerations will also become more important post-pandemic.
                       ▪   Supported by stimulus packages, low interest rates, and other unprecedented policy measures across all major markets, the construction
                           industry is recovering from the severe disruption caused by COVID-19 lockdowns and other containment measures. The infrastructure and
Construction
                           residential sectors have been picking up quickly, but the commercial and industrial construction sectors have suffered from a drop in
                           investment, with planned projects being delayed or canceled.
                                                                                                                                                                                  30
Source: GlobalData
Sector insight summaries
                     •   Consumers continue to retreat within the home as new COVID-19 variants emerge, further fueling at-home food and beverage consumption.
Consumer                 Consumers continue to prioritize food staples with a long shelf life, household care products, and will likely remain cautious with their spending
                         in the future, inhibiting categories deemed ‘non-essential’.

                     •   This year, all channels will continue to gradually recover from the impacts of 2020, though consumers remain cautious of both their social
Foodservice              interaction and spend, as new variants continue to emerge. Potential future lockdown measures will put strain on both the profit and cost
                         sectors and will place a renewed focus on the home delivery channel.

                     •   There is growing pressure on reinsurance rates as the impact of COVID-19 has meant global reinsurers are unable to recover the cost of capital
Insurance                in 2020. Demand from primary insurers impacted by COVID-19 is also anticipated to increase the pressure on rates as the cost of claims begins
                         to mount.

                     •   While companies continue to report recovery in revenues, it continues to be region-specific, with US recovery proving to be more fragile, due to
                         rising Delta cases. The emergence of Omicron adds further uncertainty.
                     •   Companies are reporting supply chain issues, increasing costs and reducing profitability.
Medical/Healthcare   •   In Vitro Diagnostics continues to account for the vast majority of COVID-19 medical devices, accounting for 67% of devices in development,
                         followed by Anesthetic and Respiratory Devices and Hospital IT. This is reflected in device approvals in the last 6 months, with 89% of new
                         devices being In Vitro Diagnostics, likely as a result of these Class 2 devices being more easily able to obtain approval or emergency use
                         authorizations compared to other medical devices.

                     •   Prices of all key commodities grew strongly in 2021, helped by rising demand as well as supply constraints in many cases. However, there were
                         declines in the latter part of the year in gold, platinum, and particularly iron ore. After a steep rise in iron ore prices in the first half of the year,
                         the iron price fell below $100/t in November due to continued steel production curbs in China as the country looked to reduce pollution and
Mining
                         power use. In contrast, the price of aluminum and thermal and coking coal have continued to rise, driven by increased demand and supply
                         constraints. The rise in thermal coal prices was so steep that it led to an intervention by the Chinese government, ordering its major miners to
                         cut prices and increase output.

                                                                                                                                                                                      31
Source: GlobalData
Sector insight summaries
                     •   Surging natural gas prices on European and Asian spot markets have taken the focus away from COVID-19 of late. The two major futures
                         contracts – TTF and JKM – were still trading at record high levels in November 2021. Crude oil prices, however, tumbled late last month due to
Oil & Gas
                         concerns over global economic recovery amid the discovery of the Omicron variant of COVID-19. High inflation and uncertainty over near-term
                         crude demand from the pandemic cloud keep the industry on an edge going into 2022.

                     •   Shelf-stable food and household care packaging continue to be in high demand, while paper & board is anticipated to experience the greatest
Packaging                volume growth this year. Manufacturers should continue to develop hygienic packaging formats as well as packaging optimized for the growing
                         e-commerce channel.

                     •   The race for effective treatments and vaccines continues. Currently there are 6,093 clinical trials for COVID-19 and promising clinical data
                         continue to emerge for COVID-19 vaccines. While large trials have already had data readouts, vaccine manufacturing is underway and
Pharma
                         emergency approvals have been given for multiple vaccines. Clinical trials were disrupted at the height of the pandemic. Trial disruption is
                         levelling off, with 1,072 trials still disrupted and 633 Pharma/Biotech companies and CROs associated with disrupted clinical trials.

                     •   Sustained recovery in electricity demand for most countries has brought the demand close to 2019 levels. Countries like India and China have
Power                    seen a much faster rebound and demand has risen to levels above that in 2019. Renewable energy capacity addition is estimated to be 4%
                         higher in 2020 as compared to 2019.

                     •   Supply chain issues, with stock shortages, caused by outbreaks of the virus in various APAC countries closing down factories, and bottlenecks in
                         shipping, has led to stock disruption and price inflation. Consumers have brought forward buying for Christmas and other Q4 holidays but, their
Retail
                         discretionary spending is being restricted by higher food and energy costs. This is likely to last well into Q1 2022 placing further pressures on
                         non-food retailers.

                     •   The sports industry is proving resilient in the face of COVID-19, with over $12.9bn spent on new or existing sponsorship agreements across the
                         industry. Meanwhile, media rights renewals for major sports and sporting properties remain strong, evidenced by the NFL’s 10 year, $100bn deal
Sports
                         signed in Q1 2021, while the English Premier League is expected to renew its domestic media rights packages without a tender on the same
                         financial terms.
                                                                                                                                                                             32
Source: GlobalData
Sector insight summaries
                      ▪   GlobalData has analyzed the impact of COVID-19 on the leading companies operating in 17 separate sectors within technology, media, and
                          telecoms (TMT), with all TMT sectors negatively impacted by COVID-19 in 2020, although IT Services has been the hardest hit.
Technology, Media &
Telecom               ▪   Despite this, some areas — including telecom services, some telecom infrastructure, and cloud-based solutions — are holding up well or
                          growing. Operators moved forward CAPEX to support critical connectivity requirements and are now restarting 5G, Edge Computing and other
                          initiatives temporarily put on hold or slowed down.

                      ▪   After a summer that created hope for many global destinations due to vaccine rollouts and improved traveler confidence, the outlook now looks
                          significantly bleaker with the global outbreak of the Omicron variant. As infection rates surge across European countries, a sustained rebound
                          from the pandemic looks less likely as many destinations reimplement restrictions upon international travel, and the Netherlands goes back into
                          a national lockdown.
                      ▪   Ski tourism now looks to be a major casualty of the Omicron variant. Skiing hotspots like France, Italy, and Switzerland will be fearing the worst,
Travel & Tourism          with many relying on the upcoming winter months to offset some of the losses experienced in the last two seasons. The COVID-19 situation in
                          Germany could be a key deciding factor on the success of the upcoming European ski season. Germany has more skiers than any other country
                          in Europe, making this source market incredibly important for ski destinations.
                      ▪   Domestic tourism remains an area of intense focus and has led to significant price surges in some markets. However, travel intermediaries are
                          engaging in aggressive marketing towards international travel with some advertising for as late as 2023 to increase revenue. However, even
                          though some borders are re-opening, the pandemic's uncertainty means that many will opt for a staycation in 2022.

                      ▪   Wealth managers are adapting to remote working while managing clients at a key moment of truth: portfolio losses. Millennials are
                          experiencing their first severe market downturn. Baby boomers will appreciate help on how to manage their investments online and assurance
Wealth Management         that digital channels are effective.
                      ▪   Merger and acquisition activity has slowed due to the crisis but has not derailed the giant E-Trade-Morgan Stanley or TD-Ameritrade-Charles
                          Schwab deals and smaller robo-advisers are increasingly being targeted for acquisition.

                                                                                                                                                                                33
Source: GlobalData
Cross-sector Indices
Most sectors now exceed January 2020 valuations
    Comparison of GlobalData’s sector indices since January 2, 2020
                                                                                       •   Pharma and Medical’s recovery is based on availability of an effective treatment or
                                                                                           vaccine and the continued recovery of elective surgical procedures and restoration of
              Change in Equity Index since January 2020                                    home healthcare.
                                                                                       •   The Tech industry's valuation reflects increased demand for telecoms services, security
        Technology
                                                                                           solutions, and cloud-based tools, and speculation that any recovery will require
         Healthcare                                                                        significant technology adoption.
           Oil & Gas                                                                   •   Retail stock prices are holding up better than others; markets expect a quicker return
                                                                                           to normal than other sectors.
          Packaging                                                                    •   Mining companies have benefited from rising prices for gold and other metals
       Construction                                                                    •   In energy markets, Power has fared much better than Oil & Gas. Sustainable energy
          Insurance                                                                        use increased during lockdowns and may feature in many stimulus packages. Oil &
                                                                                           Gas’s short-term woes may continue long into the future if this shift to renewables
            Apparel                                                                        materialises.
             Mining                                                                    •   Continued economic uncertainty could have profound effects on global
Banking & Payments                                                                         Construction. Although construction work is resuming in most major markets, issues
                                                                                           including social distancing measures and supply-chain disruptions prevent activity from
        Automotive                                                                         proceeding at full pace. New projects could also be pushed back or delayed
                ADS                                                                        indefinitely.
            Medical                                                                    •   Insurance is impacted on two main fronts, the first being an increased cost of claims
                                                                                           stemming from COVID-19. The second will be through economic recession reducing
              Power                                                                        new business opportunities and impacting solvency ratios through capital market
               Retail                                                                      volatility.
          Consumer                                                                     •   Despite major shifts away from on-premise to delivery services, Foodservice is hit due
                                                                                           to lockdown restrictions.
        Foodservice                                                                    •   Travel & Tourism is one of hardest hit of all sectors. Confidence in the sector remains
   Travel & Tourism                                                                        low as concerns about the length of the recovery period continue to grow. This
            Pharma                                                                         continues to spill over to Aerospace, but pain is partially mitigated here via exposure
                                                                                           to Defense
                          -5%       0%       5%       10%      15%   20%   25%   30%   •   Automotive's performance, in a down market, can attributed to hype around the
                                                                                           electric vehicle market's prospects.
  as of 29 December 2021. ADS= Aerospace, Defense & Security                                                                                                                    35
  Source: GlobalData
Equity indices have recovered across sectors
         COVID-19 hit all sectors, but recoveries take different trajectories

         Aerospace, Defense & Security                             Apparel                         Automotive                         Banking & Payments                        Construction                         Consumer                 Index
200                                                                                                                                                                                                                                                200

150                                                                                                                                                                                                                                                150

100                                                                                                                                                                                                                                                100

50                                                                                                                                                                                                                                                 50

 0                                                                                                                                                                                                                                                  0
       Jan-20   Jul-20     Jan-21     Jul-21   Jan-20    Jul-20     Jan-21   Jul-21   Jan-20   Jul-20     Jan-21    Jul-21   Jan-20    Jul-20    Jan-21   Jul-21   Jan-20   Jul-20   Jan-21   Jul-21   Jan-20   Jul-20     Jan-21    Jul-21

                    Foodservice                                   Healthcare                            Insurance                               Medical                              Mining                              Oil & Gas            Index
200                                                                                                                                                                                                                                                200

150                                                                                                                                                                                                                                                150

100                                                                                                                                                                                                                                                100

50                                                                                                                                                                                                                                                 50

 0                                                                                                                                                                                                                                                  0
       Jan-20   Jul-20    Jan-21    Jul-21      Jan-20    Jul-20    Jan-21   Jul-21   Jan-20   Jul-20     Jan-21    Jul-21   Jan-20   Jul-20     Jan-21   Jul-21   Jan-20   Jul-20   Jan-21   Jul-21   Jan-20   Jul-20     Jan-21    Jul-21

                         Packaging                                 Pharma                                Power                                  Retail                           Technology                      Travel & Tourism             Index
200                                                                                                                                                                                                                                             200

150                                                                                                                                                                                                                                                150

100                                                                                                                                                                                                                                             100

50                                                                                                                                                                                                                                                 50

 0                                                                                                                                                                                                                                                  0
       Jan-20   Jul-20     Jan-21    Jul-21     Jan-20   Jul-20     Jan-21   Jul-21   Jan-20   Jul-20     Jan-21    Jul-21   Jan-20   Jul-20     Jan-21   Jul-21   Jan-20   Jul-20   Jan-21   Jul-21   Jan-20   Jul-20     Jan-21    Jul-21

      as of 29 December 2021, rebased to 100 on 2 Jan 2020.                                                                                                                                                                                   36
      Source: GlobalData
M&A volumes have recovered for many sectors; outlook for 2022 remains strong
  Technology acquisitions will led the recovery in H1 2021
                                                                                      •   Unlike other indices, the M&A index contains no forward-looking
        Change in M&A Index by Sectors since January 2020                                 sentiment. Equity prices should reflect expectations of future
                                                                                          performance, as will news and company filings. Even the available jobs
            Apparel
                                                                                          index represents a company’s confidence in future requirements for
        Foodservice                                                                       staffing levels.
   Travel & Tourism                                                                   •   Consequently, the deals index showed the steepest decline since
        Automotive                                                                        January 2020 in the first half of 2020.
       Construction                                                                   •   However, the M&A market recovered strongly in the second half of 2020
          Consumer                                                                        and this has continued into 2021.
          Packaging
                                                                                      •   Business priorities have changed and this will impact acquirer's M&A
                                                                                          strategy. Expect more investments in weak business areas highlighted by
                ADS                                                                       COVID-19 crisis, e.g. digitalization and cybersecurity.
              Power                                                                   •   Well-capitalised US and Chinese big tech firms went on a spending spree
           Oil & Gas                                                                      in H2 2020 and this continued in 2021. China's plans will be hindered
             Mining                                                                       due to increased scrutiny by regulators.
               Retail                                                                 •   There will be an increase in carve-out deals to divest non-core business
                                                                                          units across sectors, as most enterprises focus on profitability.
Banking & Payments
                                                                                      •   Increased M&A activity has driven higher valuations in both the public
        Technology                                                                        and private markets.
            Pharma                                                                    •   VC markets saw record levels of activity in 2021, driven by still plentiful
          Insurance                                                                       liquidity and the entry of non-traditional investors.
         Healthcare
            Medical
                          -40%       -20%        0%           20%   40%   60%   80%

 as of 29 December 2021. ADS= Aerospace, Defense & Security                                                                                                             37
 Source: GlobalData
Monthly M&A volumes
         Deals index represents volume of completed or announced deals on a monthly basis, rebased to 100 in Jan 2019

        Aerospace, Defense & Security                         Apparel                        Automotive                        Banking & Payments                     Construction                                Consumer             Index
200                                                                                                                                                                                                                                    200

150                                                                                                                                                                                                                                    150

100                                                                                                                                                                                                                                    100

50                                                                                                                                                                                                                                     50

0                                                                                                                                                                                                                                       0
        Feb-20   Aug-20   Feb-21   Aug-21   Feb-20   Aug-20   Feb-21    Aug-21   Feb-20   Aug-20    Feb-21   Aug-21   Feb-20   Aug-20    Feb-21   Aug-21   Feb-20   Aug-20    Feb-21   Aug-21   Feb-20   Aug-20    Feb-21     Aug-21

                    Foodservice                          Healthcare                           Insurance                                 Medical                              Mining                               Oil & Gas            Index
200                                                                                                                                                                                                                                    200

150                                                                                                                                                                                                                                    150

100                                                                                                                                                                                                                                    100

50                                                                                                                                                                                                                                     50

0                                                                                                                                                                                                                                       0
       Feb-20    Aug-20   Feb-21   Aug-21   Feb-20   Aug-20   Feb-21    Aug-21   Feb-20   Aug-20    Feb-21   Aug-21   Feb-20   Aug-20    Feb-21   Aug-21   Feb-20   Aug-20    Feb-21   Aug-21   Feb-20   Aug-20    Feb-21     Aug-21

                     Packaging                                Pharma                               Power                            Retail                             Technology                          Travel & Tourism            Index
200                                                                                                                                                                                                                                    200

150                                                                                                                                                                                                                                    150

100                                                                                                                                                                                                                                    100

50                                                                                                                                                                                                                                     50

0                                                                                                                                                                                                                                       0
        Feb-20   Aug-20   Feb-21   Aug-21   Feb-20   Aug-20   Feb-21    Aug-21   Feb-20   Aug-20    Feb-21   Aug-21   Feb-20   Aug-20    Feb-21   Aug-21   Feb-20   Aug-20    Feb-21   Aug-21   Feb-20   Aug-20    Feb-21     Aug-21

      as of 29 December 2021                                                                                                                                                                                                            38
      Source: GlobalData
News, jobs, and filing sentiments have turned positive in most sectors
   YTD change in our unique alternative data indices show a recovering trend for most sectors, but not all are equal
                  Available Jobs                                             News Sentiment                                              Filings Sentiment

   Travel & Tourism                                                      Apparel                                               Automotive
        Technology                                              Travel & Tourism                                                 Insurance
Banking & Payments                                                          Retail                                                   Power
             Mining                                                    Insurance                                                   Pharma
        Automotive                                                   Foodservice                                                 Packaging
          Insurance                                                   Healthcare                                                Healthcare
                ADS                                                        Power                                              Construction
              Power                                                    Packaging                                                 Consumer
         Healthcare                                                       Mining                                       Banking & Payments
       Construction                                          Banking & Payments                                                    Medical
            Medical                                                    Consumer                                                   Oil & Gas
           Oil & Gas                                                         ADS                                               Technology
            Pharma                                                   Automotive                                                    Apparel
          Packaging                                                     Oil & Gas                                         Travel & Tourism
          Consumer                                                       Pharma                                                     Mining
            Apparel                                                 Construction                                                       ADS
               Retail                                                    Medical                                                      Retail
        Foodservice                                                  Technology                                                Foodservice

                          0%         50%        100%                                 -20%     0%          20%                                  0%      100%   200%
As of 29 December 2021; ADS= Aerospace, Defense & Security                                                                                                           39
Source: GlobalData
Active jobs have recovered for most sectors
         Jobs index represents adjusted active jobs per company

          Aerospace, Defense & Security                             Apparel                           Automotive                         Banking & Payments                       Construction                           Consumer                 Index
250                                                                                                                                                                                                                                                250

200                                                                                                                                                                                                                                                200

150                                                                                                                                                                                                                                                150

100                                                                                                                                                                                                                                                100

50                                                                                                                                                                                                                                                 50

 0                                                                                                                                                                                                                                                  0
                                                  Jan/20   Jul/20     Jan/21   Jul/21    Jan/20   Jul/20     Jan/21    Jul/21   Jan/20    Jul/20     Jan/21   Jul/21   Jan/20   Jul/20   Jan/21   Jul/21   Jan/20   Jul/20     Jan/21    Jul/21
      Jan/20     Jul/20     Jan/21     Jul/21

                          Foodservice                          Healthcare                                                                          Medical                           Mining                                  Oil & Gas            Index
                                                                                                           Insurance
250                                                                                                                                                                                                                                                250

200                                                                                                                                                                                                                                                200

150                                                                                                                                                                                                                                                150

100                                                                                                                                                                                                                                                100
50                                                                                                                                                                                                                                                 50

 0                                                                                                                                                                                                                                                  0
        Jan/20     Jul/20     Jan/21     Jul/21                                          Jan/20   Jul/20     Jan/21    Jul/21   Jan/20    Jul/20     Jan/21   Jul/21   Jan/20   Jul/20   Jan/21   Jul/21   Jan/20   Jul/20     Jan/21    Jul/21
                                                  Jan/20   Jul/20     Jan/21    Jul/21

                          Packaging                                 Pharma                                  Power                                  Retail                           Technology                       Travel & Tourism             Index
                                                                                                                                                                                                                                                   250
250
                                                                                                                                                                                                                                                   200
200
                                                                                                                                                                                                                                                   150
150
100                                                                                                                                                                                                                                                100

50                                                                                                                                                                                                                                                 50

 0                                                                                                                                                                                                                                                  0
        Jan/20     Jul/20     Jan/21     Jul/21   Jan/20   Jul/20     Jan/21   Jul/21    Jan/20   Jul/20     Jan/21    Jul/21   Jan/20    Jul/20     Jan/21   Jul/21   Jan/20   Jul/20   Jan/21   Jul/21   Jan/20   Jul/20     Jan/21    Jul/21

      as of 29 December 2021, rebased to 100 on 1 Jan 2020.                                                                                                                                                                                       40
      Source: GlobalData
You can also read