CRAFTING THE ENERGY (R)EVOLUTION - Strategic Plan 2022-2028 Turin 15.06.2022 - Italgas
←
→
Page content transcription
If your browser does not render page correctly, please read the page content below
Strategic Plan
  2022-2028

CRAFTING THE
   ENERGY
(R)EVOLUTION
                  Turin
                  15.06.2022

                               1
Italgas a Player
         3
              of the Energy Transition

         12
              Setting the Network
              of Tomorrow

         21   Tier 1 Player in Energy
              Efficiency

         26   Greece

Agenda        Other Opportunities
         30

         34   ESG

         38   Financials

         52   Appendix                   2
Italgas a Player
of the Energy
Transition

                   3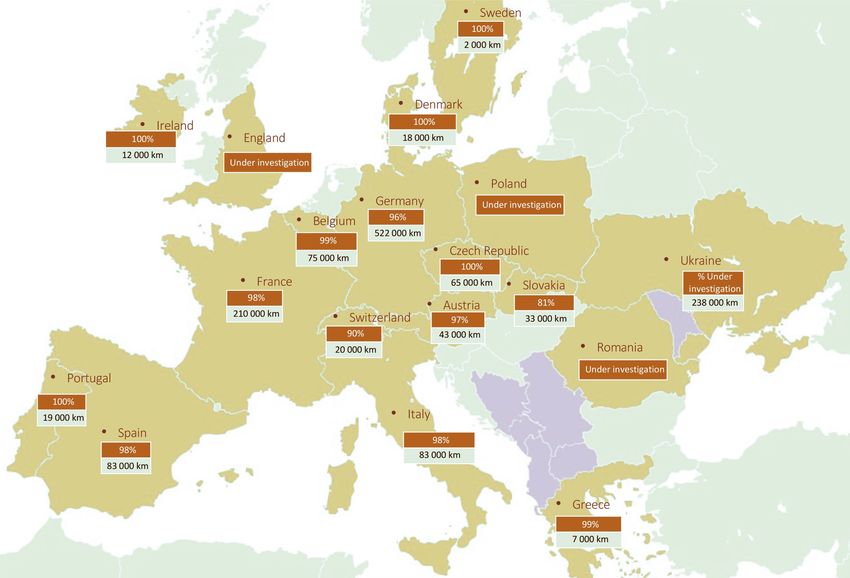
Carbon
                 Neutrality                                         EU politically and financially committed towards a climate
                 is the EU                                          neutral economy by 2050.
                 objective                                                                                                                                            -100%

                                                      Graph based on IEA WEO2021 scenarios3:
Global Gt CO2

                                                           Pre-Paris     APS
                                                                                                                                                               Since Paris 2015
                                                           STEPS           NZE
                40

                30                                                                                                                                             Glasgow pledges

                20
                                                                                                                                                               Ambition gap
                10

2000                                          2010                               2015      2019     2020                2021    2022             2030   2040

                                                                                                                                ⚠
                                                                                                                       IT              REPOWER
                                                                                 Paris            PNIEC1           emissions              EU
                                                                                 COP21                  EU          strategy
                 Source: Italgas elaboration on IEA WEO21
                                                                                                    emissions
                                                                                                     strategy           PNRR2
                                                                                                                                  Ukraine-Russia                       2050
                 Note: (1) Piano Nazionale Integrato Energia e Clima (2)                                                            CONFLICT
                 Piano Nazionale di Ripresa e Resilienza (3) IEA                                                                                                  Net zero-emissions
                 scenarios: STEPS (Stated Policies Scenario) / APS                     EU              Guidelines for

                 (Announced Pledges Scenario) / SDS (Sustainable                    Green Deal        Hydrogen             Glasgow COP26
                 Development Scenario) / NZE (Net Zero Emissions)                                     Strategy                                                                    4
Gas in Europe
dependence                                       Conflict in Ukraine has made the security of supply the core of energy
on Russia is                                     policies, given dependency on Russian energy sources.
topical                                          The crisis struck in a context of already high commodity prices

                                                24%                                                                   40%                                                            22%
 GAS                                              2EU                                                                 ITALY                                                        GREECE
 INCIDENCE IN
 ENERGY MIX1600                                                                     1
                                                                                    0,990                                                    1                 7                                        1,0
                        500         487                      475        489                       77                       76         76                                                         6.4
                                                                                    0,880                                                    1                                                          0,9
                                                                                                                                                               6                           5.5
                                                405                                 0,770                     63                             1
                        400                                                                                                                                                                             0,8
                                                                                    0,660                                                    1                 5                   3.0                  0,7
                                                                                                                                                                        3.6
           300                                                                      0,550                                                    1                                                          0,6
 GAS SUPPLIES                                                                                                                                                  4
                                                                                                                                             1
 AND RUSSIAN                                                                        0,440                                                                                                           48% 0,5
                                                                                                                                                               3
           200                                                                32% 0,330                                                  38% 0                                                          0,4
 SHARE                                                                                                                                       0                 2                                        0,3
                                                                                    0,220                                                    0
                        100                                                                                                                                                                             0,2
                                                                                    0,110                                                    0                 1
                                                                                                                                                                                                        0,1
                           0                                                        0 0                                                      0                 0                                        0,0
                                  2009         2014        2019         2021                    2009        2014         2019         2021                            2009         2014   2019   2021

               Domestic production (bcm)                            Russian gas supply (bcm)                             Other gas supply (bcm)                    Russian share (%)
Source: IEA – Gas Market and Russian Supply, Eurostat 2020 data, Snam gas balance 2021, MiTE Gas Balance 2021, Eurostat 2020 data, IEA - Reliance on Russian Fossil Fuels Data Explorer
Note: (1) Gross available energy; (2) Data include UK
                                                                                                                                                                                                         5
REPowerEU
a tipping                                     The REPowerEU plan sets a new multi-year path, accelerates the energy
point                                         transition, creates the basis for a proper Energy Union, increases security of
                                              supply and reduces dependence on Russia

                                                                                                                            35
                          Short-term                                                                            17
                                                                                               Biomethane
                          • Diversification of gas pipeline routes
                          • Additional LNG under current infrastructure or new FSRU units       Production
                                                                                                       bcm     2030         2030
                          • Demand-side behavioural measures                                                  Fitfor55   REPowerEU
                          • Energy efficiency investments
                          • Industry gas prioritisation (emergency measure)
                                                                                                                            20
                          • Common purchase of gas                                               Hydrogen
 REPowerEU                                                                                      Production       5
 MULTI-YEAR               Medium-term:                                                           & Imports
 PATH                     • Energy efficiency investments and innovation                                mt     2030         2030
                          • Development of bio-methane production and infrastructure                          Fitfor55   REPowerEU

                          • Additional electricity renewable production
                          • Investment in power networks and storage                                                        13%
                          • Additional LNG/gas pipeline infrastructures and investments             Energy      9%
                            to adapt existing gas networks to biomethane and green-hydrogen      Efficiency
                          • Development of green-hydrogen production and hydrogen                   target1
                            infrastructure                                                               %     2030         2030
                                                                                                              Fitfor55   REPowerEU    NET ZERO
                                                                                                                                     EMISSIONS
Source: REPowerEU, Commission staff working document                                                                                             6
Note: (1) vs PRIMES 2020
Biomethane
growing                                          Biomethane accounts for 5% of EU gas demand.
appreciation                                     Offers significant advantages in terms of assets readiness.
                                                 Still below potential, but part of REPowerEU plan.

                                                EUROPEAN
                                         CAPACITY GROWTH                                               •   Carbon neutral as CO2 emitted equals
                                                                                                           that previously captured
                                   +112%
                                         vs 2018
                                                                    number of                          •   Potential for becoming Carbon
                                                                  biomethane                               Negative if production integrated with
                                                                         plants                            CCS-CCUS units
                                                1023                                     Benefits of
                                 729
               483                                                   in Europe           Biomethane    •   High combustion quality
              2018              2020               2021                                                •   Technological readiness
              15.4
                                                                                                       •   Flexible and programmable resource
                                                               Biogas inland                               (plan production and storage of energy)
                            8.1
                                                               consumption                             •   Promotion of circular economy models
                                         2.2
                                                      1.2          in Europe
                                                                                   bcm

                                                                                                                                                     7
Source: EBA data for biomethane plants; consumption elaboration on Eurostat 2020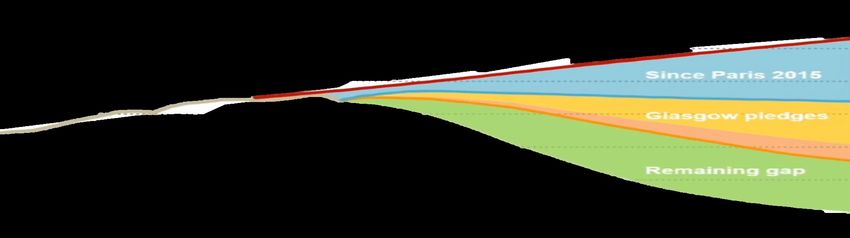
Biomethane
under-exploited                                   Italy is the world’s fourth largest biogas producer1
opportunity                                       Biomethane production is expected to accelerate in the coming years
                                                  supported by regulation

                                                                                   PURIFICATION
                        FROM BIOGAS                                                  UPGRADE
                                                                                                                                               TO BIOMETHANE
                In Italy, ~2,0003 plants                                                                  In 2021 less than 0.5bcm of biomethane were produced in Italy.
              produce 2.2 Bcm of biogas,                                                                           Significant growth targeted by 2030 and 2050.
                mainly from agricultural                                                            Current incentive scheme is expected to be revised and improved in order to
                       feedstocks                                                                             foster biomethane production, including capex subsidies.

                               WATER TREATMENT                                                                                                                                  FARMING
                                        4%                                         Biomethane production outlook Italy                                                            5%      WATER TREATMENT
          FARMING                                                                  Bcm
                                                                                                                               15
                                                                                                                                                                                                 4%
            29%
                                                                                                                                                          ~54
                                                                                                                                                                                                       AGRICULTURE
                                                                                                                                                        PLANTS
                                                                                                            5.5-8.5                                                                                    25%
                                          AGRICULTURE
                                                                                                                                                       IN ITALY 4
              OFMSW2
                                          49%                                                 0.3
               18%                                                                                                                                                         OFMSW2
                                                                                             2021            2030            2050                                           66%
Source: elaboration on Eurostat 2020, Snam, GSE, Italian National Plan for Recovery and Resilience (PNRR)                                                                                                                8
Note: (1) After Germany, China and US. (2) OFMSW – Organic Fraction Municipal Solid Waste (3) % based on the total number of plants (4) 2021, 54 plants in operation and additional ~50 to be connected to the network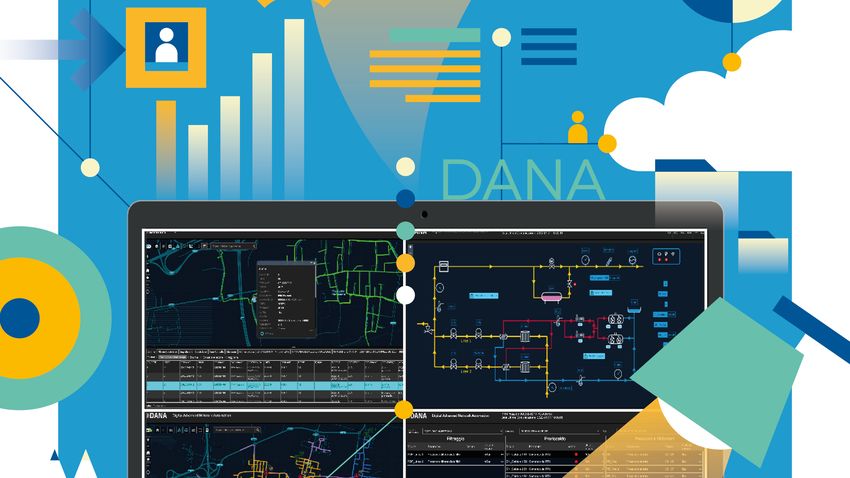
Hydrogen
momentum
                                           More than 335 hydrogen projects in Europe with focus on infrastructure
building, with                             retrofitting (25%) and integrated projects (24%)
Europe playing                             Europe also at the forefront of regulation
a leading role

   Retrofitting/repurposing
     existing infrastructure                        84

      Integrated H2 project
                                                    81
(production, transport, use)

        H2 at end-user level                     72

               H2 production                   60

                   H2 storage             34

                 New built H2             6
                infrastructure
                                               # Projects

Source: ENTSO-G Hydrogen Projects Database, June 2022
                                                                                                                    9
Hydrogen
distribution
unappreciated                                              96% (1 151 000 km) of network H2Ready (material ready)

high level of                                              1 193 000 km of pipelines in total

readiness

         By 2040 ~67% of EU
         distribution network
        planned to be ready to
         carry pure hydrogen1

                                     67%

              24%

              2035                   2040
                                                                                                                                                                countries with members
                                                                                                                                                                countries with associated
Note: (1) Results refer to networks analysed of H2Ready network’s members and % in map represent level of potential compatibility with hydrogen of materials,
not of components that are getting tested                                                                                                                                        10
Source: EHB report April 2022, Ready4H2: Europe’s Local Hydrogen Networks
REPowerEU
and ITALGAS’
STRATEGY
Foster energy transition & contribute to security of supply
Development, injection, widespread usage of green-gases in networks.
Repurposing of Italian gas network into a smart one
Upgrade and repurposing to increase efficiencies and resilience, enable
green-gases distribution, via digital transformation.
Since 2017
Italgas’ Strategy
Emission reduction and energy efficiency, also via ESCo business
anticipated the change.
Decarbonization of operations and full deployment of energy efficiency
Already aligned initiatives.
with REPowerEU
new targets and External growth/ New opportunities
guidelines Acquisition, network development, tenders; growth in water and digital
services.
Contribution to Italian and
Greek energy transition and Greece
energy security over the Depa Infrastructure acquisition and development.
long term
11Setting the
Network
Of Tomorrow
12Smart Gas
Networks Italian network investment plan perfectly aligned with the long term objectives
at the core of of the REPowerEU
our
investments Digital sub-networks Central Control Room (DANA)
Digital sub-networks
Network digital Smart Segmentation
endpoints Metering valves
Biomethane
Reverse flow H2 Blending
City gate
District
Governors
Turbo- Cathodic protection Gas Quality Tracking
CH4 expansion
Environmental data
Storage
Electrolyser
Co-generation Auto-consumption
EE RES Power to Gas
production
13
TSO NetworkAssets
Digitization
Assets Digitization
City gates upgrade, including remote control
1 systems
Biomethane connections & reverse flow connections
2 at IPRM
District governors GRFD/GMPV replacement and
SMART METERS1 3 upgrade
Working to develop new in-house hydrogen
ready smart meter. Progressive substitution of ~7,500
~7,300
GPRS based meters also due to technology ~6,700
phase out by TELCOs ~5,100
8.3 ~3,300
7.9 8.1 8.1 8.2 8.2 8.3
0.05
1.5
3.0
4.5
Stock 2022 2023 2024 2028
# of installed GRFD devices
7.9 8.1 8.1 8.1
6.7 Gas distribution network upgrade, including THT and
5.3 4 gas quality monitoring
3.9
5 Central Control Room (Dana)
2022 2023 2024 2025 2026 2027 2028
Smart meters ITG Smart Meter
6 Other 14
Note: (1) meters gross of disposalsInnovation
multiple Innovation driven by a combination of internal R&D, open innovation and
approaches venture capital investing Leverage on internal and external capabilities
nourishing the
transformation
Internal Open Venture
R&d Innovation Capital
Investing
>€0.2bn
CAPEX Digital factory International «open innovation» Participation in corporate
2022-28 the first accelerator of the scouting in main ecosystems, venture capital initiatives to get
digital transformation leading to adoption and in contact with high potential
industrialization of new cutting SME / start-ups with positive
Italgas lab revamping and edge technologies impact for gas distribution
new renewable gases sector
testing centre in Sardinia
Design new Italgas MAIN FOCUS
smart meter USA CANADA ISRAEL EUROPE UK
Power to gas project
and biomethane
connections
+ Other countries
15DANA
a comprehensive
output of
innovation Cartographic navigation of digitized Synoptics
networks and subnets and HMIs
DANA, our command-and-control system Events and alarms
revolutionising network supervision
Measurements and
3 MAJOR BENEFITS: parameters
• Monitoring of a distributed system where
physical variables are interdependent
• Remote management with commands on
main network processes and plants and
increased governed processes efficiency Feedback Remote control actions, real-time
and flexibility from the field data and historical trends
• Enabler of renewable gases management
16Italgas and
Biomethane Anticipate a step-up in connection requests over 2022-28
Working with producers to define best technical solutions
~€0.1bn
CAPEX
2022-28
Request
Feasibility
Assessment From 80/20 to 20/80 ~150
CONNECTIONS
BIOMETHANE
PRODUCER
55
Since 2019
2 pilot reverse flow projects under
evaluation while waiting for regulation
7 definition1
NETWORK Ongoing
MANAGER
23 PILOT REVERSE FLOW
Positively PROJECTS
assessed ü OSTIGLIA
3 ü MANDURIA AVETRANA
Quotations to
customer 1ARERA consultation document published 17Italgas and
Hydrogen
pulling several
levers
Ongoing assessment, upgrade and digitization of the network to allow
distribution of green gases as well as to increase efficiency and reliability
Design of new H2 ready smart meter
Development and construction of a P2G pilot project in Sardinia to test the
Several entire green hydrogen value chain, including implications on equipment
initiatives ongoing
to ensure network
readiness for Hydrogen Lab to be located next to ITG P2G plant in Sardinia to test boilers/
hydrogen water heaters, gas metering and odorization, gas quality check equipment,
distribution and piping and gas meters aging
H2
blending
MOU with Buzzi Unicem for the development of a feasibility study relating
to the construction of P2G plants in combination with Carbon Capture
Systems in Buzzi Unicem's production sites
International partnerships for knowledge sharing, like those
with Jemena (Australia) and Marubeni (Japan)
18Hydrogen
Readiness Preliminary results of Italgas’ network technical assessment has showed
equipment high levels of compatibility with hydrogen blends up to 10%
testing
Completed
Analysis and preliminary assessment of
Phase 1 suitability to distribute a natural gas /
hydrogen blends in networks and
Distribution pressure reduction stations.
network
compatibility to
H2 under test
Identification of sample networks to
Phase 2 test materials and equipment on site
and in collaboration with internal R&D
Ongoing evaluation of laboratories
Italgas network
compatibility in order to
identify the investments
necessary to upgrade the
network
19Hydrogen
Readiness An example of sector coupling.
Italgas P2G Basic design completed; permitting
project & procurement ongoing.
Expected to be in operation
in 2023
Sestu
Control
Electrical and control
Owned RES Plant 1 MW cabinet
Electrolyser 0.5 MW
Storage & blending 300 kg
Refuelling station 300 kg/d
+ Equipment testing
20Tier 1 Player
in Energy
Efficiency
21Energy
Efficiency REPowerEU enhanced energy efficiency targets at EU wide levels
a EU priority Existing Italian targets already require additional efforts to 2030
Final energy consumption 2007-2030 Final energy consumption 2020 Reduction objective by 20301
Mtoe Mtoe
Mtoe
155 -40% Residential 29.0 -2.6 -10.6%
131
113 112 Tertiary 23.9 -1.0 -14.5%
103
EU PRIMES SCENARIO
93.8
PNIEC targets Industry 16.6 -2.4 -3.6%
-40% final energy by
2030 vs Primes
scenarios2007. Transport 30.7 -3.3 -10.8%
PNIEC
PNIEC2030 implies
-16% 2021-30
2007 2019 2020 2021 TOTAL ∼100 -9.3 -9.0%
2030
2030 -9% 2020-30
Source: Final energy consumption Eurostat; target consumption from PNIEC
Note: (1) PNIEC defines savings expected over the period 2021-2030 based on the ~40% target vs PRIMES 2007 scenario 22Energy
Efficiency Meeting the targets implies a strong market outlook, while awareness of
strong market benefits increases
outlook for Consolidation opportunity, given overly fragmented market
ESCos
Small size Large size
(≦ €25m rev.) (> €25m rev.)
Size of the Italian
Energy Services market 379 Certified ESCos 88% 12%
€
~8bn
10,309 Employees
~6bn
~5bn
Residential
ESCos in Total revenues
€3.5bn ~3 m€ ~56 m€
2020 (9.4M€ on average)
Industrial
2020 2022 2028 EBITDA
€0.4bn
(10% average margin)
Source: McKinsey elaboration based on Digital Energy Efficiency Report 2021, Politecnico di Milano; Smart Building Report 2021, Politecnico di Milano;
23ESCos
3 pillars / 4 Since its foundation, Seaside has expanded its business through
core areas organic growth and M&A, also offering services to the Group
strategy Ceresa to be merged with Seaside in July 2022
Internal Organic External
effort growth growth
Support Italgas energy Leverage and expand existing M&A initiatives to expand the
transition, providing services client base focusing on digital scale of services offered and to
within the Group services, heat plants management consolidate a fragmented sector
Key asset for tenders and building renovation Selective approach
4 CORE
FOCUS
AREAS
INDUSTRY PUBLIC SUSTAINABILITY /
BUILDING
SERVICES SECTOR ENVIRONMENT 24ESCos
key targets Targets enhanced aiming at 6-8% market share
Majority of capex dedicated to M&A
Acquire new added value competences and clients development
Capex Operating performance
Growing revenues contribution
Internal Growth from increasing market share
>10x
~€340mn
CAPEX EPC / Industrial Market
2022-28Greece
26DEPA
Infrastructure DEPA Infrastructure is the holding company which owns the three gas
in a nutshell distribution operators EDA Thess1, EDA Attikis2 and DEDA3 in Greece
The three distribution network 1 Thessaloniki Thessaly regions
operators have exclusive
rights in their respective 2 Attiki region
regions. Combined, they cover
the quasi-entirety of the Greek 3 Other territories
market.
Penetration rate is set to
increase sharply to let Greece
reach its decarbonization
goals
(1) Thessaloniki – Thessalia Gas Distribution S.A.
(2) Attiki Natural Gas Distribution Single Member Company S.A. 27
(3) Public Gas Distribution Networks S.A.DEPA
Infrastructure
timeline update
BidCo Transaction
perimeter
► RAE approval pending for closing. Antitrust
approval granted in March 2022
► Italgas to acquire DEPA Infrastructure
through an Italian BidCo
51% 100% 100%
► Consideration of €7331 mn for 100% of the EDA Thess EDA Attikis DEDA
equity of DEPA Infrastructure2
Note: (1) As of 31/12/2020, (2) DEPA signed an agreement for the acquisition of the remaining 49% of EDA Thess at pre-agreed conditions, post closing, source European Commission,
Enhanced Surveillance Report – Greece, June 2021 28DEPA
Infrastructure Pending closing the plan incorporates preliminary
key plan projections provided by the targets
assumptions
REDELIVERY POINTS RAB
0.9 >1bn ~€1.8bn
793 ACQUISITION,
737 DEVELOPMENT &
664
0.51 0.55 MAINTENANCE
CAPEX
2022-28
FY20 FY21 FY28E FY20 FY21E FY22E FY28E
mn €mn
Note: RAB 2020-22 from RAE 29Other Opportunities 30 30
Water
committed to                               Best practices in gas network management applied to water networks to make
scale up our                               water distribution more sustainable and reduce losses
presence                                   Targeting selective acquisition

                          Italgas Acqua                                                   Strategic Positioning

                                                                      ★ Deep understanding of the regulation and knowledge of
                                  Serving 5 municipalities               the business
                                in the province of Caserta
                             100% of the network remotely
                                                                      ★ Expertise in managing pipeline networks, improving their
                                                                         performance & solid partnerships with technical experts
                                                controlled
                                                                      ★ Opportunity to digitise new grids replicating what
                                                                         Italgas’ model
                                                                      ★ Sustainability focus
                        Plan Period, digitization continues
                         CEM technology1 implementation
                              NB-IoT smart meters roll-out
                                                                          Scouting for M&A
                                                                            opportunities
                                                                                                         €160mn
                                                                                                              CAPEX2
                                                                                                              2022-28

Note: (1) CEM Central Event Management; (2) Organic and M&A
                                                                                                                                   31
Bludigit
the digital Competence centre for the entire Group, unlocking value
company of of proprietary solutions in the market
Italgas Group
Bludigit Objectives
Technological Portfolio Optimisation: ensure the constant
Spun-off in July 2021
update of technologies while optimizing costs
Brings together all the Information
Technology (IT) activities and the
Digital Factory Business Goal Enablement: develop digital services
available to the business, improving resiliency and
Fully owned by Italgas scalability
Commercial service development: open sales channels and
new partnerships
32Bludigit
pushing capex
effectiveness Capexforce is the further step in capex management effectiveness.
Integrated with proprietary solutions, tailored for our core business.
with Capexforce
Solution created by and
CAPEXFORCE
End-to-end digital Advantages
solution, for the
optimization of the
Increase capital productivity: roadblocks and downtimes
capital investment
removal through improved end-to-end visibility
cycle
Leverages on Salesforce Push digital transformation: simplification and automation
technology and on an of internal processes involved, i.e. Planning, Engineering,
ecosystem of proprietary Permitting, Procurement, Deployment, Operations
solutions (e.g. WorkOnSite,
ShareView) to ensure on-quality New business opportunities: proprietary solutions offered
and on-time deployment of as license to energy and infrastructure operators
capex
33ESG targets 34 34
ESG
environmental
targets                                                                                                 -27% 2020-28
enhanced                                                                                                -33% 2020-30

                                              Net Energy
                                              Consumption1

                                                                                    FY 2020

                                                                                              FY 2021

                                                                                                                   FY 2027

                                                                                                                             FY 2028

                                                                                                                                       FY 2030
                                                                               TJ
                                                      Efficiency measures for industrial consumption: preheating processes,
                                                      onsite renewable energy production and auto-consumption, digitalization
   Actions identified                                 of monitoring and control systems of the plants
   and reflected into
      capex plan                                      Office management and buildings renovation effort together with
                                                      constant process of optimisation, renewal, digitalization of monitoring
                                                      and control systems of the buildings

                                                      Optimisation and renewal of the car fleet

Note: (1) unchanged perimeter, ie excluding M&A, DEPA Infrastructure and tenders
                                                                                                                                                 35
ESG
new Net Zero
and Scope 3
reduction -34% 2020-28 Picarro and Smart Maintenance
targets -42% 2020-30 Energy Efficiency initiatives
Scope 1&2
NEW
emissions
103t CO2 eq
2050
FY 2020
FY 2021
FY 2027
FY 2028
FY 2030
reduction
Net Zero
targets1
Carbon
-30% 2020-28 Supply chain engagement
Actions identified
-33% 2020-30 Carbon removal initiatives3
and reflected into
capex plan
Scope 3
NEW
emission
103t CO2 eq
2050
FY 2020
FY 2028
FY 2030
reduction
Net Zero
target1, 2
Carbon
Note: (1) unchanged perimeter, ie excluding M&A, DEPA Infrastructure and tenders (market based scope 2), targets aligned with SBTi in terms of linear annual reduction and in absence of SBTI 36
methodology for gas distribution; (2) baseline recalculated taking into account specific suppliers’ emission factors; (3) post 2030;ESG
social targets
prove the
25-27%
change is 81-85%
77% 79%
ongoing 22%
17%
Engagement Women in
FY 2020
FY 2021
FY 2028
FY 2020
FY 2021
FY 2028
responsibility
Net Promoter Score (NPS)
roles
%
%
38
52.4 50.5
49.5
29 45.5
19
Training Average
FY 2020
FY 2021
FY 2028
FY 2016
FY 2021
FY 2028
FY 2020
hours age
Hours per employee years
Total over plan period 600k
37Financials
38Investments
allocation
reflects new Greece
contest €1.8 bn3
Italian gas distribution
base perimeter net of
Diversification w ork Disposals €4.5 bn2
et
€ 0.5bn Wate
N
€8.6bn
r
ESCo & Water • DIGITIZATION
ESCo
• NETWORK
2022-28 • SARDINIA
• CENTRALISED
n
tio
Tenders • M&A
a
Centralised
iz
git
Sardinia
€ 1.8 bn3 • DISPOSALS
Di
M&A
Note: (1) Net of divestment. Gross of divestment capex is €8.9bn; (2) Net of divestment; (3) Net capital employed and induced capex
39Italian
Network Network spending, between repurposing and extensions
repurpose and
upgrade
DPCM on strategic
infrastructures
~€2.9bn published.
Virtual Transport
CAPEX
Pipeline confirmed
2022-28
In line with Medea’s
development plan
Repurposing Extensions Maintenance Technical Sardinia
and upgrade and new of existing Innovation and new grids
grids network energy efficiency
Note: of which Sardina Capex €0.2bn, does not include Centralised capex for €0.3bn
40Assets
Digitization
Assets Digitization
City gates upgrade, including remote control
1 systems
Biomethane connections & reverse flow connections
2
~€1.5bn at IPRM
CAPEX District governors GRFD/GMPV replacement and
SMART METERS1 3 upgrade
Working to develop new in house hydrogen 2022-28
ready smart meter. Progressive substitution of ~7,500
~7,300
GPRS based meters due to technology phase ~6,700
out by TELCOs ~5,100
8.3 ~3,300
7.9 8.1 8.1 8.2 8.2 8.3
0.05
1.5
3.0
4.5
Stock 2022 2023 2024 2028
# of installed GRFD devices
7.9 8.1 8.1 8.1
6.7 Gas distribution network upgrade, including THT and
5.3 4 gas quality monitoring
3.9
5 Central Control Room (Dana)
2022 2023 2024 2025 2026 2027 2028
Smart meters ITG Smart Meter
6 Other 41
Note: (1) meters gross of disposalsDigitization
a unique
efficiency and POTENTIAL
value driver BENEFITS1 ~ €240mn EBITDA impact
~€300mn ~ €50-60mn capex impact
2019A 2020A 2021A 2022 2023 2024 2025 2026 2027 2028
EBITDA
Digital transformation now
impacts every business area
ICT OPERATIONS PROCUREMENT HR REGULATION
Note: (1) Cumulated over 2022-28 compared with a scenario of no digitization
42Tenders
new timeline Visibility on timing is low, peak moved to 2026 and tenders to complete
reflects more beyond plan period
cautious Capex opportunity laying outside plan horizon growing
approach
GROWING
CAPEX
OPPORTUNITY
LAYING OUTSIDE
PLAN HORIZON
~€1.8bn
CAPEX 2022-28
2017 2018 2019 2020 2021 2022 2023 2024 2025 2026 2027 2028 post
2028
2017-23 Plan 2018-24 Plan 2019-25 Plan 2020-26 Plan 2021-27 Plan 2022-28 Plan
43Investments
still growing Investment plan reflects Greek acquisition and repositioning of capex to
maximise returns as well as selective disposals
Without Tenders With Tenders
Gross investments +22% Gross investments +13%
Net investments +16% Net investments +9%
Development of Gross 8.9bn
Greek networks Net 8.6bn
Gross 7.1bn 7.9 bn
and DEPA
Net 6.8bn Infrastructure Tender delayed
5.9 bn acquisition cost
Tenders
Greece
New opportunities
Network1
€
€
Digitization
Disposal 2021-27 2022-28 2021-27 2022-28
Disposals
Note: (1) Including centralised capex, Sardinia, expansion of gas distribution perimeter
44RAB and
Redelivery Growth in RAB and redelivery points driven by organic investments,
Points M&A and tenders
RAB Redelivery points(1)
6.4% CAGR 4.1% CAGR
2022-28 2022-28
TENDERS
GREECE ORGANIC TENDERS
ORGANIC GREECE
and M&A
12.6 and 10.1
and
10.0 11.2 7.6 DISPOSALS 7.6 and M&A 8.6
DISPOSALS
8.2
2021 2028 2028 2028 2021 2028 2028 2028
RAB
2.9% CAGR
2022-28 RAB ~35% Italian Market share ~42%
4.5% CAGR
2022-28
Market share to reach
45% at completion
RAB referred to the year end T - revenues in the year T+1, gas distribution only
of tenders
Average deflator over the plan period assumed at 2.5%, starting from 0.7% Note: (1) millions 45Balanced
Financial
Structure
through plan
period
Organic
Capex
OCF
To ensure value
creation, support
growth opportunities,
guarantee a robust Dividends
shareholder’s
return
M&A1
Current §Other M&A
credit rating §Tenders
preserved Financial
flexibility §Enhance
shareholders
remuneration
46
Note: (1) committedDEBT
STRUCTURE
a key source of
value creation Debt Maturities EIB Bonds Term Loans
900
600
No major refinancing needs until 300
2024
0
Liquidity currently >1.2bn to cover 2022 2023 2024 2025 2026 2027 2028 2029 2030 2031 2032 2033 beyond
2033
short term outflows and to keep
an adequate buffer going forward
31/03/2022 Gross Debt Structure1
Current debt structure allows to
Institutional Lenders
keep an average cost of debt Floating (EIB) 13% Banking LinesCredit
Metrics Credit metrics remain within range throughout the plan
MOODY’S Baa2
FITCH BBB+
Net Debt / RAB FFO / Net Debt
80% 20%
70% 15%
60% 10%
50% 5%
40% 0%
2021 2022 2023 2024 2025 2026 2027 2028 2021 2022 2023 2024 2025 2026 2027 2028
48Guidance
With Tenders
2022 2025 2028
€ mn
Revenues adjusted >1.4bn Revenues ~2.0bn >2.6bn
EBITDA adjusted 1.00-1.03bn EBITDA ~1.45bn >1.8bn
EBIT adjusted 570-590 EBIT/RAB2 ~7.9% ~8.8%
Consolidated
Technical Capex 700-750 11.0bn 12.6bn
RAB
Net Debt
~5.9bn FFO / RAB 10% 11%
with IFRS 161
Leverage1 64.9% LeverageCurrent
Dividend Solid and visible return, while allowing investors to benefit from growth
Policy
to 2023
DPS equal to 0.295
0.277
• 65% payout on Adjusted Net Income 0.256
• DPS 2019 +4% per annum
2019 2020 2021 2022 2023
Dividend per share (€)
50
Illustrative chart, DPS paid in the following yearItalgas a Player
3
of the Energy Transition
12
Setting the Network
of Tomorrow
21 Tier 1 Player in Energy
Efficiency
26 Greece
Q&A Other Opportunities
30
34 ESG
38 Financials
52 Appendix 51Appendix 52 52
ESG
people to                    3 pillars HRO strategy defined in 2021 confirmed and improved.
support the                  Strategy designed to sustain people development and well-being as
growth                       a tool to achieve industrial growth

                       ENGAGEMENT &                        SUSTAINABILITY,                             OPERATIONAL
                    CHANGE MANAGEMENT                   DIVERSITY & INCLUSION                          EFFICIENCIES

               Change passes through people, their   Improve business sustainability,             Operational excellence
              engagement. Integration between core         diversity, inclusion                 leveraging on digitization
              and new businesses, safeguarding the        and gender equality
                     unique Italgas’ culture
                                                          Launch and set up of a
                                                       number of new initiatives to     Generational
                                                                                            Change
                                                        support well-being, safety,
                                                         working instruments and
                                                          patterns, inclusion and
                               1                            diversity, learning                                              Insourcing
                         6         2                          opportunities.
                                                                                                                             Of Strategic
                                                                                                                             Activities

                         5         3                                                               Digital Transformation
                               4

                                                                                             Reallocation
                                                                                                                                    53
Energy
Policy
REPower EU
and national EUROPE ITALY GREECE
policies
Accelerated green gases development Development of biomethane to
GREEN GASES vs Fitx55 (biomethane & hydrogen) reach 2.5 Bcm by 2026
NATIONAL ENERGY Lignite power plants phase out
Nuclear and coal potential phase-out Increase of national gas production
delay to 2028, +50% increase in
PRODUCTION delay to 5 Bcm (+50%)
lignite mining
Increase supply from non-Russian New agreements with exporting
INFRASTRUCTURES New pipeline (IGB) + TAP expansion
routes, new interconnections and countries (Algeria, Azerbaijan, Egypt,
DEVELOPMENT maximisation of LNG import capacity Qatar, USA) + new FSRU/LNG
+ new FSRU units
Set up of minimum storage requirement Strategic storage– exploring option
STORAGE targets by end of summer of strategic storage in Italy
Allow actions to mitigate commodity
Actions to mitigate commodity prices
GAS and ENERGY PRICES prices impact on end users – discussion
impact on end users
on European gas price
Incentives for buildings renovations
Push for energy efficiency to 13% vs
ENERGY EFFICIENCY 2020 (from 9%)
(superbonus, ecobonus) and
temperatures control
Renewables acceleration to 45%
FER ACCELERATION (from 40%) of final energy
consumption led by solar 54Italy
regulation
CURRENT REGULATORY PERIOD
2019 2020 2021 2022 2023 2024 2025 2026 2027 2028
WACC REGULATORY PERIOD
WACC WACC WACC
trigger trigger reset
Key features of Italian regulation
• RAB-based framework set and regulated by ARERA
New regulatory • Tariffs ensure return on assets
period for allowed • No volume risks, temporary tariffs mismatch impact working
return started in capital
January 2022 • Different regulatory period for WACC and other tariff components
• Majority of capex recognized at cost
• 5.6% real allowed return for 2022, trigger mechanism for 2023-24
and rest in 2025 with pre-established rules
• Inflation protection
55Italy
regulated Key features
reveneus Unitary tariffs are set for the regulatory period for each distribution area:
scheme Achieved revenues reflect return on asset base.
Working capital temporarily impacted by volumes fluctuations.
REQUIRED
REVENUES =
RAB X
+ DEPRECIATION + OPEX
Reg. WACC
RAB includes capex spent in the Calculated on assets entering into Unitary opex set by ARERA at the
previous year RAB beginning of the regulatory period
RAB inflated Reflects inflation Efficiency factor of 2.8%
Rel pre-tax allowed return applied Useful lives set by ARERA Opex inflated annually
(5.6% in 2022)
56Greece
regulation
CURRENT REGULATORY PERIOD
2017 2018 2019 2020 2021 2022 2023
Tariff
revision
Tariff Tariff Tariff Tariff
Reference Calculation Reference Calculation
Year Year Year Year
Key features of Greek regulation
• RAB-based framework regulated by the Regulatory
Transparent Long Authority for Energy
Downside
regulatory concession • Tariffs reflect business plans presented by the
protection
framework duration company, including investments agreed with RAE
• Regulatory periods last 4 years
• 7.03% nominal return in 2021-22E, with an implied
tax rate of 24%
with numerous allowing to through • 1.5% additional return for investments meeting
similarities to the implement Italgas’ compensation certain criteria
Italian system long-term mechanism for
• Mechanism in place to compensate of any under
strategic vision under-recoveries
/ over recovery of required revenues
57Greece
regulated Key features
revenues Unitary tariffs are set for the regulatory period for each distribution area:
scheme • Based on the approved business plans and allowed returns, and inflated annually:
the DSO is entitled to collect (required) revenues based on all investments and
operational costs
• Taking into consideration estimated growth in redelivery points and volumes
distributed
Achieved revenues are based on actual bills collection but there is a recoverable
difference mechanism in place
REQUIRED
REVENUES =
RAB X - ADDITIONAL ± RECOVERABLE
+ DEPRECIATION + OPEX
Reg. WACC REVENUES DIFFERENCE
RAB includes capex Calculated on fixed Estimated through the Planned revenues Based on the
planned in the year assets regulatory period related to services to difference between
1 Actual revenues are the
RAB is not inflated Opportunity of other companies or required revenues and
revenues collected by the
company based on the outperformance: non-regulated services actual revenues1 in the
application of the Regulated return set at previous regulatory
7.03% in nominal no adjustments
distribution tariffs to the
ex-post in case of period
redelivery points served terms for 2021-22E 58
outperformanceGroup
Structure
59Main
Numbers
1Q 2022 LOREM IPSUM
DOLOR SIT AMET
Lorem ipspum
Lorem ipsum dolor sit amet
OPERATING
OF WHICH
HIGHLIGHTS
AFFILIATES
(TOTAL)
Network length 74,473 km 1,897 km
Municipalities 1,899 61
Redelivery Points 7.749 mn 0.159 mn
Market Share(1) 35% 0.7%
Subsidiaries
Controlled companies
(*) Calculated by redelivery points
60Strategic Plan
2022-2028
www.italgas.it
Investor.relations@italgas.it
Anna Maria Scaglia
Armando Iobbi
61You can also read