Crawford County Housing Plan
←
→
Page content transcription
If your browser does not render page correctly, please read the page content below
Crawford County Housing Plan
This page intentionally left blank.
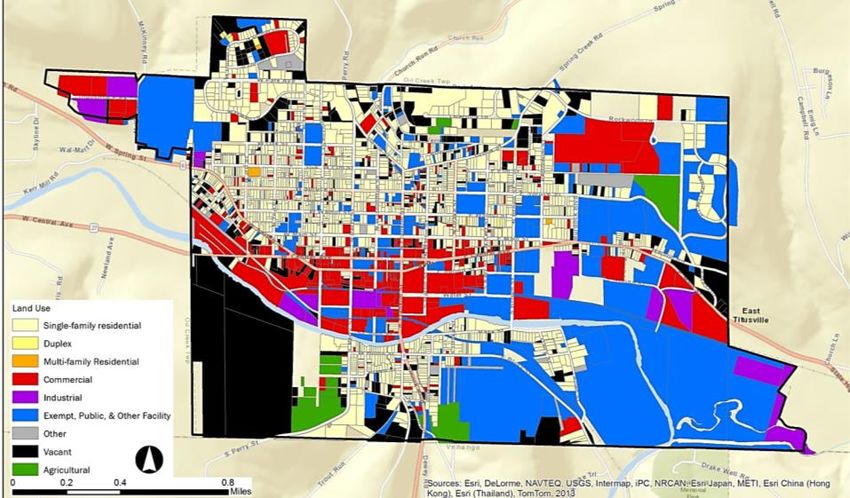
Table of Contents

Executive Summary ....................................................... 1                                         Cost and Affordability ..................................................47
  Introduction .............................................................................................1
                                                                                                                      Income................................................................................................... 47
  Study Areas ..............................................................................................1
                                                                                                                      Income by Tenure ................................................................................. 48
  Key Findings .............................................................................................3
                                                                                                                      Cost Burden ........................................................................................... 49
  Housing Plan Recommendations .............................................................6
                                                                                                                      Home Sales ............................................................................................ 51
                                                                                                                      Home Values ......................................................................................... 52
Demographics ................................................................ 7
                                                                                                                      Rent Costs ............................................................................................. 54
  Population ................................................................................................7
  Mobility Patterns .....................................................................................9          Financial Strengths and Challenges ..............................56
  Households ............................................................................................12
                                                                                                                      Loan Applications .................................................................................. 56
  Housing Demand Drivers .......................................................................16
                                                                                                                      Foreclosures .......................................................................................... 59

Housing ....................................................................... 19                                  Improvement-to-Land-Value Analysis ..........................62
  Inventory ................................................................................................19
                                                                                                                      Meadville............................................................................................... 62
  Housing Tenure ......................................................................................26
                                                                                                                      Titusville ................................................................................................ 63
  Household Size and Unit Size .................................................................27
  Housing Demand ....................................................................................33             Recommendations .......................................................65

Economy ...................................................................... 34                                   Appendix......................................................................67
  Jobs ........................................................................................................34     Methodology ......................................................................................... 68
  Earnings ..................................................................................................38       Glossary of Terms.................................................................................. 74
  Commuting.............................................................................................40            Data Sources ......................................................................................... 75
  Job Clusters ............................................................................................44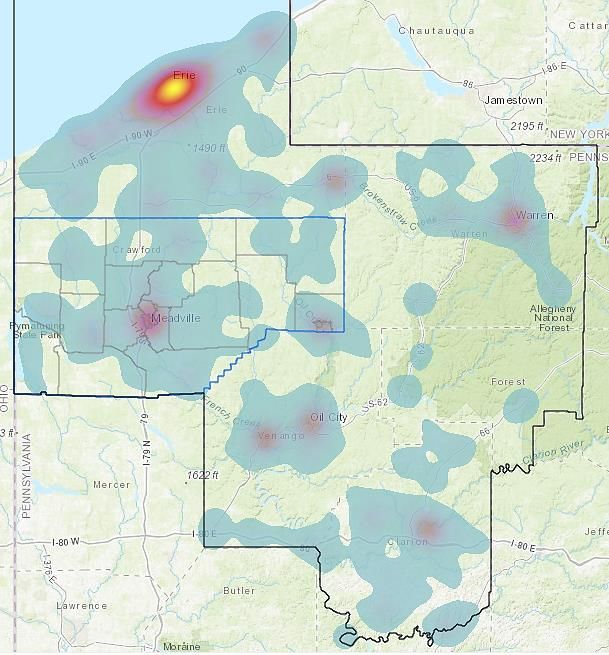
Executive Summary
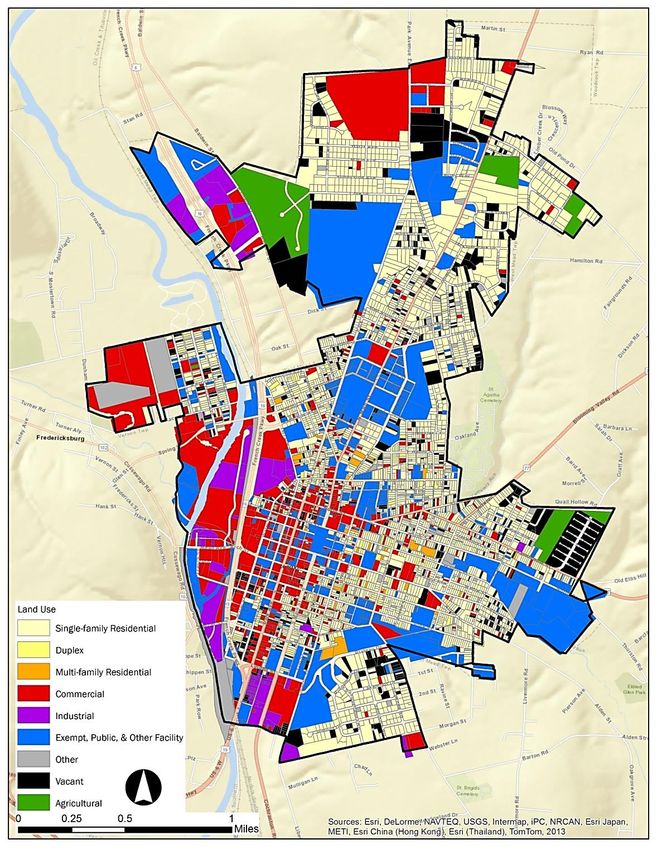
Introduction Study Areas
The Crawford County Housing Plan stems from the adopted 2014 Crawford Located in northwest Pennsylvania, Crawford County is approximately 35
County Comprehensive Plan, Cultivating Crawford Growing a Community. miles south of Erie City and 90 miles north of Pittsburgh City. Crawford
Since the Plan’s adoption, Crawford County has seen resurgence in specific County is located within the Northwest Workforce Development Area or
housing markets that were not identified in the Comprehensive Plan and WDA, which also includes Clarion, Erie, Forest, Venango, and Warren
an increase in request to address blight or abandoned properties by local Counties. While Interstate 79 is the only interstate (north-south) within the
municipalities. This study will examine Crawford County’s current housing county, there are several other major U.S. and state arterial roadways
market and trends, analyzing factors that both positively and negatively which pass through the county, including US Highways 6, 19, and 322, and
influence housing markets, as well as identify housing supply and demand. Pennsylvania Highways 8, 18, and 27. The map on the following page
illustrates housing regions and submarkets (grouped by census tracts)
The objective of this housing plan is to accomplish the following:
based on employment, housing, and population centers, and commuting
• Identify housing market trends that will affect Crawford County patterns.
over the next 15 to 20 years, as well as strategies to favorably
leverage these trends
Study Areas
• Present information on existing and available funding sources or
tools that the county can use to address current and future
housing needs
• Examine the need for county-wide assistance or intervention on
behalf of local municipalities, with respect to housing blight,
Uniform Construction Code and property maintenance issues, and
abandonment or blight concerns Crawford
• Collect information regarding housing agencies and organizations County
across Crawford County to determine gaps and overlaps in services y
provided to specific populations, so as funding and technical
resources can be more effectively and economically delivered
Source: Esri; 4ward Planning Inc., 2018
Crawford County Housing Plan 1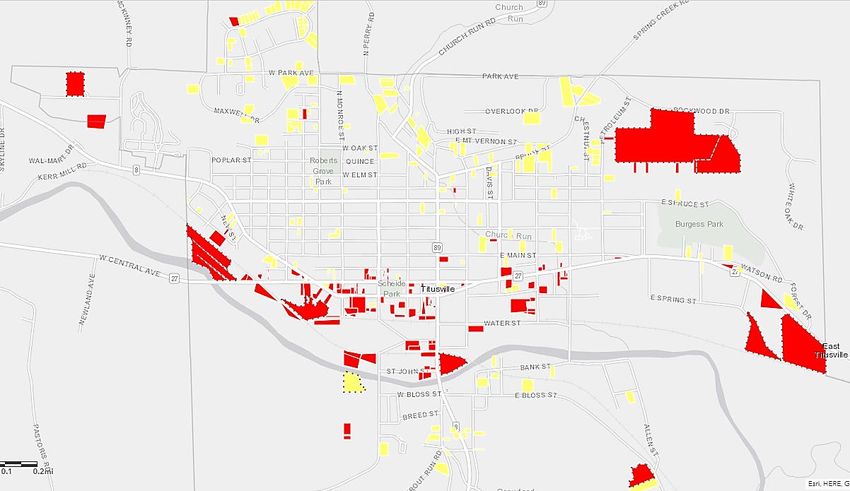
Crawford County Housing Regions and Submarkets

                  Springboro-
                 Conneautville                                    Cambridge Springs                          Spartansburg-
                                                                                                              Bloomfield

                                                          Saegertown
            Linesville
                                                                                                 Townville

                                                              Mead-                                                   Titusville
                                                               ville
                                                                                      Mead
                            Conneaut Lake
                                                Fredericksburg-
                                                   Kerrtown

           Shenango
                                                                       Cochranton
                            East Fallowfield-
                              Greenwood

Source: Esri; 4ward Planning Inc., 2018

                   Springboro-                                Cambridge Springs
                  Conneautville                                                                              Spartansburg-
                                                                                                              Bloomfield
Crawford County Housing Plan                                                                                                       2
Housing
Key Findings                                                                    Shortage of small housing units relative to household size
                                                                                Currently, the share of one-person households in the county (27 percent)
Demographics                                                                    is much larger than the share of studio or one-bedroom units, combined
                                                                                (nine percent). Likewise, the share of one- and two-person households
Population in the county is projected to decline further                        combined (65 percent) is much larger than the share of studio, one-, and
While population change within Crawford County, the Northwest WDA,              two-bedroom units, combined (35 percent). In other words, the mismatch
and the nation has been relatively flat since 2000, the number of total         between housing unit size and household size is most likely to occur among
residents within the county has declined by nearly 1,370 since 2010 and is      small households. With the average household size in the county expected
projected to further decrease by 1,450 persons over the next five years.        to remain constant through 2022 (2.4 persons), a shortage of small housing
The county’s negative total net migration is driven primarily by the            units relative to household size will likely continue.
relatively large net loss of domestic residents over the past seven years.
                                                                                High vacancy rates due to seasonal and other vacant units
According to data provided by the U.S. Census Bureau, from 2011 to 2015,
the largest outflow of residents from Crawford County (408 persons)             The county’s relatively high average housing vacancy rate (22.2 percent) is
moved to neighboring Erie County, likely for purposes of securing               due to a number of factors. For example, there is a large number of “other
employment. Declining population often is accompanied by a rise in              vacant” units dedicated to seasonal, recreational, or occasional use (2,020
residential vacancy rates, flat-to-declining housing values, and increases in   vacant seasonal homes within the Shenango submarket alone). There are
blight – all characteristics currently observed throughout Crawford County.     also units that have been abandoned due to physical obsolescence,
                                                                                particularly in rural areas of Crawford County, as well as units that are
Growth in senior population represents opportunities and challenges             vacant due to lack of qualifying renters or buyers (like the Timbercrest
Despite relatively flat overall population growth, the number of persons        Apartments in the Fredericksburg-Kerrtown submarket, which in more
ages 65 to 84 (representing the older empty-nester and mostly retired age       economically robust times, would have a much lower vacancy rate).
cohorts) is projected to increase significantly within the county and WDA –
creating increased demand for senior-type housing. Compared to the              Economy
state, a higher share of county residents ages 65 to 84 are living alone in
non-family households and have a disability that could affect their housing     Declining manufacturing sector, growing health care sector
situations. Furthermore, the county’s older housing stock (81 percent of
Crawford County’s housing stock was built before 1990, prior to the             The manufacturing sector, the county’s top industry by total employment
Americans with Disabilities Act), combined with an aging population, will       (26 percent of total jobs) has experienced the greatest employment
                                                                                decline over the past two decades and is projected to lose 25 more jobs by
make accessible housing an important issue for the future. Some of these
                                                                                2022. In contrast, the county’s second top industry, the health care and
households may have limited financial resources to draw upon to meet
                                                                                social assistance sector (20 percent of total employment), has experienced
housing maintenance and repair costs which, if left unaddressed, lead to
                                                                                the greatest employment gain in the county over the past two decades and
neighborhood blight. A growing senior population will also increase
                                                                                is expected to continue growing the fastest through 2022. The health care
demand on local and county services (e.g., transportation-, emergency-,
                                                                                and social assistance sector will provide relatively mid-wage job
and welfare-related services), placing fiscal strains on local and county
                                                                                opportunities for county residents ($39,870 per year).
government

Crawford County Housing Plan                                                                                                                    3
Employment clusters represent potential housing submarkets                     High shares of cost-burdened renter households
Based on employment data by census tract provided by the U.S. Census           On average, Crawford County households allocate 30 percent of household
Bureau, 4ward Planning identified 14 employment clusters representing          expenditures on housing. Nevertheless, in 2015, 41 percent of renter
potential labor and housing submarkets. The Meadville, Fredericksburg-         households in the county were paying more than 30 percent of their
Kerrtown, and Titusville submarkets are the three largest submarkets in        incomes on rent (considered cost-burdened by HUD) and 21 percent were
the county by total employment share, representing 66 percent of the           paying more than 50 percent of their incomes on rent (severely rent-
county’s total employment. These employment clusters are the prime             burdened). The share of renter households that are cost-burdened is
drivers of housing submarkets in their respective areas. The health of the     particularly high in the Meadville and Titusville submarkets (53 and 49
surrounding housing markets is, principally, linked to the health of these     percent, respectively). While inflation-adjusted rents in in the Meadville
employment submarkets.                                                         submarket rose by 0.8 percent per year from 2010 to 2016, the median
                                                                               household income declined by -0.8 percent per year from 2010 to 2017. In
Highest business vacancies in Titusville and Meadville                         contrast, from 2010 to 2016, inflation-adjusted rents declined by -0.4
According to HUD’s Aggregated U.S. Postal Service (USPS) Administrative        percent per year in the Titusville submarket, while median household
data, over the past five years, the Titusville and Meadville submarkets have   income grew by 0.2 percent per year from 2010 to 2017.
had the highest business vacancies in the county. As of the fourth quarter
of 2017, business vacancies in the Titusville and Meadville submarkets         Median home values growing faster than median household incomes
were 14.8 and 8.7 percent, respectively. Business vacancy rates,               Although the median home value for owner-occupied homes in Crawford
particularly in Titusville, are relatively high.                               County ($119,900) is relatively low compared to the median home value
                                                                               within the state ($182,730), in recent years, median home values have
                                                                               been increasing at a rate faster than median household incomes. For
Cost and Affordability
                                                                               example, while the median household income in Crawford County
Deferred housing maintenance may be a growing challenge                        remained relatively flat from 2010 to 2017, after adjusting for inflation
                                                                               (increasing by just 0.7 percent per year), the median adjusted home value
The median household income in Crawford County ($44,790) is lower than
                                                                               in the county increased by 2.0 percent per year.
that observed in the WDA ($47,260) and state ($56,180). Because older
homes require more upkeep, deferred housing maintenance and repairs
may be a growing challenge among lower-income or senior households             Financial Strengths and Challenges
that may lack the financial means or physical ability to repair older homes.
This may be especially the case in housing submarkets like Titusville that     Foreclosures as a share of total housing units has been increasing
have a relatively high share of older housing stock and low median             Interviews with residential real estate professionals suggest that rising
household incomes ($37,245), or Saegertown that have a relatively high         vacancies in Crawford County are largely due to foreclosures and
share of older housing stock and large population growth expected among        abandoned (though not foreclosed) properties, spurred by personal and
persons ages 55 and older (175 new persons over 55 years by 2022,              financial distress. Although foreclosures as a share of total housing units in
representing a seven percent increase).                                        the county has remained lower than that observed in the state and nation,
                                                                               from 2013 to 2017, foreclosures as a share of total housing units has
                                                                               increased slightly in the county, while it has been declining nationally.

Crawford County Housing Plan                                                                                                                      4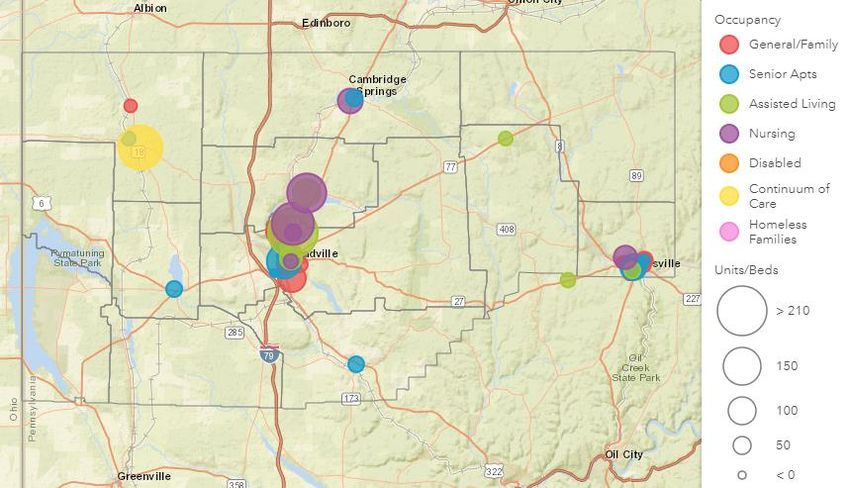
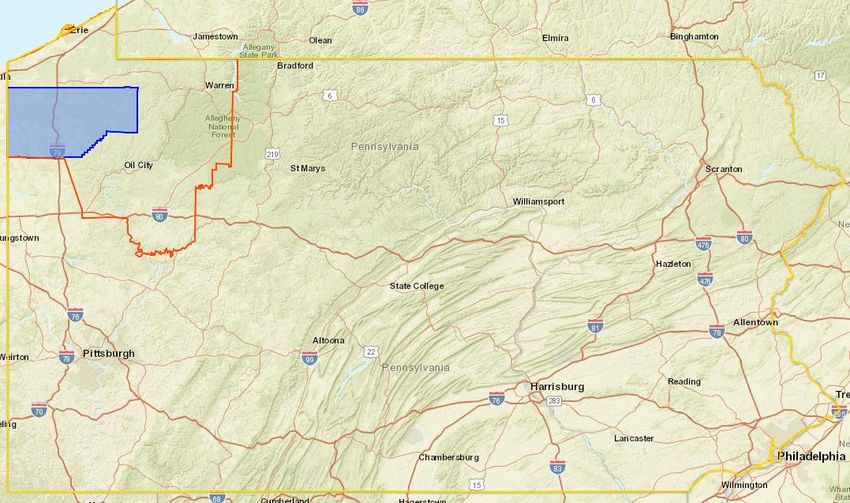
Share of successful loan applications has been increasing                        Improvement-to-Land Value Analysis
Based on HMDA data provided via the Consumer Financial Protection
Bureau (CFPB), although the number of total loan applications in Crawford        412 parcels with low ILVs (255 acres) in Meadville
County has been decreasing over the past decade, overall, the share of           In the City of Meadville, 204 single-family residential parcels (101.25
loan applications resulting in successful loan originations has been             acres), three multi-family residential parcels (1.1 acres), and 205
increasing. Successful loan originations as a share of total loan applications   commercial parcels (152.7 acres) exhibit low improvement-to-land value
within the county increased from 40 to 58 percent from 2007 to 2016              (ILV) ratios. While there are numerous low-ILV parcels in the study area,
(compared to an increase from 39 to 51 percent within the nation, over the       many of them are small, potentially making redevelopment of these
same period). Conversely, the share of total applications denied by              parcels less attractive. Since developers are likely to target large or
financial institutions within the county declined from 36 to 23 percent from     contiguous parcels of underutilized land for residential development, the
2007 to 2016 (compared to a decrease from 22 to 16 percent within the            17 identified low-ILV parcels over two acres in size in Meadville may be the
nation, over the same period).                                                   most attractive for redevelopment.

Home sales may be being diverted due to unusual loan requirements                278 parcels with low ILVs (148 acres) in Titusville
From 2007 to 2016, the number-one reason cited for loan denials (2,424           In the City of Titusville, 162 single-family residential parcels (53.7 acres)
applications) was an applicant’s poor credit history. Collateral                 and 116 commercial parcels (93.9 acres) exhibit low ILV ratios. Many low-
(representing the asset that secures the mortgage, which in most cases is        ILV residential parcels are small and concentrated in the north of the study
the home being financed) and debt-to-income ratios (ratio of monthly             area. Since developers are likely to target large or contiguous parcels of
debts to annual income) were the second and third top loan denial reasons        underutilized land for residential development, the 11 identified low-ILV
cited (1,708 and 1,485 incidents, respectively). Interviews with residential     parcels over two acres in size in Titusville may be the most attractive for
real estate professionals suggest that many home sales in the county are         redevelopment.
diverted due to unusually stringent loan application requirements. Where
some of their clients are denied housing loans, they are still considered
qualified for comparable rental payments. Encouraging partnerships with
local banks to find lending solutions for potential homeowners would be
beneficial to the health of the county’s housing market.

Crawford County Housing Plan                                                                                                                       5
Housing Plan Recommendations

Recommendations
   •   Relax zoning to allow for assessor-unit apartments and mixed-
       use, multi-family residential development in urban areas.
   •   Adopt uniform county-wide code enforcement policies. Local
       municipalities enter into a local service agreement with county,
       agreeing to share data into a county-wide database.
   •   The county planning department should host a quarterly
       meeting with planning, zoning, and code enforcement officials
       to discuss related blight, zoning and code enforcement issues.
   •   Utilize federal and state resources (such as CDGB funds, DCED)
       to create a proactive blight avoidance program, which should
       include low-interest loan and grants for exterior home
       improvements and commercial façade improvements.
   •   Prioritize resources within concentrations of blight in urban
       areas (e.g. Meadville, Titusville) where economic activities are
       concentrated.
   •   Address real property tax inequity that exists between the
       urban and non-urban areas.
   •   Utilize an algorithm model to making strategic time and
       resource investment decisions.

Crawford County Housing Plan                                              6
Annualized Population Growth Rates
Demographics
                                                                                                         2000-2010             2010-2017               2017-2022
Population
According to 2017 estimates provided by Esri, with approximately 87,400                                                                             0.34% 0.31%
residents in Crawford County, the county is the second highest populated                                                                                            0.25%
county in the Northwest WDA (second to Erie County with 279,800
residents). While population change within Crawford County, the
Northwest WDA, and the nation has been relatively flat since 2000
(changing between -0.75 and 0.75 percent per year), the number of total                                            -0.11% -0.12%
                                                                                    -0.18% -0.22%
residents within the county has declined by nearly 1,370 since 2010 and is                                                           -0.26%
                                                                                                    -0.33%
projected to further decrease by approximately 1,450 persons over the
next five years. Declining population often is accompanied by a rise in
residential vacancy rates, flat-to-declining housing values, and increases in
blight – all characteristics currently observed throughout Crawford County.              Crawford County                Northwest WDA                  Pennsylvania

Historic and Projected Population Change, Crawford County
                                                                                Source: Esri; 4ward Planning Inc., 2018
91,000
90,000
89,000                                                                                                     Population by Geography
88,000                                                                                                                                               Change
87,000                                                                           Study                                                               2010-     2017-
                                                                                 Area       2000           2010         2017           2022          2017      2022
86,000
85,000                                                                           County         90,366        88,765        87,397        85,951      -1,368        -1,446
84,000
                                                                                 WDA           519,348       513,834       509,608       503,053      -4,226        -6,555
83,000
         2000
         2001
         2002
         2003
         2004
         2005
         2006
         2007
         2008
         2009
         2010
         2011
         2012
         2013
         2014
         2015
         2016
         2017
         2018
         2019
         2020
         2021
         2022

                                                                                  PA        12,281,054     12,702,379   12,976,662     13,138,130    274,283       161,468

Source: Esri; 4ward Planning Inc., 2018                                         Source: Esri; 4ward Planning Inc., 2018

Crawford County Housing Plan                                                                                                                                   7
Annualized Population Change by Census Tract, 2010-2017 Source: Esri Crawford County Housing Plan 8
Mobility Patterns
Population Change
                                                                                          Understanding the degree and direction of migration is important in
For planners and economic development professionals, it is important to
                                                                                          developing land regulations and tax policies. Based on longitudinal surveys
know not only if the area’s population is changing and at what rate, but
                                                                                          of random samples of people who move from their counties of residence,
also the underlying reasons for such change. Population change within a
                                                                                          the primary reason for doing so is often related to employment – that is,
county (whether a decrease or increase) is due to the following
                                                                                          people typically relocate from one county to another (usually within the
demographic trend factors including births, deaths, in-migration and out-
                                                                                          same state) for purposes of securing employment. Other top reasons for
migration. According to data provided by the U.S. Census for Crawford
                                                                                          inter-county moves include caring for family members or attending school.
County, from April 2010 to July 2017, the number of deaths (7,119) was
greater than the number of births (6,845), resulting in net negative natural              According to data provided by the American Community Survey (ACS),
population decline of 274 persons. The county’s negative total net                        from 2015 to 2016, 88 percent of Crawford County residents reported
migration is driven primarily by the relatively large net loss of domestic                living in their homes for the whole year, while eight percent changed
residents over the past seven years. More detail on county migration flows                addresses within the county, two percent moved from elsewhere within
is provided in the economy section of this report.                                        the state, two percent moved from another state, and less than one
                                                                                          percent moved from abroad.
       Cumulative Population Change: Crawford County,
                  April 1, 2010 To July 1, 2017                                                                 Mobility Status, 2015-2016

                             6,845                                                           Same house                            Moved from different
                                                                                             62,765 88%                          county within same state
                                                                                                                                        1,656 2%
                                                                    153
                                                                                                                                           Moved from different
  (2,602)     (274)                                   (2,298)                   (2,451)                                                     state 1,549 2%

                                                                                                                                         Moved from abroad
                                           (7,119)                                                                                           87 0%
                                                                                                                          Moved within same
               Total         Births        Deaths      Total   International Domestic                                     county 5,417 8%
              Natural                                Migration
             Increase
 Total (1)              Natural Increase                        Net Migration             Source 2016 ACS B07010

(1) Total population change includes a residual. This residual represents
the change in population that cannot be attributed to any specific
demographic component.
Source: U.S. Census, Estimates of the Components of Resident

Crawford County Housing Plan                                                                                                                                9
Overall, residents relocating to Crawford County (total movers) were more According to data provided by the U.S. Census Bureau, from 2011 to 2015,
likely to have no income (25 percent), compared to residents who the largest influx of residents to Crawford County (179 persons) moved
remained in the same house during the past 12 months (12 percent). from Allegheny County, while the largest outflow of residents from
Residents relocating from within Crawford County were those most likely Crawford County (408 persons) moved to neighboring Erie County.
to earn more than $50,000 per year (21 percent), compared to residents
who remained in the same house during the past 12 months (16 percent). Migration Flows: Crawford County, PA (2011-2015)
County State Persons
Migration Status by Household Income: Top Net Positive
Crawford County, 2015-2016 1 Allegheny County Pennsylvania 179
2 Venango County Pennsylvania 82
No Income Less than $10k $10k-$14.9k 3 DuPage County Illinois 75
4 Westmoreland County Pennsylvania 71
$15k-$24.9k $25k-$49.9k More than $50k Top Net Negative
1 Erie County Pennsylvania (408)
2 Clearfield County Pennsylvania (103)
From abroad 59% 41%
3 Jefferson County Pennsylvania (97)
4 El Paso County Texas (80)
Movers by Location
Different state 15% 16% 21% 26% 20%
Different county in PA 39% 17% 8% 19% 14%
Same county 23% 13% 12% 11% 20% 21%
Movers
Total
25% 14% 12% 13% 20% 16%
Same
house
12% 17% 10% 18% 28% 16%
Source 2016 ACS B07010 Source: U.S. Census Bureau, 201 -2015 5-year ACS
Crawford County Housing Plan 10Migration Flows: Crawford County, 2011-2015 Acccording to data provided by Ohio State University, in 2010, the
Spartansburg-Bloomfield and East Fallowfield-Greenwood submarket had
the largest Amish population as percent of total population.
Amish Population by Submarket, 2010
Amish Total Share of
Submarket Settlement
Pop. Pop. Total Pop.
Spartansburg-
Spartansburg 1,418 6,114 23.2%
Bloomfield
East Fallowfield-
Atlantic 763 3,679 20.7%
Greenwood
Linesville,
Linesville 427 2,978 14.3%
Pierpont/Conneaut
Townville Townville 372 3,098 12.0%
Springboro-
Conneautville 222 4,920 4.5%
Conneautville
Cochranton Union City 173 5,662 3.1%
Source: U.S. Census Bureau, 201 -2015 5-year ACS Saegertown Saegertown 135 6,950 1.9%
3,510 33,401 10.5%
Special Populations Source: Ohio State University, Journal of Amish and Plain Anabaptist
Studies, Volume 1, Issue 1 (April), 2013
There are three population groups in Crawford County that do not
contribute traditional demand to the local housing market: university
students, federal inmates, and Amish and Old Order Mennonite families.
Student dormitories and correctional facilities are both classified as “group
quarters” by the U.S. Census Bureau. Group quarters also include other
institutional and non-institutional settings such as nursing homes, mental
hospitals, military barracks, group homes, missions, and shelters. In 2016,
there were 3,855 residents of group quarters in Crawford County, or about
4.4 percent of the county’s total population. The largest shares of the
county’s group populations live in the Meadville (43.7 percent), Cambridge
Springs (28.4 percent), Seagertown (10.9 percent), and Titusville
submarkets (10.6 percent).
Crawford County Housing Plan 11Persons with Disabilities Households
Approximately 81 percent of Crawford County’s housing stock was built
According to 2017 estimates provided by Esri, there are approximately
before 1990, prior to the Americans with Disabilities Act (ADA). The
33,960 households in Crawford County. Similar to population, household
county’s older housing stock, combined with an aging population, will
change within Crawford County, the Northwest WDA, and the nation has
make accessible housing an important issue for the future. Persons with
been relatively flat since 2000. The number of total households within the
disabilities often require accessible housing features such as ramps, wide
county has declined by approximately 500 since 2010, and is projected to
doorways, large bathrooms, and grab bars.
decline by another 570 over the next five years.
Over 13,680 residents in Crawford County have a disability that could
affect their housing situations, representing 16.0 percent of the population Households by Geography
(compared to just 13.7 percent within the state). The largest share of
Change
residents with disabilities are between ages 35 and 64 (42 percent), Study Area 2000 2010 2017 2022
representing the prime working-age population. The second largest share 2010-2017 2017-2022
of county residents with disabilities (21 percent) are persons ages 75 and Crawford
34,678 35,028 34,528 33,955 -500 -573
older, representing residents most likely to have ambulatory disabilities. County
Because this type of disability is correlated with increasing age, and the Northwest
199,680 204,468 203,596 201,267 -872 -2,329
number of senior citizens is expected to rise significantly, the number of WDA
accessible housing units required in the county is expected to increase. PA 4,777,003 5,018,904 5,113,907 5,171,350 95,003 57,443
Disability by Type, 2016 Source: Esri; 4ward Planning Inc., 2018
Disability Type With a Disability % with a Disability
With a hearing difficulty 4,429 5.2% Annualized Percent Household Change
With a vision difficulty 2,100 2.5%
2000-2010 2010-2017 2017-2022
With a cognitive difficulty 4,884 5.7% 0.75%
With an ambulatory difficulty 6,573 7.7% 0.50%
With a self-care difficulty 2,193 2.6% 0.25%
With an independent living difficulty 4,076 4.8%
0.00%
Crawford County 13,684 16.0%
Pennsylvania 1,719,069 13.7%
-0.25%
-0.50% -0.33%
Source: 2012-2016 ACS 5-Year Estimates, S1810
-0.75%
Crawford County Northwest WDA Pennsylvania
Source: Esri; 4ward Planning Inc., 2018
Crawford County Housing Plan 12Household Size Household Type
While average household size in Crawford County (2.4 persons per According to the 2011-2015 ACS, approximately 27 percent of Crawford
household) is comparable to that within the WDA and the state (2.4 and County households are characteristic of single-person households (a
2.5 per housheold, respectively), it is relatively smaller than that within the person living alone or unrelated persons sharing the housing unit) and 38
nation (2.6 per housheold). Furthermore, while the average household size percent are characteristic of family households (includes at least two
in Crawford County is expected to remain relatilvey flat through 2022, it is persons related by birth, marriage, or adoption).
expected to decrease within the WDA and increase within the nation. One
takeaway from the relatively small household size within the county is that Households by Type and Size
new housing units (whether rental or for-sale) will likely need to be smaller,
as well. Family HHs Non-Family HHs
40%
4.6%
Average Household Size Trends 30%
2010 2017 2022 20%
2.7 33.4%
27.1%
2.6 10%
14.9% 11.0%
2.5 4.8%
2.4 1 2 3 4 5 6 7+
Persons in HH
2.3
Source: ACS, 2011-2015
2.2
Crawford County Northwest WDA Pennsylvania USA In recent years, the share of family households in Crawford County has
Source: Esri; 4ward Planning Inc., 2018 been declining, while the share of non-family households has been
increasing. In 2000, for example, family households represented 69
percent of county households, compared to 66 percent in 2017. By
comparison, non-family households represented 31 percent of county
households in 2000, compared to 34 percent in 2017. Although overall
household growth in the county is expected to remain relatively flat over
the next five years, the share of non-family households as percentage of
all households in the county is anticipated to increase to 35 percent by
2022. The stronger increase in non-family households, a national trend, is
due to a variety of demographic, cultural, and economic factors including
the general aging of the American population and a high rate of divorce.
Furthermore, the trend among young adults to delay or decline marriage,
and rising household costs and/or relatively flat income growth are
requiring more nonrelatives (e.g., unmarried partners or roommates) to
live together.
Crawford County Housing Plan 13Households by Type, Crawford County Source: ACS, 2011-2015
80% Family
69%
70% 66% Households Dual-Income Households with Children
65%
60% According to the ACS survey, in 2016, 55.4 percent of married couples with
50% Non-Family children under 18 years old in Crawford County were dual-income
40% 34% Households households (both mother and father are employed). While the share of
31% 35%
30% dual-income married households with children in the state and the nation
has increased since 2009, the share of dual-income married households
20%
2000 2010 2017 2022 with children in the WDA and the county has declined. The decline in dual-
income family households in the region may be linked to the decline in
Source: Esri; 4ward Planning Inc., 2018
employment opportunities that provide living-wages for families.
Single-Person Households Share Dual-Income Couples with Children Under 18
Although the share of single-person households in the county (27.1 United States Pennsylvania
percent) is lower than the share within the WDA and the state (29.0 and Northwest WDA Crawford County
28.6 percent, respectively), the share of non-family households headed by 70%
a person 65 years or older is slightly higher in the county (12.2 percent),
than in the WDA and state (11.9 and 11.6 percent, respectively). While 65%
higher shares of seniors living alone isn't necessarily cause for concern, 63.7%
62.9%
some of these households may have limited financial resources to draw
upon to meet housing maintenance and repair costs which, if left 60% 58.3% 58.0%
unaddressed, lead to neighborhood blight. Further, a growing senior
57.4%
population will, likely, increase demand on local and county services (e.g., 55%
transportation-, emergency-, and welfare-related services), placing fiscal 55.1% 55.4%
strains on local and county government.
50%
2009 2010 2011 2012 2013 2014 2015 2016
Single-Person Households
Source: ACS 5-Year Estimates
Non-Family HHs with Pop 65+ All Non-Family HHs
27.1% 29.0% 28.6% 26.2%
12.2% 11.9% 11.6% 9.6%
Crawford County Northwest WDA Pennsylvania USA
Crawford County Housing Plan 14Some of the wide fluctuations in dual-income households is specifically Households by Age of Householder
related to corresponding fluctuations in the share of employed fathers in
the county. This share, which dropped significantly after the 2008 to 2009 As illustrated below, while the number of households headed by persons
recession, has been increasing in recent years (currently 28.9 percent), but between ages 35 and 54 (representing early- and late-stage families) is
remains lower than it was before the recession (31.3 percent in 2009). In expected to continue declining over the next five years, the number of
contrast, the share of employed mothers in the county (currently 6.1 households headed by persons ages 65 and over (representing older
percent), which has been consistently much lower than the share of empty-nesters and mostly retired individuals) is expected to continue
employed fathers, has rebounded to slightly above pre-recession levels increasing, overall. According to interviews with local realtors, there is a
(6.0 percent in 2008). These trends may be explained, in part, by the decent number of older homeowners who are choosing to not downsize,
greater likelihood that men will work in the manufacturing sector (which anticipating that their adult children or grandchildren might choose to live
has lost approximately 2,160 jobs in the county over the past two decades), with them.
while women have been better represented in sectors such as health care By 2022, while the number of county households headed by persons
and social assistance (which has gained 1,450 jobs in the county over the between ages 35 and 54 is expected to decrease by approximately 880
past two decades). households (from 11,040 to 10,160 households), the number of
households headed by persons ages 65 and over is expected to increase by
Share Dual-Income Couples with Children, Crawford County approximately 690 households (18,440 to 19,130 households). Further, the
decline in households headed by persons ages 35 to 54 also represents a
Only Mother Employed Only Father Employed decline in the prime working-age population – creating further fiscal
35% challenge for local and municipal government.
31.3%
Only Father
30% Employed
25% 28.9% Total Households by Householder Age, Crawford County
20% 2010 2017 2022
8,000
15% 18.9% 18.9%
7,000
10% Only Mother 6,000
6.0%
Employed 5,000
5% 1.6%
6.1% 4,000
0% 3,000
2005 2006 2007 2008 2009 2010 2011 2012 2013 2014 2015 2016 2,000
Source: ACS, 2011-2015 1,000
-
15-24 25-34 35-44 45-54 55-64 65-74 75+
High Young Early- Late-Stage Young Older Mostly
School Workforce Stage Families Empty Empty Retired
and and Grads Families Nesters Nesters
College-
Age
Source: Esri; 4ward Planning Inc., 2018
Crawford County Housing Plan 15Age of the housing market ecosystem wields great influence over the
rental housing submarket (as the segment grows and rental stock
The population in Crawford County is older than those within the WDA and remains steady, rental rates rise) and is also critically important to
state. The 2017 median age within the county is an estimated 43.3 years, the “move-up” housing market, as owners of starter homes need
compared to 41.7 years in the WDA and 41.3 years in the state. Despite buyers prior to move-up house purchases. So, for example, if the
relatively flat overall population growth expected in the county through size of the bottom tier were to decline over time and/or were its
2022, overall, the number of persons ages 65 to 84 (representing the older members to demonstrate a decreased appetite for home
empty-nester and mostly retired age cohorts) is expected to increase ownership, the implications (negative) would ripple through the
within the county. As a result of this growth, by 2022, the median age in rest of the housing market ecosystem – fewer buyers of starter
the county is expected to increase to 44.5 years, increasing the demand for homes would lead to fewer move-up buyers, resulting in attendant
senior-type housing downward pressure on housing values, generally.
Median Age Trends • The upper tier: This housing market segment is largely comprised
Crawford County Northwest WDA Pennsylvania
of persons who own and occupy starter and move-up housing units
45.0 and, generally, the heads of households are between ages 55 and
64. The owner occupants of move-up housing who are at or
43.0
nearing retirement, and particularly those who have children who
have moved out, will likely be seeking to move into smaller housing
units (whether renter- or owner-occupied units) which require less
41.0
maintenance and, perhaps, a lower overall cost of occupancy.
39.0 Further, the move-up segment provides the principal demand for the
2010 2011 2012 2013 2014 2015 2017 2018 2019 2020 2021 2022 market-rate senior housing market (in particular, for age-restricted
Source: Esri; 4ward Planning Inc., 2018 and independent living developments). Consequently, the functioning
health of the market-rate senior housing market is dependent on the
functioning health of the move-up housing market.
Housing Demand Drivers
4ward Planning’s housing market research experience demonstrates that
a housing market is not unlike an ecosystem, where the healthy function Bottom Tier
of the system is predicated on maintaining a balanced hierarchical •20 to 34 years
structure of essential organisms. In the case of a housing market, the •Current renters with Upper Tier
hierarchical structure is comprised thusly: demand for “starter
•55 to 64 years
homes”
• The bottom tier: This housing market segment is typically •Current “starter” or “move-
up” housing owners
comprised of persons ages 20 to 34 and younger who are,
generally, renters. Some of this segment will eventually become
first-time home buyers, stimulating demand for “starter homes,”
which are typically modest in size and amenities and at the lower
end of the house pricing spectrum. Further, this demand segment
Crawford County Housing Plan 16Annualized Population Change, 2017-2022
Crawford County Northwest WDA Pennsylvania
5.0%
4.0%
3.0%
2.0%
Annualized % Change
1.0%
0.0%
-1.0%
-2.0%
-3.0%
-4.0%
Under 5 5-9 10-14 15-19 20-24 25-29 30-34 35-39 40-44 45-49 50-54 55-59 60-64 65-69 70-74 75-79 80-84 85+
Pre- Grade School-Age High School and Young Workforce Early-Stage Families Late-Stage Families Young Empty Older Empty Mostly Retired
School- Children College-Age and Grads Nesters Nesters
Age
Children
Source: Esri; 4ward Planning Inc., 2018
Crawford County Housing Plan 17Population Change by Age Cohort, 2017-2022
Population Change by Age and Submarket
According to data provided Esri, the share of the population by age varies 20 to 34 Years 55+ Years
by submarket. While the Meadville submarket has the highest share of
persons ages 20 to 34 (25 percent), the Shenango submarket has the Saegertown (36) 175
highest share of persons ages 55 and over (48 percent). While the share of
residents ages 20 to 35 is expected to decline within all submarkets over Shenango (35) 127
the next five years, the share of persons ages 55 and over is expected to Townville (51) 107
increase within all submarkets within the same period. Most notably,
Linesville (36) 84
population decline among those ages 20 to 35 years is expected to be
greatest in the Meadville submarket (178 persons), while the population Cambridge Springs (161) 205
growth among persons ages 55 and over is expected to be greatest in the
Cochranton (91) 124
Cambridge Springs submarket (205 persons).
Titusville (20) 43
Population Share by Age Cohort, 2017 Fredericksburg-Kerrtown (74) 96
20 to 34 Years 55+ Years Spartansburg-Bloomfield (112) 118
Shenango 11% 48% Conneaut Lake (104) 110
Conneaut Lake 13% 44%
East Fallowfield-Greenwood (95) 69
Fredericksburg-Kerrtown 13% 42%
Linesville 14% 40% Springboro-Conneautville (120) 92
Saegertown 15% 36% Mead (146) 116
Cochranton 15% 35%
Meadville (178) 126
Mead 16% 35%
Springboro-Conneautville 16% 35%
Source: Esri; 4ward Planning Inc., 2018
Spartansburg-Bloomfield 17% 27%
East Fallowfield-Greenwood 17% 30%
Crawford County 17% 35%
Townville 18% 35%
Titusville 18% 37%
Cambridge Springs 21% 29%
Meadville 25% 30%
Source: Esri; 4ward Planning Inc., 2018
Crawford County Housing Plan 18Housing According to data provided by the U.S. Census Building Permits Survey,
between 2000 and 2017, approximately 2,508 units were permitted within
Crawford County, with 92 percent of these units characteristic of single-
family homes. Between 2000 and 2017, Crawford County’s total housing
Inventory stock grew from 42,420 to 44,450 units, increasing by 2,270 units.
According to 2011-2015 ACS data provided by Esri, Crawford County is
predominately composed of single-family housing, characteristic of 74.5 Housing Permits, Crawford County
percent of the housing stock. A relatively large share (13.7 percent) of the
county’s housing stock is composed of mobile homes, providing an
350 Single-Family Duplex 3-4-unit 5+ unit
affordable housing option for the county’s low- and moderate-income
residents.
300
Housing Inventory by Building Type
250
Single Family Duplex 3-9 units 10+ units Mobile Homes
9.4% 200
13.7%
150
100
74.5% 75.5% 50
72.3%
0
2000
2001
2002
2003
2004
2005
2006
2007
2008
2009
2010
2011
2012
2013
2014
2015
2016
2017
Crawford County Northwest WDA Pennsylvania
Source: U.S. Census, Building Permits Survey , 2018
Source: Esri; 4ward Planning I nc., 2018
Crawford County Housing Plan 19Approximately half of all units within the county are located within the The Springboro-Conneautville submarket has the highest share of single-
Meadville, Mead, Conneaut Lake, Shenango, and Titusville housing family units (85 percent), while the Townville submarket has the highest
submarkets, combined. Living quarters including ddormitories, share of multi-family units with five units or more (11 percent). The
bunkhouses, barracks, transient hotels or motels, institutional quarters, Spartansburg-Bloomfield submarket has the highest share of mobile
hospitals, and military installations are not included in the housing unit homes (25 percent).
inventory.
Housing Inventory by Building Type
Total Housing by Submarket, 2017
Single Family Duplex 3-4 units
5+ units Mobile Homes
Springboro-… 85% 10%
Titusville 84% 12%
Meadville 83% 15%
Cambridge… 79% 20%
Linesville 78% 19%
Mead 78% 18%
Saegertown 76% 14%
Cochranton 75% 22%
Crawford County 75% 14%
East Fallowfield-… 74% 20%
Spartansburg-… 74% 25%
Fredericksburg-… 73% 12% 12%
Conneaut Lake 72% 21%
Shenango 69% 9% 9% 7% 6%
Townville 58% 12% 16% 11%
Source: Esri; 4ward Planning Inc., 2018
Source: Esri; 4ward Planning Inc., 2018
Crawford County Housing Plan 20Assisted Housing Inventory According to HUD’s 2017 Picture of Subsidized Households (PSH) database,
there are a total of 1,237 subsidized units in Crawford County that are
Assisted housing refers to units that were originally developed or currently administered by HUD or predecessor agencies, which provide housing for
operate with a public source of financing. Generally, these housing units 2,070 people. The subsidized unit household contains 1.8 persons and has
require tenants to be income-eligible, meaning that their annual incomes a household income of approximately $12,637 per year. Ninety-one
must be at or below a certain amount in order to qualify to live there. percent of these households are very low income (VLI) and 61 percent are
Within Crawford County, there are two housing authorities that provide extremely low income (ELI). These units have an annual occupancy of 92
both public housing, and run a tenant based Section 8 program (where low percent and a turnover of 15 percent. The average household waited an
and extremely low income families rent off the private sector with average of ten months on the waiting list, and has received housing
subsidized rents). These programs are income-based and the eligibility benefits for six years and nine months.
guidelines are set by the U.S. Department of Housing and Urban
Development (HUD).
Summary of HUD Programs, Crawford County, 2017
• Housing Authority of the City of Meadville (HACM) owns and Housing Project
manages 347 units within four facilities (Elmwood Village, Morgan Public 202/ 811/
Program Choice Based All
Housing PRAC PRAC
Village, Holland Towers, and William Gill Commons) and 15 Vouchers Section 8
scattered sites within the City of Meadville. HACM also manages Subsidized
498 297 339 61 42 1,237
units available
the 11-unit Snodgrass Apartments. HACM has the capacity to
% Occupied 93% 88% 94% 97% 97% 92%
manage 153 units of Section 8 vouchers.
HH income per
$13,411 $11,035 $12,639 $14,403 $10,998 $12,637
• Titusville Housing Authority (THS) owns and manages 216 units year
within two facilities (Central Towers and the Billie Brown Building) Number of
867 437 658 60 48 2,070
total people
and 61 Family Units scattered at three sites in the City of Titusville Number of
(on East Spruce, West Oak, and Jones streets). THS has the capacity 1.9 1.7 2.0 1.0 1.1 1.8
people per unit
to manage 103 units of Section 8 vouchers. % Moved in
15% 12% 20% 5% 11% 15%
past year
In addition to the units provide by Crawford County’s two housing % of local
authorities, there are other housing units within the county that median (HH 30% 25% 28% 37% 27% 29%
operate with a public source of financing in order to provide affordable income)
% Very low
rental apartment options for senior adults, families, and people with 87% 98% 90% 91% 100% 91%
income
disabilities. For example, the Section 202 Supportive Housing for the % Extremely
Elderly program provides funding to nonprofit organizations that 60% 72% 57% 33% 67% 61%
low income
develop and operate housing for seniors with very low incomes. The Average
Section 811 program allows persons with disabilities to live as months on 6 20 -1 -1 -1 10
waiting list
independently as possible by subsidizing rental housing opportunities Average years
which provide access to appropriate supportive services. 7.1 7.8 5.8 6.3 8.5 6.9
since moved in
Source: HUD, Picture of Subsidized Households, accessed May 2018
Crawford County Housing Plan 21Senior Housing
There are approximately 1,880 units/beds dedicated to seniors in Crawford
Inventory of Senior and Affordable Rental Housing, 2018
County (44.5 percent within the Meadville, Titusville, and Sagertown
submarkets). Specifically, there are approximately 530 affordable senior Affordable Units Senior Units/Beds
apartment units/independent living facility units, 490 assisted living beds, Meadville 55.4% 21.4%
and 570 nursing facility beds. The Rolling Fields Elder Care Community in Titusville 27.9% 12.8%
Conneautville provides a continuum of care option, including additional Saegertown 0.0% 10.2%
independent living units. Furthermore, there are four projects either Springboro-Conneautville 4.6% 8.4%
underway or planned within Crawford County. In Meadville, there are two Fredericksburg-Kerrtown 0.0% 8.3%
senior housing complexes being planned, including the conversion of the
Cambridge Springs 3.7% 5.1%
163-room former Days Inn into independent living apartments for
residents age 50 and older, and the construction of a 128-unit Pine Street
Mead 8.5% 0.0%
Commons Active Living complex. Hudson Companies is finishing up Conneaut Lake 3.4% 1.6%
construction of the 40-unit Evans Square senior housing complex at Cochranton 3.3% 1.6%
Conneaut Lake and has plans for the 39-unit Adams Place senior housing Townville 0.0% 1.2%
complex in Cochranton. East Fallowfield-Greenwood 0.0% 0.0%
Linesville 0.0% 0.0%
Senior Housing Units/Beds Shenango 0.0% 0.0%
Spartansburg-Bloomfield 0.0% 0.0%
Continuum of
Care, 181, 10% Crawford County 100% 100%
Senior Apts/ Source: Internet, HUD, Caring.com, 2018.
Indep Iving,
531 , 30%
According to Caring.com, an online provider of information on senior
housing options, the average cost of assisted living in Crawford County is
$2,885 per month, equivalent to 83 percent of average cost within the
Nursing, 566 , nation ($3,460) overall. Pennsylvania does not provide financial assistance
32%
or care services funded by Medicaid to residents that live in assisted living
communities, however there is a non-Medicaid program called PA Dom
Care (Domiciliary Care Program). Additionally, Pennsylvania offers a
supplement to Supplemental Security Income (SSI) to persons who are
living in non-nursing residential care.
Assisted Living
, 489 , 28%
Source: Internet, HUD, PHFA, 2018.
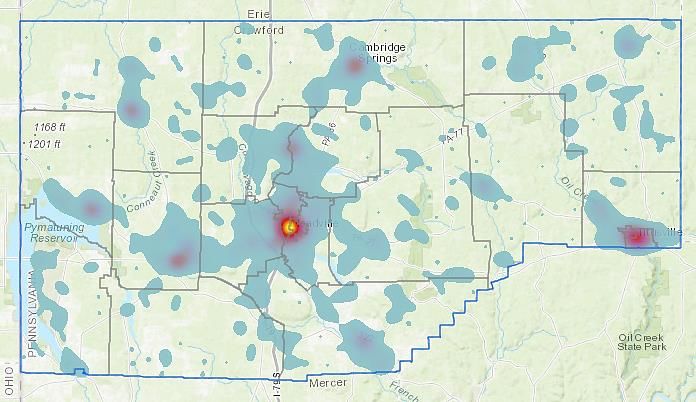
Crawford County Housing Plan 22Inventory of Senior and Affordable Rental Housing, 2018 Sources: U.S. Department of Housing and Urban Development, Open Data; PA Housing Finance Agency, January 2018 ; Internet, 4ward Planning, Inc. . Crawford County Housing Plan 23
Inventory of Senior and Affordable Rental Housing, 2018
                                                                                                      Bedrooms                        Capacity
Property Name                                       Submarket               Occupancy
                                                                                             0-1 BR   2 BR   3 BR   4 BR   5 BR   Units      Beds
Capabilities of Crawford County                      Meadville               Disabled          12       -      -      -      -     12          -
Terrace Overview Apts.                               Meadville               Disabled           8       2      -      -      -     10          -
Hands Triad Housing                                  Meadville               Disabled          14       -      -      -      -     14          -
Highland Pointe                                      Meadville               Disabled           8       -      -      -      -      8          -
Disabled Subtotal                                                                              42       2      -      -      -     44          -
611 Terrace Street                                   Meadville            General/Family        -       -      1      -      -      1          -
613 Terrace Street                                   Meadville            General/Family        -       -      1      -      -      1          -
676 Baldwin Street                                   Meadville            General/Family        -       -      1      -      -      1          -
674 Baldwin Street                                   Meadville            General/Family        -       -      1      -      -      1          -
669 Baldwin Street                                   Meadville            General/Family        -       -      1      -      -      1          -
610 Park Ave                                         Meadville            General/Family        -       -      1      -      -      1          -
275 Loomis Street                                    Meadville            General/Family        -       -      1      -      -      1          -
277 Loomis Street                                    Meadville            General/Family        -       -      1      -      -      1          -
553 Arch Street                                      Meadville            General/Family        -       -      1      -      -      1          -
1177 Elm Street                                      Meadville            General/Family        -       -      1      -      -      1          -
350 Willow Street                                    Meadville            General/Family        -       -      1      -      -      1          -
704 State Street                                     Meadville            General/Family        -       -      1      -      -      1          -
786 Grove Street                                     Meadville            General/Family        -       -      1      -      -      1          -
777 North Morgan Street                              Meadville            General/Family        -       -      1      -      -      1          -
413 Pine Street                                      Meadville            General/Family        -       -      1      -      -      1          -
702 - 722 Jones Street                                Titusville          General/Family        2       5      4      -      -     11          -
317 - 323 N. Fourth Street                            Titusville          General/Family        2       1             1      -      4          -
802- 828 W. Oak Street                                Titusville          General/Family        -       7      7      -      -     14          -
218 - 224 Schwartz Lane                               Titusville          General/Family        2       -      2      1      -      5          -
902 - 954 E. Spruce Street                            Titusville          General/Family        2      10     13      2      -     27          -
Briarwood Manor Apts.                                 Titusville          General/Family       29      18      -      -      -     47          -
Country Place Apts                            Springboro-Conneautville    General/Family        8      16      -      -      -     24          -
Elm Street Apartments                                 Titusville          General/Family       18       -      -      -      -     18          -
Elmwood Village                                      Meadville            General/Family        7      33     15      4      2     61          -
Fairmont Apts.                                       Meadville            General/Family       15      16     20      4      -     55          -
Fairview Apts.                                       Meadville            General/Family        -      10     32      6      -     48          -
Forest Green Estates                                 Meadville            General/Family       13      43     34     10      -    100          -
Liberty House                                        Meadville           Homeless Families      -       4      2      -      -      6          -
Morgan Village                                       Meadville            General/Family        9       9     14      7      -     39          -
Parkside Commons                                     Meadville            General/Family       48       8      -      -      -     56          -
Popular Street Homes                                 Meadville            General/Family        -       -      3      -      -      4          -
Shrubb Drive Home                                    Meadville            General/Family        -       1      -      -      -      1          -
Snodgrass Building                                   Meadville            General/Family       11       -      -      -      -     11          -
South Main Place                                     Meadville            General/Family        2       2      1                    5
Titusville Apts.                                      Titusville          General/Family        -      30      -     -      -      30          -
William Gill Commons                                 Meadville            General/Family        4      42     33    21      -     100          -
General/Family Subtotal                                                                       172     255    195    56      2     681          -
Bartlett Gardens                                 Cambridge Springs          Senior Apts        41       2      -     -      -      43          -
Billie Brown Building                               Titusville              Senior Apts        63       2      -     -      -      65          -
Brookside Apartments                                Meadville               Senior Apts        20       -      -     -      -      20          -
Central Towers                                      Titusville              Senior Apts        88       2      -     -      -      90          -
Holland Towers                                      Meadville               Senior Apts       130       2      -     -      -     132          -
Shryock Senior Apts.                                Meadville               Senior Apts        41       -      -     -      -      41          -
Triad Apts.                                         Meadville               Senior Apts        14       -      -     -      -      14          -
Von Bora Place                                      Titusville              Senior Apts        17       -      -     -      -      17          -

Crawford County Housing Plan                                                                                                           24
Inventory of Senior and Affordable Rental Housing, 2018 (Continued)
Bedrooms Capacity
Property Name Submarket Occupancy
0-1 BR 2 BR 3 BR 4 BR 5 BR Units Beds
Washington Street Apts Springboro-Conneautville Senior Apts 30 - - - - 30 -
Adams Place (Proposed) Cochranton Senior Apts 37 2 - - - 39 -
Evans Square (Proposed) Conneaut Lake Senior Apts 36 4 - - - 40 -
Pine Street Commons Active Living (Construction) Meadville Senior Apts NA NA - - - - -
Wesbury United Methodist Community (Planned) Meadville Senior Apts NA NA - - - - -
Carousel House Meadville Assisted Living 5 10 - - - 15 15
Country Acres Personal Care Home Titusville Assisted Living 33 - - - - 33 33
Homestead Hearth Personal Care Home Townville Assisted Living 5 10 - - - 15 30
Juniper Village Meadville Assisted Living - - - - - - 70
Quality Living Center of Crawford County Saegertown Assisted Living - - - - - - 99
Southwoods Assisted Living Titusville Assisted Living 41 - - - - 41 41
Wesbury United Methodist Community Fredericksburg-Kerrtown Assisted Living - - - - - - 210
Cambridge Springs Rehabilitation & Nursing Center Cambridge Springs Nursing - - - - - - 85
Crawford County Care Center Saegertown Nursing - - - - - - 157
Pattisville Healtchcare And Rehab (Formerly Golden Living) Titusville Nursing - - - - - - 77
Meadville Medical Center (Stepping Stones) Meadville Nursing - - - - - - 32
Meadville Rehabilitation and Nursing Center (Aristocare) Meadville Nursing - - - - - - 173
Wesbury Hillside Home Meadville Nursing - - - - - - 42
Rolling Fields Elder Care Community Springboro-Conneautville Continuum of Care - - - - - - 181
Senior Subtotal 601 34 - - - 635 1,245
Total 815 291 195 56 2 1,360 1,245
Sources: U.S. Department of Housing and Urban Development, Open Data; PA Housing Finance Agency, January 2018 ; Internet, 4ward Planning, Inc .
Crawford County Housing Plan 25Housing Tenure by Occupied Housing
Housing Tenure
Owner Renter
From 2000 to 2017, the share of renter-occupied housing units in Crawford
County increased from 24.5 to 28.2 percent, while the share of owner-
occupied housing units decreased from 75.5 to 71.8 percent. The Shenango 84.4% 15.6%
increasing share of renter-occupied housing reflects a trend observed
nationally. According to 2017 estimates provided by Esri, the Meadville and Saegertown 84.2% 15.8%
Titusville submarkets have the highest share of renter-occupied housing East Fallowfield-
units (58.7 and 39.1 percent, respectively). Given that these cities also 83.3% 16.7%
Greenwood
contain the largest concentrations of employment, this housing tenure
Cochranton 82.9% 17.1%
ratio is unsurprising.
Townville 81.7% 18.3%
Share of Housing by Occupancy, Crawford County
Mead 80.4% 19.6%
Rented Owned
80.0% Spartansburg-Bloomfield 80.3% 19.7%
75.5%
71.8% 71.7%
70.0% Springboro-Conneautville 78.5% 21.5%
Conneaut Lake 77.4% 22.6%
60.0%
Cambridge Springs 76.7% 23.3%
50.0%
Linesville 75.7% 24.3%
40.0%
Fredericksburg-Kerrtown 75.3% 24.7%
30.0% 28.2% 28.3%
24.5% Titusville 60.9% 39.1%
20.0% Meadville 41.3% 58.7%
2000 2010 2017 2022
Source: Esri; 4ward Planning Inc., 2018
Source: Esri; 4ward Planning Inc., 2018
Crawford County Housing Plan 26In Crawford County, rates of homeownership peak among householders
between ages 55 and 64, while rates or renting are highest among younger
Household Size and Unit Size
households. From 2000 to 2016, the share of county households that own One way to measure whether housing stock is suited to the local
their homes decreased among nearly all age groups (except those headed population is to compare household size to the number of bedrooms in
by persons between ages 55 and 64), while the share of households that dwelling units in the local inventory. The share of one-person households
rent their homes increased. A falling ownership rate in younger age groups in Crawford County (27 percent) is much larger than the share of studio or
can signal the difficulty of making a first-time home purchase, while falling one-bedroom units, combined (nine percent). Likewise, the share of one-
ownership rates among the middle-aged usually signal moves to the rental and two-person households combined (65 percent) is much larger than the
market. share of studio, one-, and two-bedroom units, combined (35 percent). In
other words, the mismatch between housing unit size and household size
Homeownership by Age, 2010-2016 is most likely to occur among small households. With the average
2010 2016
household size in the county expected to remain constant through 2022
100%
(2.4 persons per household), a shortage of small housing units relative to
household size will likely continue.
50%
Household Size vs. Unit Size, 2016
0% 1 person 2 people 3 people 4 people 5+ people
15-24 25-34 35-44 45-55 55-64 65-74 75-84 85+
Source: 2016 ACS, B25007 Household
27% 38% 15% 11% 8%
Size
Renters by Age, 2010-2016
100% 2010 2016
80% Unit Size 9% 26% 46% 15% 4%
60%
40%
1 or less Bdr. 2 bdr. 3 Bdr. 4 Bdr. 5+ Bdr.
20% Source: 2012-2016 ACS 5-Year Estimates, B11016; DP04
0%
15-24 25-34 35-44 45-55 55-64 65-74 75-84 85+
Source: 2016 ACS, B25007
Crawford County Housing Plan 27You can also read