Crop distribution extraction based on Sentinel data - E3S Web of Conferences
←
→
Page content transcription
If your browser does not render page correctly, please read the page content below
E3S Web of Conferences 252, 02081 (2021)                                                                https://doi.org/10.1051/e3sconf/202125202081
PGSGE 2021

         Crop distribution extraction based on Sentinel data
         Yu Liu1,a,Xiaoping Wang1,b* ,Jiaxin Qian1,c
         1   Xi’an University of Science and Technology,Xi’an, 710054 China
         2                                                                        1
             Xi'an Dadi Surveying And Mapping Co., Ltd,Xi’an, 710054 China

                       Abstract: Remote sensing identification and classification of crops is the use of remote sensing
                       for estimating crop planting area of timely and accurate monitoring of crop growth and plant
                       diseases and insect pests in advance to make the product output to estimate the key and premise of
                       the study using Sentinel-1 and Sentinel-2 satellite, by random forest algorithm, the traditional
                       optical wavelengths and vegetation index The backward scattering field of red edge information
                       and radar information in feature selection and feature classification, including winter wheat
                       summer corn orchard woodland town water and bare land set three controls, such as the first group
                       contains radar time characteristics, the characteristics of the second control group contains red edge
                       long, the third group includes traditional vegetation index for phase characteristics, analyzed the
                       different classification accuracy . The results from the confusion matrix show that the red edge
                       band edge after index and the radar scattering information to join the crop classification accuracy
                       is improved effectively. Sentinel optical and radar satellites with a time resolution of 5-6 days have
                       great potential for crop monitoring research.

       1 Introduction                                                         Aperture Radar, whose time resolution is 6 days, which
                                                                              can monitor the growth of crops all day and all day. C-
       Crop classification has important application value in crop            band SAR can well reflect the canopy information of
       growth, yield estimation and food security. With the                   vegetation, which is beneficial to crop classification.
       advent of free sentinel data with high spatial and temporal                Due to the limitation of sensor bands, traditional
       resolution, it is possible to combine optical and radar                remote sensing image classification can only use the blue,
       remote sensing images with red edge information and                    green, red, near-infrared and short-wave infrared of visible
       radar information to classify crops. The identification and            light. However, the spectral curves of some vegetation are
       classification of crops by remote sensing technology is the            very similar in these bands and it is difficult to distinguish
       key and premise to use remote sensing technology to                    them. The addition of red-edge information can make up
       estimate crop planting area, timely and accurately monitor             for this defect [2-10]. However, at present, there are few
       crop growth, diseases and insect pests, and make                       studies involving red edge information and radar
       production estimation in advance [1]. With the progress of             backscattering information in the classification, mainly
       science and technology, remote sensing technology is also              due to the limitation of data sources. Red edge information
       developing continuously. More and more medium and                      can effectively reflect the growth of vegetation [11], and
       high resolution multi-spectral remote sensing data begin               radar can monitor the surface environment all day long.
       to be widely used in the field of agricultural remote                  Therefore, red edge information and radar information
       sensing. Sentinel-2 satellite has a high temporal resolution,          will be widely used in crop growth monitoring and grain
       and the multi-spectral imager mounted on it adds three                 yield estimation, etc., and sentinel data will have great
       vegetation red-edge bands, which is not available for                  potential in application.
       traditional resource satellites. The red edge is a unique                  In this context, this study will combine sentinel optical
       feature of vegetation. The addition of red edge information            data and radar data, set three control groups of radar, red
       can improve the monitoring ability of crops. In addition,              edge and traditional vegetation index, and use random
       the Sentinel-1 satellite is equipped with C-band Synthetic             forest algorithm to find the optimal features involved in

         *   Corresponding author : bemail: 18210210081@xust.stu.edu.cn,
         aemail:  18210063036@xust.stu.edu.cn , cemail: 873280820@qq.com

  © The Authors, published by EDP Sciences. This is an open access article distributed under the terms of the Creative Commons Attribution License 4.0
  (http://creativecommons.org/licenses/by/4.0/).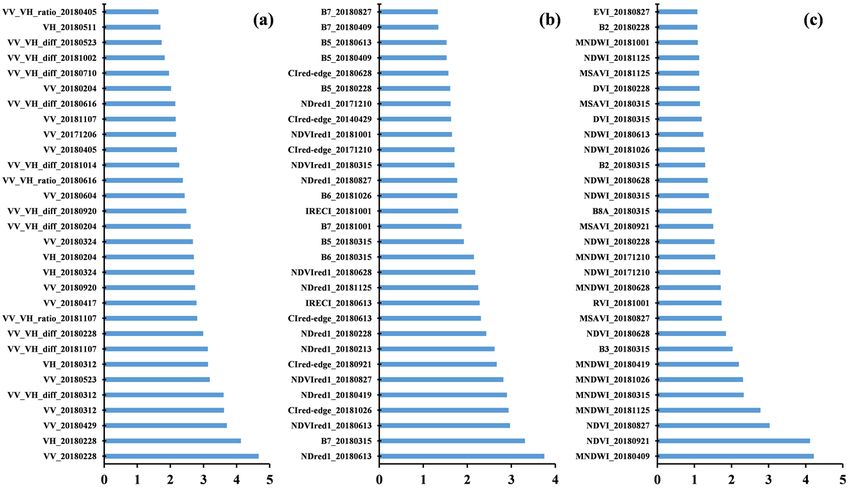
E3S Web of Conferences 252, 02081 (2021)                                                                https://doi.org/10.1051/e3sconf/202125202081
PGSGE 2021

       classification and conduct classification research on               Shaanxi province, the terrain is flat, belongs to the warm
       winter wheat and summer corn in Guanzhong area.                     temperate zone semi-humid climate zones, rain heat over
                                                                           the same period, very suitable for two seasons a year of
                                                                           planting patterns, the main crops are winter wheat,
       2 Research area and data                                            summer corn and cotton, etc[12]. The study area of this
                                                                           paper is Pucheng County in Guanzhong Plain, where the
       2.1 Introduction to the research area                               main crops are winter wheat, summer corn, cotton, pear
                                                                           and apple trees.
       The Guanzhong plain is located in the central and southern

                                           Fig.1 Illustration of the distribution of weather stations
                                                                           prevent overfitting. They assume that different
                                                                           independent predictors are not correct in different regions.
       2.2 Remote sensing data used in the research
                                                                           Random forest has many features, such as it can process
       area
                                                                           thousands of input variables without deleting variables; It
       This article chooses the remote sensing data from NASA's            gives an estimate of which variables are important in the
       official website and ESA Copernicus Open Data Center                classification; With the progress of forest construction, it
       select the Level of 25 Sentinel - 1-1 Level from High               will produce internal unbiased estimation of
       resolution image product (High resolution Ground Range              generalization error. It has an efficient way to estimate
       Detected, GRDH) and L1C class data from 14 Sentinel-2               missing data and remains accurate when much of it is lost;
       episodes. In this paper, the Digital elevation model                It has a method to balance the errors in unbalanced data
       Satellite data center, which is derived from the Alaska by          sets of class groups; Calculate prototypes that provide
       Advanced earth observation Satellite of surveying and               information about the relationships between variables and
       mapping, the spatial resolution of 12.5 m.                          classifications; It computes proximity between pairs of
           This article chooses the Guanzhong plain region, the            cases that can be used for clustering, locating outliers, or
       winter wheat and summer maize growth cycle by China's               (by scaling) giving interesting views of the data [13-14].
       aim of crop growth and soil humidity value provides data
       set, as shown in table 3, the whole period of winter wheat          3.2 Feature selection
       growth cycle in October each year to June of next year,
       after emergence - winter - green - - such as heading to             Spectrum, vegetation index, the traditional red edge after
       maturation stage, jointing stage and stage of summer                the vegetation index and radar scattering coefficient
       maize growth cycle for the June to September every year,            characteristics, among them, the traditional vegetation
       Experiencing seedling - jointing - heading - maturity and           index including difference vegetation index (DVI), the
       other stages. Sentinel data covers the main growing                 ratio vegetation index (RVI), normalized difference
       seasons of crops.                                                   vegetation index (NDVI), enhanced vegetation index
                                                                           (EVI), modified soil adjusted vegetation index (MSAVI),
                                                                           normalized water index (NDWI), improved normalized
       3 Method and technical process                                      index of water (MNDWI), Red-edge vegetation index
                                                                           includes normalized differential Red-edge vegetation
       3.1 The basic principles of random forest                           index (NDVIRED1, 2, 3), normalized differential Red-
       classification                                                      edge index (NDRE1, 2), Red-edge position index (REP),
                                                                           new inverted Red-edge chlorophyll index (IRECI) and
       Random Forest (RF) is a machine learning algorithm that             Red-edge chlorophyll index (CIRD-edge), a total of 25
       uses multiple decision tree classifiers to parameterize             characteristics [15-23]. Radar backscattering coefficient
       models for classification, improve prediction accuracy and          features include VV, VH, the difference between VV and

                                                                       2
E3S Web of Conferences 252, 02081 (2021) https://doi.org/10.1051/e3sconf/202125202081
PGSGE 2021
VH, and the ratio of VV to VH . 3.5 Principal component analysis of optimal
feature image
3.3 Technical process Principal Component Analysis (PCA) [24] is an image
processing method to remove redundant information of
The Sentinel-1 data is preprocessed by SARscape
multi-band images, and the information of each band after
software, including the following steps: data import and
Principal Component transformation is not correlated.
Mosaic, geometric registration, multi-temporal scatter
After combining the optimal optical features and radar
filtering, radiometric calibration and geographic coding.
features selected in the previous step, the optimal optical
The backscattering coefficient images of VV and VH
features and radar features selected in the previous step
polarization with a spatial resolution of 10m were
were normalized with a confidence of 1%, and then
obtained and tailored according to the study area.
principal component analysis was carried out, and the first
The Sentinel-2 data were obtained by using the
six principal components of the two were retained.
SEN2COR toolbox of ESA's Snap software to obtain the
The random forest algorithm was used to classify
L2A level products, and each band was resampled to the
winter wheat and summer corn. The training samples were
10m resolution by the nearest neighbor method, and then
randomly sampled, with 30% as training samples and the
cropped. Finally, the multitemporal surface reflectance
remaining 70% as verification samples. The optimal
image with spatial resolution of 10m in the study area is
feature images through independent principal component
obtained.
analysis were classified by random forest algorithm. The
The geometric registration of radar and optical remote
accuracy of the three control groups was evaluated by
sensing is very important in the cooperative research of
calculating the confusion matrix and Kappa coefficient of
radar and optical remote sensing. Due to the difficulty in
the classification result graph.
obtaining accurate control points on the radar Image, the
Envi5.5 Image Registration Workflow module is used to
perform geometric Registration of the radar Image based 4 Results and analysis
on the optical Image to limit the error to 0.5 pixels.
The Sentinel-1 multitemporal radar image features and
Sentinel-2 vegetation index features were calculated 4.1 Random forest classification
respectively. The RF algorithm was used to estimate the feature
Samples were evenly selected from the plots, importance of the three characteristic variable groups. The
woodlands, orchards, water bodies and buildings in the table shows the top 30 characteristic variables in the
winter wheat-summer maize rotation mode in the study importance ranking of each control group, in which the
area, and 15 sample points were selected for each category, orange marker represents the growth cycle of winter wheat,
and the mean values of each feature were calculated. Due and the green marker represents the growth cycle of
to the influence of cloud, rain and aerosol, the Sentinel-1 summer corn. Among them, the optimal time phase of
radar backscattering coefficient images were group 1 (only containing radar information) mainly
reconstructed to analyze the characteristic curves of concentrated in late February 2018 to late May 2018 (this
different vegetation at different scales, different time stage is the winter wheat greening to maturity stage) and
phases and different features. September 20, 2018 (this stage is the summer corn
maturity stage). Group 2 contains only red edge
3.4 Using RF to determine the importance of information of the optimal phase concentration in mid-
features February to early April, 2018 and 2018 in late August and
late September, the optimal red edge characteristics of
Set three control group, one of the first group contains vegetation index is NDred1, NDVIred1 and CIred edge, REP
Sentinel - 1 for phase radar characteristics after the index cannot effectively distinguish between crops,
scattering coefficient, the second control include Sentinel mainly reflects the vegetation red edge within the scope of
- 2 long red edge features (three red edge band and its the position of the maximum reflectivity spectrum slope,
corresponding edge vegetation index), the third in the and can be seen from the diagram, no obvious difference
control group contains Sentinel - 2 long phase of of different vegetation red edge position, therefore, its
traditional optical characteristics (blue, green, red, near importance is low; The optimal time phase of control
infrared and short-wave infrared wavelengths and their group 3 (which only contained a single band and
corresponding vegetation index), will be three groups traditional vegetation index information) was similar to
respectively characteristics of band combination, Through that of control group 2, and the optimal vegetation index
the training samples mentioned above, the importance of was MNDWI, NDVI, NDWI and MSAVI, mainly because
optical and radar characteristic variables and time-phase MNDWI and NDWI could effectively reflect the water
variables for classification was determined by using the content information of crop canopy.
random forest algorithm. The top 30 features in each group
of importance are combined in different bands to carry out
the next step of principal component analysis.
3E3S Web of Conferences 252, 02081 (2021) https://doi.org/10.1051/e3sconf/202125202081
PGSGE 2021
Fig.2 Optimal features for classification of different feature groups
edge feature group and the radar feature group. In the radar
feature group, the most serious misclassification is winter
4.2 Result analysis and precision evaluation of
wheat summer corn and orchard, which may be because
random forest classification
the difference of radar backscattering between them is not
The control of different random forest classification, obvious in part of the growth cycle. In other part, winter
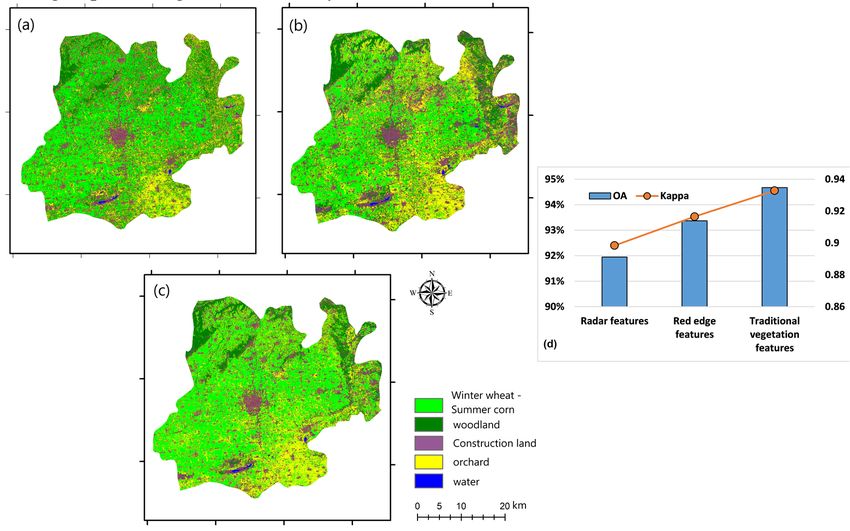
classification results as shown in figure 3, among them, wheat summer corn is misclassified into buildings, which
the red edge features combination traditional vegetation may be caused by the phenomenon of mixed pixels. In the
index group classification results are basically identical, red-edge feature group, construction land and orchard are
radar extracting feature set of flat terrain of the study area the most seriously misclassified, mainly because the red-
south of summer corn and fruit orchards and other control edge feature group contains only three red-edge
group, but the error to the northeast of the study area information and one near-infrared band, and lacks the
classified as forest land, orchard this may be due to the most important short-wave infrared band to distinguish
influence of the height in the northeast. Another set of construction land. The classification accuracy of the three
sample point was used to calculate the confusion matrix of groups reached satisfactory results, and the information of
four classification results, and the differences of multi- winter wheat-summer maize rotation crops, orchards and
temporal classification results with different features were woodlands in the study area could be extracted effectively.
compared. The classification accuracy of the traditional The accuracy of different feature classification groups is
vegetation feature group is the highest, followed by the red shown in the table.
Fig. 3 Results of RF classification ((a)radar feature group, (b) red edge feature group, (c)traditional vegetation feature group
(d) Classification accuracy of different feature groups)
On April 19, 2018, and this study Sentinel on September
21, 2018-2 images as winter wheat and summer corn,
5 Conclusion selection of the training sample images, setting up three
4E3S Web of Conferences 252, 02081 (2021) https://doi.org/10.1051/e3sconf/202125202081
PGSGE 2021
control group, using random forest algorithm to find fine classification of crops by remote sensing based
optimal characteristics of each group involved in on improved separation threshold method [J]. Journal
classification and band combination after component of Applied Sciences,2019,37(01):51-63.
analysis, then the use of random forests for classification, 7. Liu Z H, Liu L, Guo H, Cheng P. The extraction of
finally analysis and accuracy evaluation. The main spring wheat based on GF1-NDVI time series image
conclusions are as follows: was studied [J]. Beijing surveying and
Through the random forest algorithm, the best features mapping,2018,32(06):643-646.
participating in the classification of winter wheat and
8. Zhao Z, Yan L. 16 - band image spectral feature
summer corn were selected. Principal component analysis
classification of Worldview satellite [J]. Remote
of the selected features could better highlight the
sensing information,2019,34(01):36-43.
differences of construction land, soil, crops, woodland and
shadow, and enhance the information of vegetation. 9. Bi K Y, Niu Z, Huang N, Kang J, Pei J. Vegetation
Compared with traditional optical features, identification based on Sentinel-2a time series data
multitemporal radar features have certain advantages. and object-oriented decision tree method [J].
Synthetic aperture radar (SAR) is not affected by cloud Geography and Geographic Information
and rain and can obtain continuous crop phenology Science,2017,33(05):16-20+27+127.
information. Although the Sentinel-2 binary satellite 10. Wang L J, Guo Y, He J, Wang L M, Zhang X W, Liu
network can improve the temporal resolution up to five T. A Sentinel-2a Image Crop Extraction Method
days, it is difficult to guarantee continuous and stable Based on Decision Tree and SVM [J]. Transactions of
images during critical periods of crop growth. Combining the Chinese Society for Agricultural
optical and radar images with different spatial and Machinery,2018,49(09):146-153.
temporal resolutions can give full play to the advantages 11. Fang C Y, Wang L, Xu H Q. Comparative study of red
of multivariate data, which is more conducive to the edge index of different vegetation in health
monitoring of crop growth. discrimination of urban grassland [J]. Journal of Geo-
Control group both can effectively extract the different information Science,2017,19(10):1382-1392.
features, among them, the traditional characteristics of
12. Zhang P, Ma X Y, Zhang L, Xing X G. Land use
vegetation index set is highest in the crops in the study of
classification accuracy, the overall accuracy of 94.67%, classification in Guanzhong region based on different
red edge index set of classification accuracy is slightly vegetation indices and classification regression trees
[J]. Soil and Water Conservation
lower than the traditional characteristics of vegetation
index set, the precision of the radar feature set of the Research,2018,25(03):310-316.
lowest, but accuracy is over 90%, the instructions for the 13. Belgiu M, Drăguţ L. Random forest in remote sensing:
red edge, radar characteristics can effectively extract the A review of applications and future directions[J].
Guanzhong area of crops. ISPRS Journal of Photogrammetry and Remote
Sensing, 2016, 114: 24-31.
14. Gislason P O, Benediktsson J A, Sveinsson J R.
References: Random forest classification of multisource remote
sensing and geographic data[C]. 2004 IEEE
1. Ding Y W. Extraction of winter wheat planting area
International Geoscience and Remote Sensing
based on MODIS image data in northern Anhui
Symposium, 2004, 2: 1049-1052.
Province [D]. Anhui University,2019.
15. Tucker C J. Red and photographic infrared linear
2. Zhang X W, Chen Y S, Meng Q, Wang X. Crop
combinations for monitoring vegetation[J]. Remote
phenology extraction based on time series MODIS
Sensing and Environment, 1979, 8(2): 127-150.
NDVI [J]. Chinese Agricultural Science
Bulletin,2018,34(20):158-164. 16. Major D J, Frédéric Baret, Guyot G. A ratio
vegetation index adjusted for soil brightness[J].
3. Xu Q Y, Yang G J, Long H L, Wang C C, Li X
International Journal of Remote Sensing, 1990, 11(5):
C ,Huang D C . Crop planting identification based on
727-740.
MODISNDVI multi-year time series data [J].
Transactions of the Chinese Society of Agricultural 17. Schell J A, Deering D. Monitoring vegetation systems
Engineering,2014,30(11):134-144. in the Great Plains with ERTS[J]. NASA Special
Publication, 1973, 351: 309.
4. Jin Z T, Li W G, Jing Y S. Research on the
Appropriate Scale of Winter Wheat Planting Area 18. Gitelson A A, Merzlyak M N. Remote sensing of
Extraction Based on Image Fusion [J]. Jiangsu chlorophyll concentration in higher plant leaves[J].
Journal of Agricultural Sciences,2015,31(06):1312- Advances in Space Research, 1998, 22(5): 689-692.
1317. 19. Qi J, Chehbouni A, Huete A R, et al. A modified soil
5. Ji X S, Li X, Wan Z F, Yao X Zhu Y, Cheng T. adjusted vegetation index[J]. Remote sensing of
Classification of cotton and jujube trees in Alar city environment, 1994, 48(2): 119-126.
of Xinjiang based on high spatial resolution satellite 20. Christos E and Alexandre N. Red-Edge Normalized
image [J]. Agricultural Sciences in Difference Vegetation Index (NDVI705) from
China,2019,52(06):997-1008. Sentinel-2 imagery to assess post-fire regeneration [J].
6. Yang H W, Fang J Y, Zhao D. Feature selection for Remote Sensing Applications: Society and
5E3S Web of Conferences 252, 02081 (2021) https://doi.org/10.1051/e3sconf/202125202081
PGSGE 2021
Environment, 2020, 17: 100283. agriculture[J]. Remote Sensing of Environment, 2004,
21. Frampton W J, Dash J, Watmough G, et al. Evaluating 90(3): 337-352.
the capabilities of Sentinel-2 for quantitative 23. Gao B C. NDWI-A normalized difference water index
estimation of biophysical variables in vegetation[J]. for remote sensing of vegetation liquid water from
ISPRS journal of photogrammetry and remote space[J]. Remote sensing of environment, 1996, 58(3):
sensing, 2013, 82: 83-92. 257-266.
22. Haboudane D, Miller J R, Pattey E, et al. 24. Wang Z M,Du B,Zhang L P,et al. Hyperspectral image
Hyperspectral vegetation indices and novel classification based on texture feature and
algorithms for predicting green LAI of crop canopies: morphological feature fusion [J]. Journal of photons,
Modeling and validation in the context of precision 2014, 43(08): 122-129.
6You can also read