Data-driven modeling reveals the Western dominance of global public interest in earthquakes - Nature
←
→
Page content transcription
If your browser does not render page correctly, please read the page content below
ARTICLE
                  https://doi.org/10.1057/s41599-021-00914-7               OPEN

                  Data-driven modeling reveals the Western
                  dominance of global public interest in earthquakes
                  Jonghun Kam 1,2,3 ✉, Jihun Park2, Wanyun Shao                           4,   Junho Song5, Jinhee Kim6, Fabrizio Terenzio Gizzi                       7,

                  Donatella Porrini 8 & Young-Joo Suh2
1234567890():,;

                  Catastrophic earthquakes stimulate information-seeking behaviors beyond the affected
                  geographical boundaries; however, our understanding of the dynamics of global public
                  interest in earthquakes remains limited. Herein, we harness Big Data to examine the dynamic
                  patterns of global public interest, concerning 17 significant worldwide earthquakes over
                  2004–2019. We find that the global community shows a higher level of interest when an
                  earthquake occurs in developed countries than in developing countries; however, they lose
                  their interest in the former more rapidly than the latter. Regardless of the affected nation,
                  there is a one- to two-week “golden” time window when attention can be leveraged for
                  fundraising and humanitarian aid. Our findings suggest that European citizens who are highly
                  interested in earthquakes emerge as a potential key community to achieve great inclusive-
                  ness in policy interventions to solicit international aid. The findings of this study hint at how
                  Big Data can be utilized to identify “time windows of opportunities” for international
                  humanitarian organizations to efficiently raise donations, charities, and aid resources around
                  the world.

                  1 Division of Environmental Science and Engineering, Pohang University of Science and Technology, Pohang 37673, South Korea. 2 Artificial Intelligence

                  Graduate School, Pohang University of Science and Technology (POSTECH), Pohang 37673, South Korea. 3 Institute for Convergence Research and
                  Education in Advanced Technology, Yonsei University, Seoul 21983, South Korea. 4 Department of Geography, The University of Alabama, Tuscaloosa, AL
                  35487, USA. 5 Department of Civil, Construction and Environmental Engineering, The University of Alabama, Tuscaloosa, AL 35487, USA. 6 Division of
                  Humanities and Social Sciences, Pohang University of Science and Technology, Pohang 37673, South Korea. 7 Institute of Heritage Science, National Research
                  Council (ISPC-CNR), Area della Ricerca, C.da S. Loja, 85050 Tito (Potenza), Italy. 8 Department of Management, Economics, Mathematics and Statistics,
                  University of Salento, Centro Ecotekne - Via per Monteroni, 73100 Lecce, Italy. ✉email: jhkam@postech.ac.kr

                  HUMANITIES AND SOCIAL SCIENCES COMMUNICATIONS | (2021)8:242 | https://doi.org/10.1057/s41599-021-00914-7                                                  1
ARTICLE                                HUMANITIES AND SOCIAL SCIENCES COMMUNICATIONS | https://doi.org/10.1057/s41599-021-00914-7

O
Introduction
         ver a half-million people have lost their lives due to           Maharjan, 2018). Insufficient transdisciplinary collaborations
         earthquakes since 2004 (NGDC/WDS, 2019). In 2010,                between the natural and social science communities limit the
         the Haiti earthquake resulted in 316,000 casualties (3% of       practical utilization of big data to improve social policymaking
the population) and US$8 billion in economic losses (120% of the          (Poel et al., 2018).
country’s gross domestic product (GDP)) (Azevedo, 2019). The                 Here, we aim to understand and model the dynamics of global
destructiveness of earthquakes has led to rigorous and perse-             public interest in earthquakes, harnessing big data from diverse
verant efforts of the scientific community to predict the occur-           sources, including the National Oceanic and Atmospheric
rence of earthquakes. Historically, however, there has been no            Administration’s (NOAA) Significant Earthquake Database,
successful prediction of an earthquake (Merz et al., 2020). This          Google Trends, Wikipedia, and various socioeconomic indices.
unpredictability of earthquakes results in missing a timely               The null hypothesis of this study is that earthquake-related deaths
warning of the earthquake occurrence and thus causes massive              raise the level of global public interest in earthquakes at the same
socio-economic losses, including psychological trauma among               rate and to the same degree, regardless of the socio-economic
earthquake victims (Cénat et al., 2020; Hogg et al., 2014, Maya-          development of the affected nation. More specifically, we strive to
Mondragón et al., 2019; Xu and Wei, 2013). Earthquake-related             answer the following questions: (1) What are key factors in the
losses stem from not only the characteristics of earthquakes but          dynamics of global public interest in earthquakes? Are they either
also the community’s resilience to earthquakes. Particularly,             physical (earthquake magnitude), socioeconomic (GDP per
developing countries require timely international humanitarian            capita) factors, or others? (2) Which nations are key contributors
aid for relief and recovery, while they are mainly dependent on           to the dynamic patterns of global public interest in earthquakes?
non-requested aid (Besiou et al., 2011; Nagendra et al., 2020; Van        and (3) How can we leverage the current dynamic patterns of
Wassenhove, 2006).                                                        global public interest in earthquakes to improve the current
   Lately, humanitarian organizations are aware of the impor-             strategies for international aid for earthquake relief and response?
tance of risk communication during the emergence of natural               Answering these questions will contribute to a better under-
disasters, not only for effective practical implementation of aids        standing of the dynamic patterns of global public interest in
but also for a timely social response that could motivate donors          earthquakes and provide an insight into how to improve the
even in countries far away (HHI, 2010). Public interest often             current international strategies for earthquake relief and recovery
increases as traditional mass media and social media report dis-          from the lens of big data.
asters and spread the information “Regarding the Pain of Others”
(Moeller, 2006). What’s more, the paradigm of disaster journal-
ism has been shifted from reporting objective information, such           Data for earthquakes and search activity volumes
as the number of deaths and economic losses, to more emotional            The NOAA National Geophysical Data Center/World Data Service
and engaging forms of storytelling (Cottle, 2013).                        (NGDC/WDS) provides a global database for over 6700 significant
   In a globalized age, the role of media and communications in           earthquakes from 2150 BC to the present (NGDC/WDS, 2019).
disaster mitigation has been changed (Cottle, 2014). There is             According to the NGDC/WDS database, a significant earthquake is
considerable complexity at work in the media’s different construal        defined as one that caused deaths, incurred at least moderate
of disasters, which interacts with political power, surrounding           property damage (~$1 million or more), had a magnitude of at least
social relations and cultural meanings, as well as processes of           7.5 on the Richter scale or the modified Mercalli intensity (MMI)
global interdependency. Particularly, the spectators in the Wes-          scale, and/or generated a tsunami. The database includes the date
tern countries react to the distant sufferers that appear frequently      and time of occurrences, the geographical locations of the epicenters,
in mass media. It raises a question about the ethical role of the         focal depth, magnitude, maximum MMI intensity, and socio-
media in public life today (Chouliaraki, 2006).                           economic data for casualties and economic losses.
   Recently, social media has played a crucial role in dis-                  Google Trends (GT) provides a relative search activity volume
seminating news of earthquakes and their socioeconomic impacts            of Google product users dating from 2004 and has been used to
on the local communities through the Internet, thereby increasing         understand the predictability of real-time economic activities
public attention and thus attracting more donations around the            (Choi and Varian, 2012), disease outbreaks (Carneiro and
world than ever before (Gao et al., 2011; Martin, 2013; Russell,          Mylonakis, 2009), and human behaviors (Gunn and Lester, 2013).
2005). For example, the Red Cross received eight million dollars          More recently, the Google Trends data has also been used to
of charity within two days after the 2010 Haiti earthquake                reveal dynamic patterns of public awareness of or interest in
through social media (Gao et al., 2011). Due to a lack of available       floods (Thompson et al., 2021) and droughts (Kam et al. 2019;
global data, however, it is still challenging to have a compre-           Kim et al., 2019) and its linkages with water use behaviors
hensive understanding of the extent of social media’s influence on         (Gonzales and Ajami, 2017), as well as the time windows of
the social response to disasters around the world.                        opportunities to obtain earthquake insurance at the national level
   Technological advances have facilitated the global community’s         (Gizzi et al., 2020). A previous study (Gizzi et al., 2020) proposed
ability to seek and share information via diverse channels, such as       a method to generate weighted daily time series of information
interactive web search engines and social media, during almost            search activity volume about earthquakes. First, they retrieved
every phase of a disaster. Near real-time monitoring data of              monthly GT data using the search topic, “earthquake,” from
online search, activities enable us to investigate the aggregate          January 2004 through August 2019, and they retrieved daily GT
dynamics of public interest in disasters at the local, national, and      data at the 6-month interval over the study period. Then, they
global levels (Dahlberg, 2001). In addition, such data has been           weighted the daily GT data by the monthly GT data and annual
used as an alternative source to monitor the magnitude and                percentages of the population using the Internet. Following this
affected the spatial extent of earthquakes in real-time (Earle,           method, we first obtain both daily and monthly Google Trends
2010). However, the existing literature is limited on how the             data and the percentages of national populations using the
aforementioned big data from social monitoring can be effectively         internet and GDP per capita for 62 nations from the World Bank
utilized to advance our understanding of the dynamics of                  Open Data (Azevedo, 2019). Then, we compute the weighted
the social response to disasters across nations (Tan and                  daily GT data across 62 nations (see Fig. S1 and Extended

2                         HUMANITIES AND SOCIAL SCIENCES COMMUNICATIONS | (2021)8:242 | https://doi.org/10.1057/s41599-021-00914-7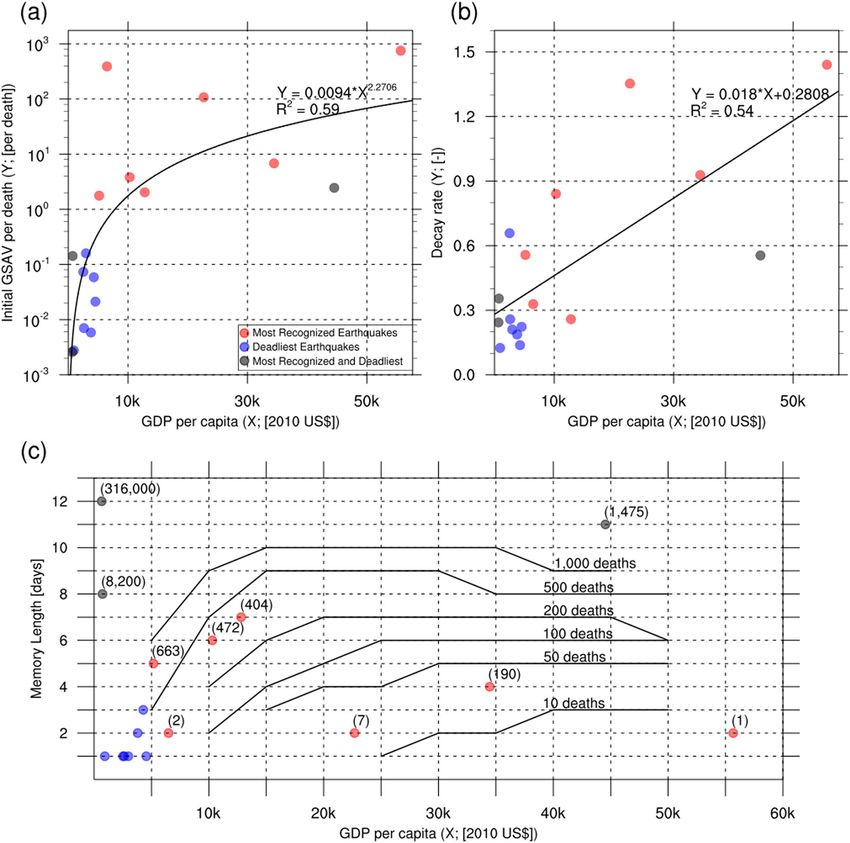
HUMANITIES AND SOCIAL SCIENCES COMMUNICATIONS | https://doi.org/10.1057/s41599-021-00914-7                                             ARTICLE

Fig. 1 Discrepancy between the top 10 deadliest and most recognized earthquakes since 2004. casualties (a) and initial global search activity volumes
(GSAVs; (b)) of the 17 identified earthquakes. The size of circles in (a) and (b) represents the corresponding earthquake’s casualties and initial GSAVs.
Black dots depict earthquakes in both categories (deadliest and most recognized). Blue and red dots depict the remainder of the deadliest and most
recognized earthquakes, respectively. Areas colored in ivory depict the 62 nations that contribute to the daily GSAV data.

Database S1) that show high search activity volumes over the                    Then, we use the observed relationship between the decay rate
study period (areas colored in ivory in Fig. 1).                             of GSAVs and the GDP per capita of the affected nations from
   To validate the weighted daily GT data, we use the daily pageview         the 17 earthquakes to model the decay rate (α) of global public
counts of the Wikipedia webpage, “Earthquake” (Wikipedia, 2020).             interest in earthquakes (Eq. (2); see Fig. 3b).
In 2019, an average of 1.5 billion different devices visited Wikipedia
per month and traversed over 100 billion documents in total. We                              α ¼ 0:018  GDP per capita þ 0:2808                      ð2Þ
collect the daily pageview counts of “Earthquake” from the Wiki-               We develop a power-law decay (PLD) model for nation-level
media Analytics Pageview Application Programming Interface (API)             public interest in earthquakes for each of the 62 nations, following
by querying daily pageview counts with the article named “Earth-             previous studies (Kam et al., 2019; Sano et al., 2013) (Eq. (3)).
quake” from July 2015 (the earliest month for which the daily                                                                            1
pageview count data are available) through August 2019 (Fig. 2). The           E GSAVðt; iÞ GSAVðt  1; iÞ ¼ GSAVðt  1; iÞ                          α
Pearson correlation coefficient between weighted daily GT data and                                                                 ½t  ðt  1Þ þ 1
the daily view data of the Wikipedia webpage, “Earthquake” is 0.34                                                                                    ð3Þ
over the overlapped period.
                                                                             where E[A|B] represents the expected value of A (herein, global
                                                                             search activity volume (GSAV) at time, t) given the value of B
Methods: modeling of global interest in earthquake                           (search activity volume at time, t−1), t is the tth day after the
For modeling the dynamics of global public interest in earth-                occurrence date of an earthquake (e.g., t = 0 for the earthquake
quakes, we first compute the initial global search activity volumes           occurrence date).
per death during the occurrence date of an earthquake, i, for the               Equation (3) can be simplified as Eq. (4).
17 earthquakes. Then, we train an empirical non-linear model for
the initial global search activity volumes per death for an earth-                                                               1
                                                                                         E GSAVðt; iÞ GSAVð0; iÞ ¼ GSAVð0; iÞ αt              ð4Þ
quake, i. This non-linear model is a function of the GDP per                                                                      2
capita of the affected nation by an earthquake (Fig. 2a). Then, we              Then, we use the PLD model (Eq. (4)) with the estimated initial
use this empirical model to estimate the initial global search               global search activity volume (Eq. (1)) and decay rate of global
activity volume if the casualties and the GDP per capita of the              public interest in earthquakes (Eq. (2)) to simulate the daily level
affected nation are given (Eq. (1); see Fig. 3a and the detailed             of global public interest in the 60 hypothetic earthquakes (six
calculations in Extended Database S2).                                       casualties (10, 50, 100, 200, 500, 1000 deaths) times 10 GDPs per
   GSAVð0; iÞ ¼ 0:0094  casualties  GDP per capita2:2706            ð1Þ    capita of an affected nation from 5000 to 50,000 in 2010 US$ with
                                                                             a constant interval of 5000).
where and i is the identification number for an earthquake from                  Lastly, we count the number of days when the simulated daily
the NGDC/WDS database.                                                       GSAV is ≥100 after the occurrence data, defined as the memory

HUMANITIES AND SOCIAL SCIENCES COMMUNICATIONS | (2021)8:242 | https://doi.org/10.1057/s41599-021-00914-7                                                  3
ARTICLE                                  HUMANITIES AND SOCIAL SCIENCES COMMUNICATIONS | https://doi.org/10.1057/s41599-021-00914-7

Fig. 2 Consistency between Google Trends and Wikipedia pageview data. Time series of daily GSAVs (a) and daily views of the Wikipedia “Earthquake”
webpage (b) from July 2015 to August 2019, which was retrieved on January 1, 2020.

lengths of simulated global public interest in earthquakes (see Fig. 3c     of disasters. For example, four of the top 10 deadliest earthquakes
and Extended Data 3). We validate the simulated lengths of the              occurred in Indonesia and resulted in casualties ranging from 1000
simulated global pubic interest during the 17 earthquakes by com-           to 5000. However, less than 25% of the population in Indonesia had
paring the observed lengths from the daily Google Trends data (dots         an Internet access before 2016 that provides crucial information
in Fig. 3c). Results show that the estimated memory lengths capture         during these events, which indicates that Indonesia’s severe vul-
well the general pattern of global interest in earthquakes during the       nerability to earthquake-related deaths stems from a combination of
17 earthquakes. The extended datasets have been made publicly               physical exposure and insufficient economic resources and public
available in the Havard Dataverse repository (Kam, 2021).                   interest over around the world (HHI, 2010; McCloskey et al., 2005;
                                                                            Siagian et al., 2014). China experienced two deadly earthquakes in
                                                                            2008 (87,000 deaths) and 2010 (2200 deaths), and only 23% and
Methods: Mapping the global network of public interest in                   34% of the country’s population, respectively, had an Internet access
earthquake                                                                  during these events.
To identify which countries are more sensitive to global earth-                The initial GSAVs on the occurrence dates of the seven
quake events than other countries, we compute out-degree for                deadliest earthquakes ranged 40–514, and moreover, these
each country from the global network of national public interest            earthquakes in Indonesia and China received very limited cov-
in earthquakes. The out-degree is defined as the number of                   erage of mass media and the lack of available information (see
connections that originate at a departure node (that is, infor-             Table 2). Based on these findings, we speculate that limited
mation seeking, but not affected, nations such as green dots in             information about these earthquakes by mass and social media is
Fig. 4) and point outward to a destination node (that is, affected          likely one of the barriers of securing timely assistance, possibly
nations such as black, blue, or red dots in Fig. 4). For efficient           resulting in additional casualties. Further studies about the role of
visualization, we choose the nine departure nodes with the                  mass and social media in the association between global public
threshold value of out-degree as 10 and find a weak impact of the            interest and timely assistance are necessary to improve the cur-
threshold value on the results (see Figs. S2 and S3). In this study,        rent international strategies for earthquake relief and response.
the network is constructed using the NetworkX Python library                   In contrast, the initial GSAVs on the occurrence dates of the
and Gephi, an exploratory graph data analytics tool.                        other (seven) most recognized earthquakes (red dots in Fig. 1)
                                                                            ranged from 750 (from at least eight nations since the maximum
Results: Inconsistency between the deadliest and most                       of national search activity volume is 100) to 1,800 (18 nations),
recognized earthquakes                                                      respectively, and casualties ranged from one to slightly over 600.
Based on the weighted daily Google Trends and NGDC/WDS                      The nations that experienced these seven most recognized
data, we identify the 10 deadliest earthquakes based on reported            earthquakes have high GDPs per capita, ranging from US $11,000
casualties (Table 1) and the 10 most recognized earthquakes                 to $65,000, and more than half of their populations had an
based on the ranks of the global search activity volumes (the sums          Internet access (52–87%) while information search activities have
of the national-level search activity volumes from the 62 nations;          been lately increased during the occurrence of an earthquake (see
Table 2). Results show only three earthquakes (black dots in Fig.           Table 2). The result indicates that the social infrastructure for the
1) are found in both top 10 lists: the 2010 Haiti Earthquake, the           Internet and economic development may be among the driving
2011 Japan Earthquake, and the 2015 Nepal Earthquake while                  forces of the lack of global interest in earthquakes that occurred in
Seven earthquakes are found in the list of the top 10 deadliest             developing countries, possibly resulting in inconsistency between
(blue dots in Fig. 1) and most recognized earthquakes (red dots),           the lists of the deadliest and most recognized earthquakes.
respectively. The magnitudes of the 17 earthquakes range from                  Results show that the socio-economic development of the
seven to nine on the Richter scale.                                         affected nations can influence initial GSAVs and their decay rates
   The nations that experienced the deadliest earthquakes all have          differently. Nations with higher GDPs per capita affected by an
low per capita GDPs ranging from the US $3,000 to $12,000 in the            earthquake evince greater levels of initial GSAVs per death
2010 US dollar value (blue dots in Fig. 1), highlighting that low           (Fig. 3a) while they show a higher decay rate of GSVAs over time
economic development can exacerbate the societal consequences               (Fig. 3b). That is, the global community is more sensitive to the

4                           HUMANITIES AND SOCIAL SCIENCES COMMUNICATIONS | (2021)8:242 | https://doi.org/10.1057/s41599-021-00914-7
HUMANITIES AND SOCIAL SCIENCES COMMUNICATIONS | https://doi.org/10.1057/s41599-021-00914-7 ARTICLE
Fig. 3 Sensitivity of simulated global interest in earthquake to casualties and socioeconomic development. In (a) and (b), black solid lines represent the
level of global interest per death (initial global SAV divided by the casualties of the corresponding earthquake) and decay rates of global interest in
earthquake estimated by the equations (non-linear and linear in (a) and (b), respectively). In (c), black contour lines depict the memory length of simulated
global interest in “hypothetical” earthquakes with a range of casualties (10–1,000 deaths) and per capita GDP (5,000–50,000). Dots depict the observed
memory lengths of GSAVs of the 17 earthquakes.
emergence of an earthquake in economically developed nations window of opportunities to obtain international aid for
than in developing countries while the global public interest in earthquake relief and response.
the former is decreased more quickly than that in the latter. Lastly, we construct a global network map of national public
interest in earthquakes that highlights 9 out of the total 62
Results: The Western dominance of global interest in nations that have not been affected by earthquakes but reveal a
earthquake high level of search activities during the occurrences of
Using data-driven models for global public interest, we con- earthquakes elsewhere. (green dots in Fig. 4). The surprising
struct per capita GDP–death–memory length contours (Fig. finding is that the highest public interest emerges in countries
3c). We find that earthquakes in nations with low and high per characterized by a low seismic hazard, according to the Global
capita GDPs (below US$10,000/above US$30,000) generated Earthquake Model (GEM)-Seismic Hazard Map (Pagani et al.,
global social memory lengths of less than one week with a weak 2018). Thus, these Western nations, namely Australia, Bel-
influence from casualties. In contrast, earthquakes in nations gium, Brazil, Denmark, France, Netherlands, Spain, Switzer-
with mid-range per capita GDPs (between US$10,000 and US land, and the United Kingdom, can drive the dynamics of
$30,000) generated a relatively wider range of global social global public interest in earthquakes despite their distance
memory concerning the resulting deaths. Overall, the interest from the epicenters. This Western dominance of global public
in earthquakes of the global community persists for less than interest in earthquakes is likely responsible for the unequal
two weeks regardless of the socio-economic development level attention to earthquakes occurring in developing vs. developed
of the affected nation, which we can consider a “golden” time nations.
HUMANITIES AND SOCIAL SCIENCES COMMUNICATIONS | (2021)8:242 | https://doi.org/10.1057/s41599-021-00914-7 5ARTICLE HUMANITIES AND SOCIAL SCIENCES COMMUNICATIONS | https://doi.org/10.1057/s41599-021-00914-7 Fig. 4 Dominance of the Western world’s contribution to global public interest in the earthquake. In (a), green dots (departure edges) depict unaffected nations with an out-degree over 10, and black, blue, and red dots (destination edges) depict the epicenters of the three most recognized and deadliest earthquakes, the seven deadliest earthquakes, and the seven most recognized earthquakes, respectively. The thickness of the outward arrows from the unaffected nations represents their SAVs. The dotted boxes in (a) are magnified in (b). Discussion: Potential role of Western countries vicarious experiences, such as reports by relatives/others or media The current findings indicate that we can leverage Western coverage (Becker et al., 2017). The findings highlight the countries to spread public interest in earthquakes and increase importance of the ethical role of developed nations in securing awareness of the serious consequences of earthquakes on devel- timely assistance for earthquake relief in developing nations. oping countries. Eventually, it can enhance the effectiveness of According to Google Trends, search activity volumes about international aid and relief efforts. The findings show a different earthquake and donation are positively correlated over dynamic pattern from analyzing natural disaster news coverage of 2004–2019 (the temporal correlation is above 0.5; see Extended mass media that revealed great distance bias (i.e., low degree of Data 4), indicating a potential opportunity to increase donations, coverage when disasters occur in a remote area (Berlemann and charities, and aid resources. Therefore, humanitarian organiza- Thomas, 2019)). Unaffected countries’ interest is often influenced tions should leverage publicly available big data, such as Google by the occurrence of earthquakes in neighboring countries and Trends and Twitter, as a monitoring tool of global public interest 6 HUMANITIES AND SOCIAL SCIENCES COMMUNICATIONS | (2021)8:242 | https://doi.org/10.1057/s41599-021-00914-7
HUMANITIES AND SOCIAL SCIENCES COMMUNICATIONS | https://doi.org/10.1057/s41599-021-00914-7 ARTICLE
Table 1 Information for the selected 17 earthquakes.
Type Year Month Day Tsu Latitude Longitude Mag Deaths Injuries Damage Country
B 2005 3 28 1 2.085 97.108 8.6 1303 340 – Indonesia
B 2005 10 8 0 34.539 73.588 7.6 76213 146599 6680 Pakistan
B 2006 5 26 0 −7.961 110.446 6.3 5749 38568 3100 Indonesia
B 2008 5 12 1 31.002 103.322 7.9 87652 374171 86000 China
B 2009 9 30 1 −0.72 99.867 7.5 1117 1214 2200 Indonesia
C 2010 1 13 1 18.457 −72.533 7 316000 30000 8000 Haiti
A 2010 2 27 1 −36.122 −72.898 8.8 402 12000 30000 Chile
B 2010 4 13 0 33.165 96.548 6.9 2220 12135 500 China
C 2011 3 11 1 38.297 142.372 9.1 1475 6157 220085.456 Japan
C 2015 4 25 0 28.231 84.731 7.8 8200 17866 10000 Nepal
A 2015 9 17 1 −31.573 −71.674 8.3 7 14 600 Chile
A 2016 4 17 1 0.35 −80.16 7.8 663 6274 3300 Ecuador
A 2016 8 24 0 42.704 13.238 6.2 299 368 5000 Italy
A 2017 9 20 1 18.339 −98.68 7.1 369 6000 8000 Mexico
B 2018 9 28 1 −0.178 119.84 7.5 4340 10679 1500 Indonesia
A 2019 5 26 0 −5.796 −75.298 8 2 30 – Peru
A 2019 7 4 0 35.766 −117.605 6.4 1 – – USA
The earthquakes in Types A–C are the seven deadliest earthquakes, seven most recognized earthquakes, and three deadliest and most recognized earthquakes, respectively.
Table 2 Information for socioeconomic indicators during the selected 17 earthquakes.
Type Year Month Day Initial Wiki GDP Country Internet users Google Alpha (α) Memory
Global SAVs per capita Search (ten length [days]
thousands)
B 2005 3 28 95.6491 N/A 2524 Indonesia 3.6 0.808 0.658 1
B 2005 10 8 210.332 N/A 937 Pakistan 6.3 1.35 0.125 1
B 2006 5 26 40.2914 N/A 2628 Indonesia 4.7 1.36 0.258 1
B 2008 5 12 512.132 N/A 3797 China 22.6 2.43 0.187 2
B 2009 9 30 177.881 N/A 2979 Indonesia 7 2.9 0.21 1
C 2010 1 13 818.282 N/A 665 Haiti 8.4 4.29 0.243 12
A 2010 2 27 821.983 N/A 12,808 Chile 45 3.83 0.258 7
B 2010 4 13 47.0828 N/A 4550 China 34.3 4.04 0.223 1
C 2011 3 11 3614.04 N/A 44,538 Japan 79 9.48 0.554 11
C 2015 4 25 1168.66 N/A 732 Nepal 17.5 14.1 0.354 8
A 2015 9 17 750.723 10,944 22,688 Chile 76.6 14.3 1.353 2
A 2016 4 17 1171.92 13,166 5176 Ecuador 54 13.9 0.557 5
A 2016 8 24 1292.72 16,990 34,459 Italy 61 13.1 0.928 4
A 2017 9 20 1804.93 19,580 10,301 Mexico 64 23.5 0.841 6
B 2018 9 28 254.606 4576 4284 Indonesia 40 21.8 0.138 3
A 2019 5 26 777.919 5491 6486 Peru 52 27.7 0.328 2
A 2019 7 6 750.042 32,672 55670 USA 87 376 1.441 2
The Google Search data were retrieved using the advanced search option specifying the occurrence date of an earthquake in Google web search engine (see Fig. S4). Memory lengths were counted from
the number of days when the initial GSAV is ≥100 (see External Database S3).
in earthquakes by country and over time following the earth- information seeking around the world, by harnessing multiple
quake, to raise fundraising and aid resources efficiently. Such big data sources. The latter finding of the role of Western nations can
data will help arrange ad hoc information and communication be explained by long-understood conditions accruing from socio-
campaigns almost in real-time with spikes of online search economic development; whereas people living in societies within
activity, thus promptly capturing the potential interest of donors, less developed economies are constrained to considerations of
particularly from citizens of Western nations. It will also prevent immediate basic needs, those living in more prosperous nations
public interest from “watering down” due to the passing of time. have more opportunity to pursue knowledge for self-
In addition, policymakers and stakeholders can use the two-week actualization. Nonetheless, our results show that the social
“golden” time window as a “Trojan horse” to involve more people response to earthquakes varies even in developed countries.
in earthquake preparedness, including mitigation action recovery Considering the complexity of social dynamics at the global
tools, and efforts to alleviate damage (Dowrick, 2003; Gizzi et al., level and the intrinsic singularity of an earthquake, other infor-
2020; Nigg, 2000; Spittal et al., 2008). mation such as the proximity of the earthquake’s epicenter to
other countries, the number of available information transfer
channels, and the public’s education level may also have an
Conclusions explanatory power for the dynamics of global pubic interest in
This study demonstrates evidence of inequalities in global public earthquakes. Still, the findings of this study suggest the utility of
interest in earthquakes and highlights the dominancy of Western big data for solving the “hierarchy of global suffering” from
nations in contributing to the observed behavior patterns of natural disasters (Joye, 2009) and emphasize the importance of
HUMANITIES AND SOCIAL SCIENCES COMMUNICATIONS | (2021)8:242 | https://doi.org/10.1057/s41599-021-00914-7 7ARTICLE HUMANITIES AND SOCIAL SCIENCES COMMUNICATIONS | https://doi.org/10.1057/s41599-021-00914-7
inclusiveness in earthquake relief and mitigation. Lastly, the Merz B, Kuhlicke C, Kunz M, Pittore M, Babeyko A, Bresch DN, Domeisen DI,
findings of this study encourage the global community to have a Feser F, Koszalka I, Kreibich H (2020) Impact forecasting to support
balanced interest in earthquakes and focus on soliciting aid emergency management of natural hazards. Rev Geophys
58:e2020RG000704
during the first 2 weeks following an earthquake in order to Moeller SD (2006) “Regarding the pain of others”: media, bias and the coverage of
maximize the effectiveness of recovery aid and efforts. international disasters. J Int Affairs 50:173–196
Nagendra NP, Narayanamurthy G, Moser R (2020) Management of humanitarian
Data availability relief operations using satellite big data analytics: the case of Kerala floods.
Ann Oper Res 1–26. https://doi.org/10.1007/s10479-020-03593-w
The datasets analyzed in this study are available in the Dataverse NGDC/WDS (2019) National Geophysical Data Center/World Data Service.
repository: https://doi.org/10.7910/DVN/83UZ9X. NOAA, National Centers for Environmental Information.
Nigg J (2000) Predicting earthquakes: science, pseudoscience, and public policy
Received: 20 January 2021; Accepted: 27 September 2021; paradox. Prediction: science, decision making, and the future of nature.
Island Press, Covelo, pp. 135–156
Pagani M, Garcia-Pelaez J, Gee R, Johnson K, Poggi V, Styron R, Weatherill G,
Simionato M, Viganò D, Danciu L (2018) Global Earthquake Model (GEM)
Seismic hazard map (version 2018.1–December 2018). https://doi.org/
10.13117/GEM-GLOBAL-SEISMIC-RISK-MAP-2018
Poel M, Meyer ET, Schroeder R (2018) Big data for policymaking: great expecta-
References tions, but with limited progress? Policy Internet 10(3):347–367
Azevedo JP (2011) “WBOPENDATA: Stata module to access World Bank data- Russell TE (2005) The humanitarian relief supply chain: analysis of the 2004
bases”, Statistical Software Components S457234, Boston College Department South East Asia earthquake and tsunami. Massachusetts Institute of
of Economics. http://ideas.repec.org/c/boc/bocode/s457234.html Technology.
Becker JS, Paton D, Johnston DM, Ronan KR, McClure J (2017) The role of prior Sano Y, Yamada K, Watanabe H, Takayasu H, Takayasu M (2013) Empirical
experience in informing and motivating earthquake preparedness. Int J analysis of collective human behavior for extraordinary events in the blo-
Disaster Risk Reduct 22:179–193 gosphere. Phys Rev E 87(1):012805
Berlemann M, Thomas T (2019) The distance bias in natural disaster reporting— Siagian TH, Purhadi P, Suhartono S, Ritonga H (2014) Social vulnerability to
empirical evidence for the United States. Appl Econ Lett 26(12):1026–1032 natural hazards in Indonesia: driving factors and policy implications. Nat
Besiou M, Stapleton O, Van Wassenhove LN (2011) System dynamics for huma- Hazards 70(2):1603–1617
nitarian operations. J Humanit Logist Supply Chain Manag. 1:78–103 Spittal MJ, McClure J, Siegert RJ, Walkey FH (2008) Predictors of two types of
Carneiro HA, Mylonakis E (2009) Google trends: a web-based tool for real-time earthquake preparation: survival activities and mitigation activities. Environ
surveillance of disease outbreaks. Clin Infect Dis 49(10):1557–1564 Behav 40(6):798–817
Cénat JM, McIntee S-E, Blais-Rochette C (2020) Symptoms of posttraumatic stress Tan YJ, Maharjan R (2018) What googling trends tell us about public interest in
disorder, depression, anxiety and other mental health problems following the earthquakes. Seismol Res Lett 89(2A):653–657
2010 earthquake in Haiti: a systematic review and meta-analysis. J Affect Thompson JJ, Wilby RL, Matthews T, Murphy C (2021) The utility of Google
Disord. 273:55–85 Trends as a tool for evaluating flooding in data-scarce places. Area 1–10.
Choi H, Varian H (2012) Predicting the present with Google Trends. Econ Rec 88:2–9 https://doi.org/10.1111/area.12719
Chouliaraki L (2006) The spectatorship of suffering. Sage. Van Wassenhove LN (2006) Humanitarian aid logistics: supply chain management
Cottle S (2013) Journalists witnessing disaster. Journal Stud 14(2):232–248 in high gear. J Oper Res Soc 57(5):475–489
Cottle S (2014) Rethinking media and disasters in a global age: what’s changed and Wikipedia (2020) Earthquake, Retreived on July, 30, 2020 from https://
why it matters. Media War Conflict 7(1):3–22 en.wikipedia.org/wiki/Earthquake
Dahlberg L (2001) Democracy via cyberspace: mapping the rhetorics and practices Xu J, Wei Y (2013) Social support as a moderator of the relationship between
of three prominent camps. New Media Soc 3(2):157–177 anxiety and depression: an empirical study with adult survivors of Wenchuan
Dowrick DJ (2003) Earthquake risk reduction actions for New Zealand. Bull N Z earthquake. PLoS ONE 8(10):e79045
Soc Earthq Eng 36(4):249–259
Earle P (2010) Earthquake twitter. Nat Geosci 3(4):221–222
Gao H, Barbier G, Goolsby R (2011) Harnessing the crowdsourcing power of social Acknowledgements
media for disaster relief. IEEE Intell Syst 26(3):10–14 We thank NOAA National Centers for Environmental Information, Google Trends,
Gizzi FT, Kam J, Porrini D (2020) Time windows of opportunities to fight and Wikipedia for making available the historical earthquake, search engine query
earthquake under-insurance: evidence from Google Trends. Humanit Soc Sci data, and daily view data, respectively. JK was partially supported by the Basic
Commun 7(1):1–11 Research Program through the National Research Foundation of Korea(NRF) funded
Gonzales P, Ajami N (2017) Social and structural patterns of drought‐related water by the MSIT(NRF-2020R1A4A101881812). JP and Y-JS were supported by the
conservation and rebound. Water Resour Res 53(12):10619–10634 Institute of Information & communications Technology Planning & Evaluation
Gunn III JF, Lester D (2013) Using google searches on the internet to monitor (IITP) grant (No. 2019-0-01906, Artificial Intelligence Graduate School Pro-
suicidal behavior. J Affect Disord 148(2–3):411–412 gram(POSTECH)). WS was supported by the National Academies of Sciences,
HHI (2010) Disaster Relief 2.0: The future of information sharing in humanitarian Engineering, and Medicine Gulf Research Program (grant 2000010990).
emergencies. HHI, pp. 72–72.
Hogg D, Kingham S, Wilson TM, Griffin E, Ardagh M (2014) Geographic variation
of clinically diagnosed mood and anxiety disorders in Christchurch after the Author contributions
2010/11 earthquakes. Health Place 30:270–278 JK conceived this manuscript, JK, JP, and JS compiled the data, conducted the data
Joye S (2009) The hierarchy of global suffering: a critical discourse analysis of analysis, and produced the figures. JK and JP interpreted the results of the data analysis.
television news reporting on foreign natural disasters. J Int Commun JK mainly wrote the manuscript and all the authors equally contributed to discussion and
15(2):45–61 writing.
Kam J (2021) Replication data for: data-driven modeling reveals the Western
dominance of global pubic interest in earthquakes. Harvard Dataverse. Competing interests
Kam J, Stowers K, Kim S (2019) Monitoring of drought awareness from google The authors declare no competing interests.
trends: a case study of the 2011–17 California drought. Weather Clim Soc
11(2):419–429
Kim S, Shao W, Kam J (2019) Spatiotemporal patterns of US drought awareness. Additional information
Palgrave Commun 5(1):1–9 Supplementary information The online version contains supplementary material
Martin JA (2013) Disasters and donations: the conditional effects of news attention available at https://doi.org/10.1057/s41599-021-00914-7.
on charitable giving. Int J Public Opinion Res 25(4):547–560
Maya-Mondragón J, Sanchez-Roman FR, Palma-Zarco A, Aguilar-Soto M, Borja- Correspondence and requests for materials should be addressed to Jonghun Kam.
Aburto VH (2019) Prevalence of post-traumatic stress disorder and depres-
sion after the September 19th, 2017 earthquake in Mexico. Arch Med Res Reprints and permission information is available at http://www.nature.com/reprints
50(8):502–508
McCloskey J, Nalbant SS, Steacy S (2005) Earthquake risk from co-seismic stress. Publisher’s note Springer Nature remains neutral with regard to jurisdictional claims in
Nature 434(7031):291–291 published maps and institutional affiliations.
8 HUMANITIES AND SOCIAL SCIENCES COMMUNICATIONS | (2021)8:242 | https://doi.org/10.1057/s41599-021-00914-7HUMANITIES AND SOCIAL SCIENCES COMMUNICATIONS | https://doi.org/10.1057/s41599-021-00914-7 ARTICLE
Open Access This article is licensed under a Creative Commons
Attribution 4.0 International License, which permits use, sharing,
adaptation, distribution and reproduction in any medium or format, as long as you give
appropriate credit to the original author(s) and the source, provide a link to the Creative
Commons license, and indicate if changes were made. The images or other third party
material in this article are included in the article’s Creative Commons license, unless
indicated otherwise in a credit line to the material. If material is not included in the
article’s Creative Commons license and your intended use is not permitted by statutory
regulation or exceeds the permitted use, you will need to obtain permission directly from
the copyright holder. To view a copy of this license, visit http://creativecommons.org/
licenses/by/4.0/.
© The Author(s) 2021
HUMANITIES AND SOCIAL SCIENCES COMMUNICATIONS | (2021)8:242 | https://doi.org/10.1057/s41599-021-00914-7 9You can also read