Degree Project Level: Master's
←
→
Page content transcription
If your browser does not render page correctly, please read the page content below
Degree Project
Level: Master’s
CO2-efficient retail locations: Building a web-based
DSS by the Waterfall Methodology

Author: Julateh K. Mulbah & Tilahun Gebreslassie Kahsay
Supervisor: Kenneth Carling, Xiaoyun Zhao
Examiner: Moudud Alam
Subject/main field of study: Microdata Analysis
Course code: MI4001
Credits: 30 ECTS
Date of examination: June 09,2021

 At Dalarna University it is possible to publish the student thesis in full text in DiVA.
 The publishing is open access, which means the work will be freely accessible to read
 and download on the internet. This will significantly increase the dissemination and
 visibility of the student thesis.
 Open access is becoming the standard route for spreading scientific and academic
 information on the internet. Dalarna University recommends that both researchers as
 well as students publish their work open access.
 I give my/we give our consent for full text publishing (freely accessible on the internet,
 open access):
 Yes ☒ No ☐

 Dalarna University – SE-791 88 Falun – Phone +4623-77 80 00
Abstract:
Several studies have been carryout on finding optimal locations to minimize CO2
emissions from the last mile distribution perspective. In conjunction with that, there
has been no study conducted in Sweden that provides a decision support system to
compute the transport consequences of the modifications in the retailer’s store
network. This thesis did used the following steps: requirement analysis, system
design, implementation and testing to build a prototype decision support system that
is to help retailers find optimal locations for a new retail store. This thesis provided
a subsequent answer as to which data are needed along with the rightful user
interface for said decision support system. Subsequently, this thesis does present a
decision support system prototype from which some recommendations were
provided as to what skills set and tools are needed for the management and
maintenance of said decision support system. The primary data used during this
thesis is the Dalarna municipalities, six selected retailer’s stores networks and the
Dalarna Road network geo-data (Longitude and latitude). This thesis does conclude
that it is possible to integrate an optimization model within the Django framework
using a geo data to build a decision support system.

Keywords: Optimal location, Statistical modeling, Web development and P-
median model

 i
Acknowledgements:
We like to express appreciation to all those who supported us in this thesis
development from the inception up to the final presentation. We humbly thank our
supervisors: Kenneth Carling and Xiaoyun Zhao for their undeniable support and
guidance.

 ii

Table of Contents:
Abstract: .............................................................................................................................................. i
Acknowledgements: ........................................................................................................................... ii
List of Figures: .................................................................................................................................. iv
List of Tables: ................................................................................................................................... iv
List of Equations: .............................................................................................................................. iv
1: Introduction .................................................................................................................................... 1
 1.1 Research Background ............................................................................................................... 1
 1.2 General Research Problem and Research Goal ........................................................................ 2
 1.3 Research Objective and Research Questions............................................................................ 3
 1.4 The Scope of the thesis............................................................................................................. 4
 1.5 Research Disposition ................................................................................................................ 4
2: Related work and derived insights ................................................................................................. 6
3: Methodology, input data, methods, and software tools .................................................................. 9
 3.1 Description of Empirical Data and Study Population............................................................... 9
 3.1.0 Data Source Description ........................................................................... 9
 3.1.1 Study Population and Data ....................................................................... 9
 3.1.2 The Borlange Residence Volunteer Data ............................................... 12
 3.2 Methodology and Methods ..................................................................................................... 13
 3.2.0 System Design and Model Formulations ............................................... 15
 3.2.1 Model Formulation ................................................................................. 15
 3.2.2 Model Interpretation ............................................................................... 17
 3.2.3 Emission Based P-median Method......................................................... 17
 3.3 DSS Implementation .............................................................................................................. 19
4: Data quality and processing ......................................................................................................... 23
 4.1 Data Pre-processing................................................................................................................ 23
5: An illustration of the prototype of the DSS .................................................................................. 26
6: Thesis discussion and future work ............................................................................................... 31
7: Limitations ................................................................................................................................... 33
8: Conclusions .................................................................................................................................. 34
References ........................................................................................................................................ 35
Appendix .......................................................................................................................................... 38
 Appendix A: The Registration Form for Retailers ....................................................................... 38
 Appendix C: Finding optimal location. ........................................................................................ 38
 Appendix D Result from finding optimal location using the DSS. .............................................. 39
 Appendix E System Architecture ................................................................................................. 40
 Appendix F A link to a short presentation of the prototype DSS ................................................. 40

 iii

List of Figures:

Figure 1 -------------------------------------------------------------------------------------------------------- 11
Figure 2 -------------------------------------------------------------------------------------------------------- 12
Figure 3--------------------------------------------------------------------------------------------------------- 19
Figure 4 --------------------------------------------------------------------------------------------------------- 24
Figure 5 -------------------------------------------------------------------------------------------------------- -25
Figure 6 --------------------------------------------------------------------------------------------------------- 26
Figure 7 --------------------------------------------------------------------------------------------------------- 28
Figure 8 ---------------------------------------------------------------------------------------------------------29
Figure 9 --------------------------------------------------------------------------------------------------------- 30

List of Tables:
Table 1---------------------------------------------------------------------------------------------------------- 9
Table 2--------------------------------------------------------------------------------------------------------- 14
Table 3---------------------------------------------------------------------------------------------------------16
Table 4--------------------------------------------------------------------------------------------------------- 18
Table 5---------------------------------------------------------------------------------------------------------20
Table 6------------------------------------------------------------------------------------------------------- 27-28

List of Equations:
Equation 1------------------------------------------------------------------------------------------------------16
Equation 2------------------------------------------------------------------------------------------------------16
Equation 3------------------------------------------------------------------------------------------------------16
Equation 4------------------------------------------------------------------------------------------------------16
Equation 5------------------------------------------------------------------------------------------------------ 17
Equation 6------------------------------------------------------------------------------------------------------ 17
Equation 7------------------------------------------------------------------------------------------------------ 17

 iv
1: Introduction
1.1 Research Background

The International Energy Agency (IEA), in 2009 stated that the growing global
urbanization is expected to have a ratio of 66% by 2050. This ratio will increase
transport energy use and carbon dioxide (hereafter CO2) emissions by nearly 50%
in the year 2030 and more than 80% by 2050 (Zhao et al., 2016). CO2 is a key
greenhouse gas that is contributing to climate change and global warming. In recent
years, a lot of attention has been drawn to the impact of CO2-emitted by the transport
specifically for retail (Archer et al., 2018). Since CO2 emissions are not
environmentally friendly, there have been series of measures taken to help reduce
the amount of CO2-emitted like the introduction of the Carbon tax in 199l in Sweden
(Daunfeldt et al., 2009). This carbon tax started at a rate equivalent to today’s
Swedish krona 250kr, per ton of fossil CO2 emitted but now in 2020, the tax rate is
now SEK 1190 (Daunfeldt et al., 2009). Another strategy introduced by authorities
to reduce transport-related CO2 emissions is the congestion charges implemented in
Stockholm and Gothenburg in 2007 and 2013 (Daunfeldt et al., 2013). However,
business owners feared and expressed concerns that the introduction of the charges
might negatively affect their sales. On the contrary a research conducted found out
that the congestion charges instead had a positive environmental effect, while there
was no substantial evidence to back up these claims that these congestion charges
did reduce their sales (Daunfeldt et al., 2013).

The need for new technologies, fuels, and smart urban development are two main
area of focus to intervene in the reduction of global energy-related CO2 by 50% from
the predicted level in 2050 (Zhao et al., 2016). The problems with strategies like the
direct regulations, promotion of green fuels, and modification of travel behaviour
require a long time to be adhered to. In return, it become ineffective for the reduction
in retailing CO2-emission on a larger scale (Carling et al., 2013).

This thesis does fit into the said strategy of using new technologies to intervene in
the reduction of CO2 emitted from customer travel to and from a retail store.
According to research, using the optimal locations for retail chain stores and e-

 1
tailing outlets and good urban planning could lead to a more and fast reduction in
CO2 emission related to retailing (Carling et al., 2013, Zhao et al., 2019).

1.2 General Research Problem and Research Goal

Regardless of all the efforts to reduce CO2 emissions from goods reaching the
customer (last-mile distribution, it has still been influenced by consumer own,
environmentally not so efficient private car transportation. This causes the last-mile
delivery to be the most expensive and inefficient when it comes to the entire delivery
process (Vanelslander et al., 2013). A case study conducted in the Dalarna region
confirmed a 22% reduction in CO2 emission can be achieved if stores had been
located at their optimal location from a CO2 emission standpoint (Carling et al.,
2013).

From all the current research conducted within the field of location science
specifically in Sweden, none of these studies have researched on how a web-based
decision support system (hereafter, DSS) can be developed using a sequential
methodology like the waterfall methodology. A DSS that does provide retailers the
means to automatically find optimal locations for their stores within their store
network. As well as considering the average distance from the customers to a retail
store. Specifically, when a retailer considers relocating, add a store to their network.

Presently, whenever a retailer is about to modify its store network, (s)he must hire a
consultant to do the location optimization. Most times the optimization models used
by the consultants are only useful for that time. Furthermore, these processes are not
automated making the consultant to redo the entire process all over.

The goal of this thesis is to develop a prototype Web-based DSS for retailers, where
the core components will be a user interface and toolkits running in the background
to execute the computing of the transport consequences of a modification in the
retailer’s network of stores. This prototype is to provide an answer to our research
goal as to how can a waterfall methodology can be used to develop the said DSS for
finding optimal location with regards to distance.
The next section will provide the necessary objectives needed to achieve the stated
goal and the necessary questions to be asked to provide the right solution to this
thesis goal and the overall research question.

 2
1.3 Research Objective and Research Questions

This thesis’s contribution to knowledge is to provide findings from the investigation
of using a sequential methodology to build a prototyped DSS. To provide an
empirical answer to the said investigation of this thesis, a thorough review of related
work was done to derived insights. These insights were used to provide us answers
to the above-mentioned investigation. Furthermore, a solution to the said
investigation the below-listed objectives were derived:

 a) To identify the data needed, its availability compatibility, and combination.

 b) To identify the user interface needed this means the type of information,
 access, and visualization.

 c) To identify the methodologies and models needed in the background toolkit
 of the above-mentioned DSS.

 d) To identify the needed tools and skills set for the management and
 maintenance of the above-mentioned system.

In this thesis we did use a sequential methodology similar to the waterfall
methodology that did included the requirement analysis step to provide an answer
to objective a) and objective b). Furthermore, the system design step does allow for
the provision of a solution to objective c) and finally the implementation step does
provide solution to objective c) and d). from these stated objectives this thesis does
provide a solution to our thesis objectives and the thesis goal. The only difference
between this thesis sequential methodology and the waterfall methodology is the
Deployment phase where this thesis was unable to cover because of time constraint.

Once there are solutions to these objectives a prototype was developed and tested.
The lessons learned along with insights from this thesis work will then be used as
guidance and foundation for further developments of the said Web-based DSS.
Stakeholders to benefit from this thesis are Retailers interested in opening or
relocating their stores for better accessibility. Also, authorities interested in
decreasing CO2-emissions induced in last-mile delivery, and lastly for consumers
who want to minimize the need for last-mile transport.

 3
1.4 The Scope of the thesis

Holistically defining optimal location will not be considered; instead, the optimal
location referred to locations that minimize CO2 emission from consumer travel
(Carling et al., 2013). A location could be considered optimal for a couple of reasons
from both the retailers and consumers perspectives and even the urban planners that
would not necessarily reduce CO2 emissions. This thesis focuses on knowing how
the Waterfall Methodology can be used to develop a DSS meant for finding optimal
locations can help in the reduction of transport consequences with regards to CO2
emissions. This thesis is going to use the case study design to provide an answer to
the main research question and its subsequent questions drawn from the research
objectives.

The prototype is limited to the Dalarna Region instead of the entire Sweden. The
case study research design does allow for a researcher to only focus on an object of
phenomena (case) that which can be an individual or an organization (Baimyrzaeva,
2018). All the data used in this thesis came from a secondary source like the Google
Maps and Open Street Maps Services.

Due to time limitations for data integration and analysis, this thesis did focus
specifically on geocoded data of six selected retail stores network within the Dalarna
Region. Moreover, the focus of this thesis is on the transportations by private cars
whereby other possible means such as trains, bicycles, and airplane are neglected.
However, (Carling et al., 2015) noted that the average Swedish consumer travels 30
km for shopping semi durable and durables which suggested that private cars is the
predominant mode of transportation. This is because of time limitation and this
thesis did considered the Dalarna Region in Sweden to comprehensively provide
the most efficient solution using the available timeline.

1.5 Research Disposition

This thesis is divided into eight sections. Section 1 introduce the main research
problem, purpose, objectives, scope, and disposition of this thesis. Section 2
provides related works and derived insights that gives the reader a detailed
theoretical base for this thesis research question and the research problem. Section
3 discusses the methodology, input data, methods and software tools employed

 4
during this thesis. Section 4 does discuss data quality and processing. Section 5
comprises of the illustrations of the prototype of the DSS and comprises results from
the optimization model employed. Section 6 presents the thesis discussions and
outlines of potential directions for future work. Section 7 provides all the limitations
of this thesis along with most of the assumptions made, and it also discuss the
feasibility of relaxing these assumptions in future works. Section 8 does present the
conclusions of this study and its follow by the references and appendix.

 5
2: Related work and derived insights
A study conducted in 2016, proposed that an ex-ante evaluation method can be used
to quantify the impacts of CO2 emission induced by intra-urban car mobility based
on the different residential plans (Zhao et al., 2016). They found out the further away
residence live from a facility and need to drive to access it, the more CO2 (s)he will
emit. The study confirms that for intra-urban car mobility distance to directly affect
the amount of CO2 that is emitted from a customer travel to and from a facility (Zhao
et al., 2016). The study supports the conjecture that finding an optimal location with
the help of a DSS should help in the reduction of transport consequences with
regards to CO2 emitted from that customer travel to and from that facility. The
difference between that study and our thesis is that the former was focusing on any
facility that means it could be school, working places or a shopping mall whereas
our focus is on a store within a store network.

The study is also similar to our thesis because the researcher uses a case study
research design and an empirical method for data analysis. The study also differs
from our study in its findings because the researcher provided an ex-ant evaluation
method for quantifying the impact of CO2 emissions induced by intra-urban car
mobility. On the contrary our thesis is focus on investigating as to how a Waterfall
model can be used to build a prototyped DSS that can help retailers find optimal
locations for a store they might want to add to their existing stores network within
the Dalarna region. The study was selected for review because it does serve as a
basis for our CO2 model estimation because it shows that the further away a
customer lives from a retail store the more CO2 they will emit when travelling to and
from that store. From the study the researcher did conclude that apartment buildings
are more effective in meeting residential need and helping in the reduction of CO2
emission than a dispersed single-family home (Zhao et al., 2016).

Another study conducted in 2015 the research did implement a method to
empirically measure the difference in carbon footprint between traditional and
online retailing that requires data from the entry point to the customer residence
(Carling et al., 2015). The method implemented during this study uses the location
data on the brick-mortar stores, online delivery points and residences of the region
population along with the goods transportation network within the region. The

 6
choice of data during this study does provides an insight and an answer to our thesis
objective (a) that is which type of data are needed to build the above-mentioned
DSS. From this study the results indicated that the average distance travelled from
a consumer home to a brick-mortar store is 48.54 km whereas for distance to an
online delivery point is 6.7 km (Carling et al., 2015). This study does inform our
thesis by providing the current distance measure between a customer and a brick-
and- mortar store this provide the information on as how long it takes a customer to
travel to a retail store within the Dalarna region. This information also informs our
thesis as to how to calculate for a CO2 emission from a customer travel within the
Dalarna region. They concluded their study by stating that e-tailing on average
reduces its CO2 footprints by 84% when purchasing a standard electronics product
(Carling et al., 2015). The difference between this study and our thesis is that the
researcher was measuring and comparing the CO2 emission from a traditional brick-
and-mortar stores and e-tailing outlets, and they were not concern with optimization
of the locations.

A road network complexity does influence finding optimal locations. A study
conducted was able to find out that the an increase in complexity, up to a certain
level do improve the solution but once the complexity is beyond certain level it does
not improve the solution (Zhao et al., 2019). They also concluded this study with a
sensitivity analysis of the algorithms used and the number of facilities to further get
insight of the computation complexity and location problems from an intra-urban to
inter-urban (Zhao et al., 2019). This is one method that is explored in this thesis
because the analysis area of focus is the Dalarna region making it possible to work
with intra-urban and inter-urban mobility data for analysis.

According to a study conducted in 2012 shows that the Euclidean distance gives a
solution that is 2-7 percent worse than the network distances but due to time this
study does consider the Euclidean distance measure to compute origin
destination(hereafter OD) distance matrix (Carling et al., 2012). During this
research, they also validated that the solutions deteriorate with increasing (P) or the
number facilities when locating an optimal solution. From this analysis this thesis is
mostly considering the location of at most 2 stores, that which reduces possibility of
reducing the solutions of the model.

 7
It is very important to understand mobility pattern when solving location
optimization problems. A study conducted on mobility established that human
mobility pattern is the same as levy flight pattern this means humans moments are
random. The researcher also provided another factor to the agent-based model that
already had two factors making it three factors and then simulated results to confirm
their observations. The researcher did used GPS traces data of 258 volunteers so that
they can get a better understanding of both human mobility patterns and the
mechanism (Zhao et al., 2014). The analysis gathered during that research was
considered for analysis in this thesis just for an inference purpose.

One major difference from all the above-mentioned studies or research is the lack
of a research conducted on how can the Waterfall Methodology be used to build a
DSS meant for the above-mentioned task? Providing an empirical answer to the
above-mentioned questions makes this research different from all the research
conducted within the location science field of studies.

 8
3: Methodology, input data, methods, and software tools
3.1 Description of Empirical Data and Study Population

3.1.0 Data Source Description

This thesis used actual dataset from Statistics Sweden, Open Street Maps (hereafter
OSM), Open Street map network (hereafter OSMNX) and Google open maps.
Statistics Sweden is mainly responsible to supply users and customers with
statistical data for decision making, debate and research. Open Street Maps as its
name suggests it is an open-source project that allow for the creation of free editable
map of the world. The OSMNX is a python package to retrieve, model, analyse and
visualize street network from Open Street Map. This package allows for users to
download and model walkable, drivable, or bikeable urban network with just a line
of python code and these derived networks are easy to analyse and visualize. Google
map is also an open-source map that provides points data for locations and this
service is own and operated by Google.

3.1.1 Study Population and Data

The Dalarna region got a total population of 287,966 persons as of 2021 according
to statistics Sweden and this region occupy an area of 28,029km2., population
density of 10.26/km2 and its annual population change from 2010 to 2020 is 0.38%.
The region has 15 major municipalities and majority of the region population does
live around the capital Falun that now has a total of 59406 and the next most
populated municipality is Borlange that host the total of 52590 persons.
The five most populated municipalities along with their populations number are
summarized below in a Table 1.

Table 1 Population Summary of the Five Most populated Municipalities in Dalarna.

 Name of the Municipality Population in Thousands

 Falun 59406
 Borlange 52590
 Ludvika 26992
 Avesta 23323
 Mora 20470

 9
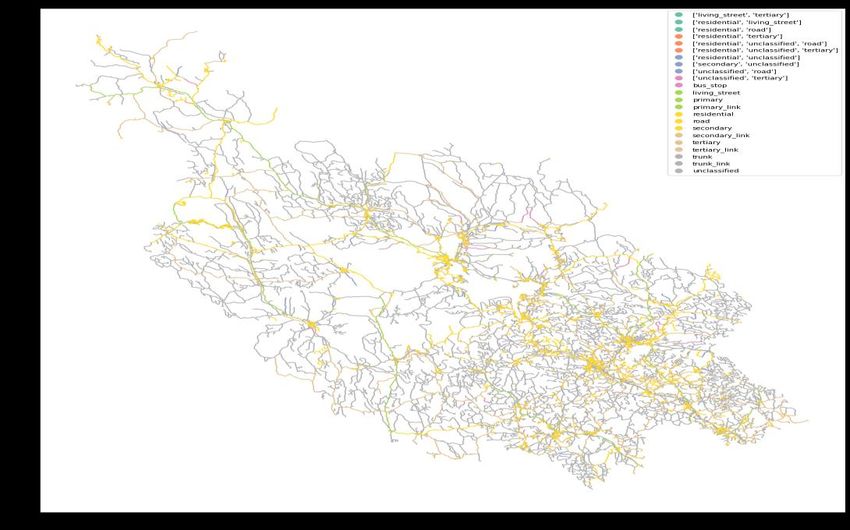
The Dalarna region was chosen for this study because of the many transport studies
that have been conducted within the region. Specifically the study conducted on the
measurement of CO2 emissions induced by online and brick-and-mortar retailing
along with many other studies (Carling et al., 2015). This study provided insight as
to the road network of the Region and the distribution routes use along with the
amount of CO2 that is been emitted by these customers travel to the bricks-and-
mortar store or the online purchase.

The Dalarna Road network was generated by the OSMX library before data cleaning
the Dalarna Street network which comprises of only drivable roads had a total node
of 32515 and of 7857 edges. A node can be referred to as geo points on a map
whereas the edges to refer to the links between these nodes.
The projection use for this road network data is the World Geodetic System 1984
(GS84) 34N for Sweden. To make sure that this data only consists of drivable roads
we converted the graph (nodes and edges) into a Geo Data frames this data does
comprises of 6544 observations and seven variables. This road data also consists of
761 roundabouts ,24 jug handle and 10 teardrops from the visualization of this road
network in Figure 1 most of the roundabout are in the southern part of the region.
The total road length of all the edges in the data is 40,422.300 Kilometres. The
highway column had the various types of roads considered in this network that
ranges from residential roads up to unclassified roads. Figure 1 is a visual
representation of the highway tags column of the road network data.

 10
Figure_ 1 The Dalarna Roads network based on the highway category.

From the above visualization of the Dalarna Road highway column category, most
of the road are roads within the residential areas. This does not mean that these
residential roads are the most important part of the road network because these roads
allow for customers to leave their neighbourhood and get onto the main roads to
travel to shopping areas or their various point of interest. The grey segment of this
road network depicts unclassified road, and these include both primary links and
some residential roads. The light-green segment of this road network represents the
primary links that connects the municipalities within the Region.

The retailer’s network data comprises of six different retailers stores locations
within the Dalarna region. These six different retailers do operate in the following
industries: food retail, clothing retail, general consumer goods and the wooden
furniture. These retailers are: Willys, Lidl, H&M, Biltema, RUSTA and IKEA. The
retailer location dataset consists of twenty-eight (28) individual chain of stores
owned and operated by the above mentioned six retailers. The Willy network in the
Dalarna region comprises of eight (7) stores. The next is the Rusta network within
the Dalarna region also has six (6) stores follow by Biltema network comprising of
three (3) automotive stores. Furthermore, Lidl also have seven (7) groceries store
within the Dalarna region while the H&M has four (4) clothing stores within the
region. Lastly IKEA has only a store in the region.

 11
Figure 2 provides a graphical representation of these 28 stores dispersion within the
 Dalarna region using a map generated by Folium a geo python library. The red info-
 sign icon represents Willys, the blue info-sign icons for Rusta, the green info-sign
 icons for Baltima, the red cloud icons for Lidl, the blue cloud icons for H&M and
 the green info-sign icon for Ikea. This data was extracted from google maps by
 using the name of these retail stores and searching within the Dalarna region. This
 data was generated to give us an insight as to where most of the store’s network are
 currently located within the Region and to understand as to if distance was
 considered during the onset of building these stores.
Longitude

 Latitude
 Figure 2 Pilot retail stores dispersion in Dalarna Region

 3.1.2 The Borlange Residence Volunteer Data

 The Borlange Residence Volunteer Dataset (Zhao et al., 2017), was used to provide
 inference on the general mobility behaviour of residence within the region since the
 Borlange municipality does host the second highest number of inhabitants within
 the region. Another reason for using the dataset is to help us make sensible
 assumptions of peoples travel behaviour in terms of their modes of transports and
 locations of stores within their localities. The data was gathered from a total of 316
 volunteers using a Bluetooth GPS device (Zhao et al., 2017). The dataset comprises
 of the 262,021 records of movements stored in 258 GPS logger files. The dataset
 had a total of 5402 invalid records that were removed during the data cleaning
 process, and these invalid data was due to the signal losses. The GPS signal

 12
comprises of each volunteer information on his or her whereabouts every 5 or 30
seconds specifically when a GPS signal was received. The data generated from the
GPS had the longitude(x) latitude (y) time(t) and velocity (v). The world Geodetic
system 84(WGS84) was used to reference longitude and latitude. The type of GPS
device used during this study measurement preciseness was 5m as claimed by the
user manual. Furthermore, the velocity unit of measurement is m/s. Analysis derived
from this dataset does confirms that people does travel randomly confirming the
levy flight research. It was from this study we made some of our assumptions and
limitations that will be explained at the latter part of this thesis.

3.2 Methodology and Methods

To provide an empirical investigation in this thesis , so the waterfall methodology
was employed to provide an answer to the research question providing answer as to
how this methodology can be employed to develop a web-based DSS for finding
optimal retail location. (Bassil, 2015). The waterfall methodology was chosen as the
appropriate methodology for this thesis because of the web development component
of this thesis and the sequential nature of this methodology. We would have used
another web development methodology like the Agile web/software development
methodology, but the Agile methodology could not fit our team size and the
structure of thesis (Murray, 2016). The Agile requires that the solution development
goes on regardless of unfinished task which is not appropriate for this thesis because
every step needs to be completed before moving to the next step. Since this is an
academic work, it is more appropriate to use the waterfall methodology because of
its sequential nature. Furthermore, the waterfall methodology does allow for the
software requirements, design, code or implementation, test and debug the software,
presentation of the finished product and lastly follow by the maintenance mode
(Murray, 2016). To practically demonstrates how the waterfall Methodology can be
used to develop a web-based DSS for finding optimal retail location we follow all
the sequential steps listed to develop this prototype DSS. The next parts of this
section are divided in the following parts depicting the sequential way of developing
the DSS and these ways are Requirement Analysis, System Design, Implementation,
Testing, Deployment and Maintenance.

 13
The Requirement Analysis step provides a detailed explanation on the system
analysis and design. A requirement analysis was administered at the beginning of
this thesis to ensure that this project meets all the above listed objectives.
Specifically in the development of a DSS that reduces distance travel by customer
from their homes to a retail store. As indicated earlier, the optimization of store
locations does reduce the amount of CO2 that is emitted from a customer travel to
and from a brick-and-mortar store(Carling et al., 2013). Our solution will provide
an answer to our thesis goal as to how a Waterfall methodology can be used to
develop a web-based DSS for finding optimal retail location..

After a numerous derivation of a functional and non-functional requirements the
selected ones were summarized, as displayed in Table 2. Since the non-functional
requirement is mostly used to help make the system simple, replicable, maintainable
and less time consuming for the system designer or basically more useable user
interface (Giri, 2010). The functional requirements and non-functional analysis
were summarized and placed in the Table 2. This table provides a summary of how
the data collection was carryout and identifying important attributes as indicators
necessary for the modelling. A geodatabase to host the available data provided from
different sources like retailers that will be using the DSS.

Table 2. System Requirement Design
 Nonfunctional Functional
 Simple, user-friendly, replicable, automated Model design and development
 Central storage unit (Data integration center) Geodatabase file design (Population distribution,
 stores locations, road networks and
 municipalities positions)
 Indicator’s identification Preprocessing Data

To provide an answer for objective (a) of our research at the system requirement
step we were able to identify the necessary data needed and its availability along
with its possible integration. From research the needed data are a geocoded data of
where people live in the region, the number of times they travel to the store and
along what routes they used, store locations and the road network. The available
data from the needed data were the geocoded data of the stores, road network and a
not so detailed data of where the Dalarna population live. This insight was then
transferred to the next step where we design the system and formulated the model.

 14
3.2.0 System Design and Model Formulations

The system design does handle the requirement specification that is from the first
phase to the last phase of the system design. The system design also helps with
specifying hardware and system requirement and helps with the definition of the
overall system architecture (Bassil, 2015). This system design also comprises of the
model’s formulations or the backend toolkit for this decision support system and it
user interface. We also design the system architecture that provide an overall insight
of the prototype DSS which is visually presented as Appendix E in the appendix
section of this thesis. We did consider the Euclidean distance measures to formulate
a P-median model that aims at minimizing the sum of the distances between each
node (Hakimi, 1964). This choice was based on the fact we could not use the non-
Euclidean approach to optimize the facility location selection because we did not
have accurate information on customers population distribution within the region.
3.2.1 Model Formulation

P-median model is a location model that can help with finding optimal location of
facilities based on an objective function(Han, 2013).From the problem definition
since objective (c) of our thesis is to provide an answer as to what models are needed
to develop the above-mentioned DSS. We use the P-median model because this
model allows for the optimization distances between nodes and edges. Our thesis
problem is that retailers are faced with the problem of having to always remodel
their store’s locations selection process, whenever they are about to build a new
store and now because of the global environmental issues the world is facing.

In this segment of this report we explains the model formulation of a variant P-
median model known as the distance-varying P-median model that was inspired by
(Kiris, 2014). The reason of choosing this variant of the p-median model is because
of it consideration of distance (Zhao et al., 2016). Another reason for choosing this
variant of the P-median model because it does use the discrete location model and
the facilities and demands are in discrete positions. In this model the goal is to place
p facilities to minimize the demand-weighted average distance between a demand
node i and the location j, in which the facility is placed. In this model there is no
capacity constraints at the facility. In Table 3 the demand nodes are represented by

 15
a set of vertices , and the possible locations of the facilites are given by another
set of vertices j . The model parameters are as follow in the table below.

Table 3 Decision Variables and Interpretations
 Decision Variables

 Variables Variable interpretation

 i Demand areas (1,2……..n)
 j Facilities locations (1,2…m)
 p Number of facilities to be located (1-because a retailer is locating a single store at a time)
 Shortest distance from node i to node j
 This represents the locations allocated to store j
 yj Facility at site d is located: 1, otherwise: 0
 ci The customers demand

The formula below is the objective function that was defined for our model. What this model
does is it adds the product between weighted distance of the population and the median
allocation to find the variables that minimizes this sum of this objective function (Júnior,

2021).

 Minimize ∑ ∑ −−−−−−−−−−−−−−−−−−−−−−−−−−−−−−−−−−−−−−−(1)
 =1 =1

The next step was the model restrictions regards to optimizing the distance between the demand
and the store now exactly p stores are chosen to be built within the chosen locations.

 ∑ = − − − − − − − − − − − − − − − − − − − − − − − − − − − − − − − −(2)
 =1

The next restriction is that only one store within a network can be placed into a
municipality. This is because all the pilot stores consider for this research only have
a single store within a municipality excluding Willys that got two outlets in Falun.
Lastly the demand points used in this research is the mid-point for all persons living
in each municipality within the Dalarna Region.

 ∑ = 1, ∀ − − − − − − − − − − − − − − − − − − − − − − − − − − − − − −(3)
 =1

The third restrictions on the other hand of the equation are to make sure that the sum
of the weighted distance (considering the population) is less than or equal to the
median distance of the allocated store j.

∑ ≤ , ∀ − − − − − − − − − − − − − − − − − − − − − − − − − − − − − −(4)
 =1

 16
Finally, these restrictions below are to make sure that the decision variables are
binary:
∈ {0,1, }∀ − − − − − − − − − − − − − − − − − − − − − − − − − − − − − −(5)
∈ {0,1}, ∀ , − − − − − − − − − − − − − − − − − − − − − − − − − − − − − (6)
3.2.2 Model Interpretation
The objective function (1) minimizes the total weighted travel cost between a store
and demand sites in a municipality. The distance between stores and demand sites
is calculated using the Euclidean distance measure based on the Pyomo model used.
The Scikit learn package was used to calculate the origin destination matrix
(hereafter OD-matrix), i.e., the distance between any pairs in the network, that was
used within the model. Constraints (2) and the objective function (1) interpret as
each demand d is to be allocated to their closest supply store within the network.
Constraint (2) indicates that p stores to be allocated at a given location. Constraints
(5-6) states that the location allocation variables should be integer and making it
binary (0,1). The model is linear programming optimization model, and these
location values are integer values either 1 or 0. The above model was implemented
in python using the Pyomo library, an optimization library for solving linear
programming problems. Detail’s explanation will be provided in the table summary
in the next section of this report.
3.2.3 Emission Based P-median Method
In this study, a new Emission-varying p-median model was derived at by using the
p-median model that minimizes transportation cost and in return will minimize the
amount of CO2 from transportation activities between stores and demand
points(Giri, 2010). Parameters and the objective function of this new model are
shown in the equation below:
The objective function of the estimated emissions model is to calculate how much
CO2 to be emitted from customer travel when the location of the new store has been
optimized.
CO2 estimation model below is the objective function of this optimization model:
Minimize E ∑∀ ⊂ × × − − − − − − − − − − − − − − − − − − − − − (7)
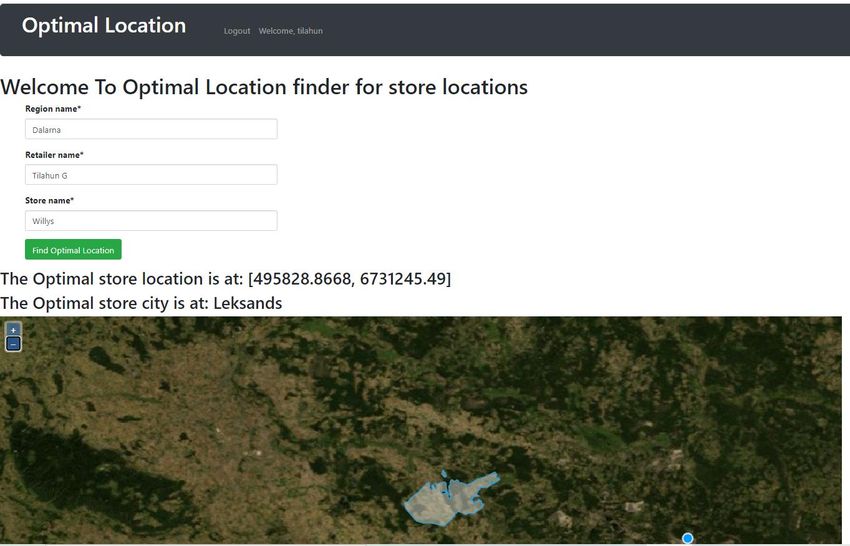
17Table 4 Decision variable for the Emission reduction function E: Amount of emission (Kg CO2) i: Customer’s demand Si: Number of travelled from demand point i Distance from store to demand point i (km) di: efi Emission factor (Kg CO2/Km) As per this equation for the emission calculation using a fixed emission-factor the amount of CO2 emission is proportional to travelled distance and the number times a person travelled(Kiris, 2014). The emission factors used in the equation is also determined according to the type of vehicle. As per research it was assumed that people in the Dalarna region mostly drive a gasoline-powered Toyota Avensis 1.8 with a CO2 emissions of 0.15 kg per km, so this means if a customer is driving search vehicle and had to drive 30km to get to a retail so than an estimated CO2 is (0.15*30kg/km)(Carling et al., 2015). It is possible for the emission factor to change or vary based on the type of car a customer is using to go the retail store at the said distance. To provide an answer to objective b) of this thesis we did design a user interface using JustMind an online platform that help with user-interface design from conception level as its suggested in its name. In continuation to providing an answer to objective b) of our thesis we consider what information is the user going to access and how this information is displayed to the user meaning what kind of visualization to consider. Since from the research we know that most of our retailers does not have the technical know-how understanding how a mathematical model works. We firstly derived a use case using the research problem which a retailer would like to have a web-based DSS that help him or her to remodel or add a new store to their retail stores network within in the Dalarna Region. The user will firstly need to login to a system that they can perform these said task. This means the retailer becomes the administrative user of this system. Once the user login to the system there is an app that allows them to register their network within the system. There is another app that help them to remodel their network or add one more store within the Dalarna Region considering the average distance measure from their store to their customers. Lastly a system does have a site visitor views these user of the system does not interact with the system. They can only view information that are 18
share by the administrator on this application, but this site also allows for a retailer
to create an account on this DSS.

Figure 3 provides a graphical representation of the user interface overview for our
prototype web-based DSS for retailers. Figure 3 does provide an idea as to how the
entire system is organized ranging from the user interaction with the system up to
their exit of the system. The prototype DSS allow for the user to register their
network, view their network, remodel their network, and optimize a new store
location within the Dalarna Region.

 Figure 3 The prototyped DSS overview

3.3 DSS Implementation

According to research the implementation phase of the Waterfall model that which
is referred to as the realization of the business requirement and design
specifications to get a concrete executable program (Bassil, 2015). This phase of
the waterfall methodology also encompasses all the tools used for the solution along
with the executable program, databases, website, and the software component. This
implementation phase also comprises the actual code where the requirement and
blueprints are converted to a production environment. For this project, the following
tools and framework were considered for development of the decision support

 19
system and the model implementation. This segment of the report does provide an
answer to objective c as to what toolkits are needed for the building this DSS that
can help retailers find optimal location for a new store considering distance.

Python- is an interpreted, object-oriented, high-level language with dynamical
semantics. It does have a high-level built-in data structures and with a dynamic
typing binding that makes it one of the most used for rapid application development.
The python syntax emphasizes readability and therefore reduces the cost of program
maintenance. During the implementation phase of this thesis the following Libraries
in python was implemented:

Table 5 Python Libraries and summarized descriptions
 Name of python Libraries Summarized Description
 Fiolum A python library used for visualizing geospatial data
 Shapely A Python package for manipulations and analysis of planar geometric
 objects
 Geopy A python client for several popular geocoding web services
 Pyomo A python-based open-source optimization modeling language with a vast
 set of optimization capabilities
 OSMNX A python package to retrieve, model, analyze and visualize street networks
 from Open Street map
 Networkx A python package for the creation manipulation and study of the structure,
 dynamics, and functions of complex networks.

Django- is a high-level python web framework that does rapid development and
clean, pragmatic design (Django Documentation | Django Documentation | Django,
2021). This framework was built by experienced developers, and it relieves a
developer the stress of reinventing the wheels and economically friendly because it
is an opensource framework. This framework is also secure, fast, and scalable. The
Django framework was used to design and implement the user interface for this
thesis. This framework uses the Model, view, and controller format. The models do
refer to the data, the view is the same as the logic and the template or the controller
can also be referred to as presentation. Using this framework, the user authentication
was built, and this allow for the addition of a user to the system. Once a retailer is
not register to the system it is impossible to use this system. Since this a web-based
DSS it is important that a site page is added to the system that has a view for
outsiders and as well the site viewers cannot make changes to the information within
the system. All of these are done by the robustness of the Django framework.

 20
GeoDjango- is an included contrib module of Django that turns it into a world-class
geographic web framework. The GeoDjango can be refer to as an extension or add-
on to Django that spatial enabled the Django framework. GeoDjango provides a
simpler possible way to create geographic web application, like location-based
services and its features are:
 a. Django model fields for OGC geometries and raster data
 b. Extensions to Django’s ORM for querying and manipulating spatial data.
 c. Loosely coupled, high-level python interfaces for GIS geometry and raster
 operations and data manipulation in different formats.
 d. Editing geometry fields from the admin

The geodjango which is an extension of the Django framework does provide a robust
libraries and plugins on spatial data. This also provide ways for spatial data
visualization and analysis. This geodjango also help with the making of geo location
application where the analysis is visualized. The geodjango uses the
GDAL(Geospatial Data Abstraction library),Geos(Geospatial),Proj.4(a Library for
coordinate reference systems, ESR and postGis(open source software that help
postgreSql).

QGIS-3_ is a user-friendly Open-Source Geographic Information system (GIS)
licensed und the GNU general public License. QGIS is an official project of the
open-source Geospatial foundation (OSGeo). This software work on all the most
popular operating systems globally. The rationale for using this software was to help
with visualization of the location data of the people of Dalarna, brick-and-mortar
stores locations and the road network data as well during the development of the
above-mentioned system. The qgis tool was used to also convert the spatial data
generated for the population grids, locations of the brick-and-mortar stores along
with the municipalities data to a comma separated value file for analysis in python.

PostgreSql- is a very effective open-source object-relational database system that
has been in existence for the past thirty (30) years and has been actively used. It has
over the years gained a very great reputation because of its reliability, feature
robustness and performance. In this thesis the PostgreSQL was used to store all the

 21
spatial data that were used for analysis, visualization and for the implementation of
the optimization model on the given data.
During the implementation segment of this thesis all the above listed tools were
employed for the building of this prototype of the DSS. This section of this thesis
does provide an answer to objective (b) and objective (c) of this thesis. The testing
process has also been implemented by Django because it does automatically
generate a testing file that does test the DSS along the development stages. As for
the deployment and maintenance it will be discuss in the conclusion section of this
thesis.

 22
4: Data quality and processing
This section of the Report provides a description as to what data quality techniques
were used for the data consider in this thesis along with how the data were
processed for the model implementation.
4.1 Data Pre-processing

Most of the data used in this thesis was secondary data like the municipalities’ geo
locations latitude and longitude data. For data quality check the most we could do
with it was check the coordinates on the map using the open street or google map
and it all fitted. So, any standard error that is accepted for map measurement from
these platforms does apply to our data.

The next data that was used in this study was the road network data and we did check
for missing data and fortunately there was none because all the nodes and edges in
this road network was connected. So, we use this data as it was to project the geo
coordinates of the Region municipalities for a better projection. This helps to keep
the projection of the municipalities standardized for visualization on the Dalarna
region map or the road network map.

This data was used to develop the OD-matrix. As for the six retailers’ data gathered
at the beginning of the study, we also cross checked the latitude and longitude points
on the open street maps, and it does correspond with the actual areas on the map of
these store before considering this data for analysis.

From the visualization of this data as demonstrated by Figure 2, it can be noticed
that most of these stores within the region are mostly situated within populated areas
of the region. This means most of the people traveling long distances to shop are
people living in sparsely populated communities. Another observation of the data is
most of the business reasons for stores locations was highly influenced by
population. From this analysis certain municipalities within the region does have a
store from all the six selected retailers. On contrary some municipalities do not have
any of these retail stores. For example, from the six-retail network considered for
this thesis they all do have a store in Borlange, Falun, Mora, Ludvika and Malung-
Salen and none was found in Leksand and other less populated municipalities.
These four municipalities based on data from Statistics Sweden these are the most

 23
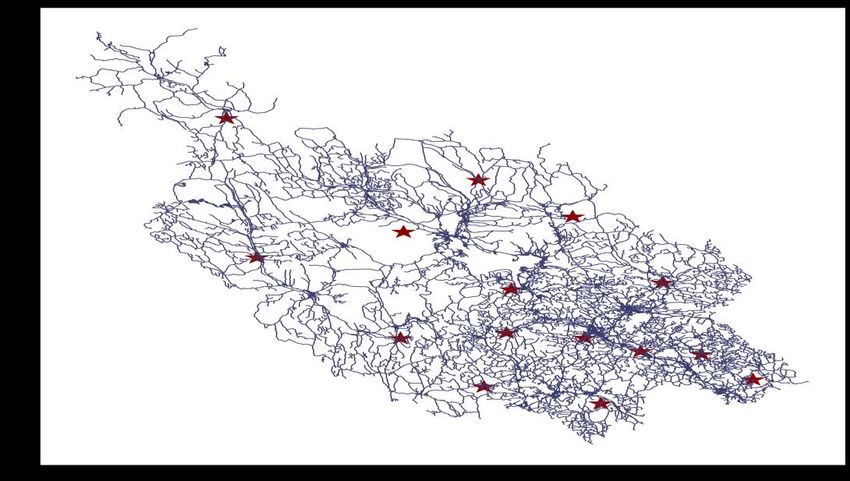
populated municipalities within the region and this information is presented in Table
1.

In this thesis, the data use for the P-median model implementation consisted of data
generated from the Dalarna region 15 municipalities as the demand points why the
municipalities population data collected from statistics Sweden was used as the
number of customers at a demand point. Figure 4 is a graphical position of these 15
municipalities within the Dalarna region using these areas latitude and longitude
data and projected to the Dalarna Road network. This graph was generated using the
centroid points for the municipalities.

 Figure 4 Dalarna County Municipalities latitude and longitude
 dispersion

Figure 1 does provide the summary of the road network data and what type of road
composition is the network. The red stars symbols does represents the various
municipalities within the Dalarna region. During the analysis of the road network,
we noticed that maximum speed limit of all the roads is 100km/hr, and the minimum
speed limit is 3km/hr. Figure 5 is a summary data of the speed limit of the roads
within the Dalarna Road network data extracted from OSMNX. From Figure 5 the
speed limits for each road ranges from 3km – 100km/hr and the international roads
does have speed limits from 100km-110km/hr and some had up to four different
combinations all ranging from 30km-110km/hr.

 24
You can also read