Denver Gold Forum
      September 17, 2019
←
→
Page content transcription
If your browser does not render page correctly, please read the page content below

Denver Gold Forum
September 17, 2019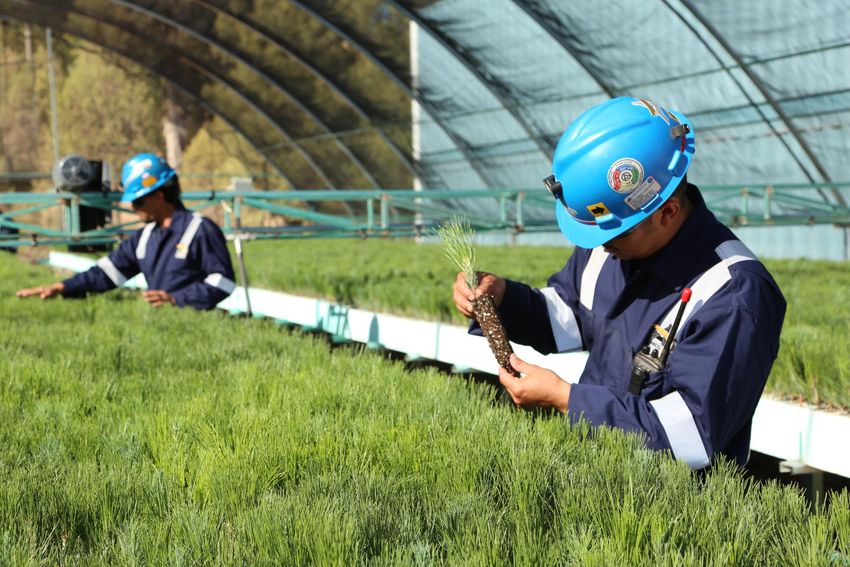
Forward Looking Statements
The information in this presentation has been prepared as at September 13, 2019. Certain statements contained in this presentation constitute "forward-looking statements" within the
meaning of the United States Private Securities Litigation Reform Act of 1995 and "forward-looking information" under the provisions of Canadian provincial securities laws and are referred
to herein as "forward-looking statements". When used in this presentation, the words "anticipate", "could", "estimate", "expect", "forecast", "future", "plan", "potential", "will" and similar
expressions are intended to identify forward-looking statements. Such statements include, without limitation: the Company's forward-looking production guidance, including estimated ore
grades, recovery rates, project timelines, drilling results, metal production, life of mine estimates, total cash costs per ounce, all-in sustaining costs per ounce, minesite costs per tonne,
other expenses, cash flows and free cash flow; the estimated timing and conclusions of technical studies and evaluations; the methods by which ore will be extracted or processed;
statements concerning the Company's ongoing construction activities at Amaruq, the Company's expansion plans at Kittila and the Company's ramp-up activities at Meliadine, including the
timing, funding, completion and commissioning thereof; statements concerning other expansion projects, recovery rates, mill throughput, optimization and projected exploration, including
costs and other estimates upon which such projections are based; statements regarding timing and amounts of capital expenditures and other expenditures; estimates of future mineral
reserves, mineral resources, mineral production, optimization efforts and sales; estimates of future capital expenditures and other cash needs, and expectations as to the funding thereof;
future dividend amounts and payment dates; the projected development of certain ore deposits, including estimates of exploration, development and production and other capital costs and
estimates of the timing of such exploration, development and production or decisions with respect to such exploration, development and production; estimates of mineral reserves and
mineral resources and the effect of drill results on future mineral reserves and mineral resources; statements regarding the Company's ability to obtain the necessary permits and
authorizations in connection with its proposed or current exploration, development and mining operations and the anticipated timing thereof; statements regarding anticipated future
exploration; the anticipated timing of events with respect to the Company's mine sites; statements regarding the sufficiency of the Company's cash resources and other statements
regarding anticipated trends with respect to the Company's operations, exploration and the funding thereof; and statements regarding the outcome of discussions with First Nations groups.
Such statements reflect the Company's views as at the date of this presentation and are subject to certain risks, uncertainties and assumptions, and undue reliance should not be placed
on such statements. Forward-looking statements are necessarily based upon a number of factors and assumptions that, while considered reasonable by Agnico Eagle as of the date of
such statements, are inherently subject to significant business, economic and competitive uncertainties and contingencies. The material factors and assumptions used in the preparation
of the forward looking statements contained herein, which may prove to be incorrect, include, but are not limited to, the assumptions set forth herein and in management's discussion and
analysis ("MD&A") and the Company's Annual Information Form ("AIF") for the year ended December 31, 2018 filed with Canadian securities regulators and that are included in its Annual
Report on Form 40-F for the year ended December 31, 2018 ("Form 40-F") filed with the U.S. Securities and Exchange Commission (the "SEC") as well as: that there are no significant
disruptions affecting operations; that production, permitting, development and expansion at each of Agnico Eagle's properties proceeds on a basis consistent with current expectations and
plans; that the relevant metal prices, foreign exchange rates and prices for key mining and construction supplies will be consistent with Agnico Eagle's expectations; that Agnico Eagle's
current estimates of mineral reserves, mineral resources, mineral grades and metal recovery are accurate; that there are no material delays in the timing for completion and commissioning
of ongoing growth projects; seismic activity at the Company's operations at LaRonde is as expected by the Company; that the Company's current plans to optimize production are
successful; and that there are no material variations in the current tax and regulatory environment. Many factors, known and unknown, could cause the actual results to be materially
different from those expressed or implied by such forward looking statements. Such risks include, but are not limited to: the volatility of prices of gold and other metals; uncertainty of
mineral reserves, mineral resources, mineral grades and mineral recovery estimates; uncertainty of future production, project development, capital expenditures and other costs; foreign
exchange rate fluctuations; financing of additional capital requirements; cost of exploration and development programs; seismic activity at the Company's operations, including the
LaRonde mine; mining risks; community protests, including by First Nations groups; risks associated with foreign operations; the unfavorable outcome of litigation involving the Canadian
Malartic General Partnership; governmental and environmental regulation; the volatility of the Company's stock price; and risks associated with the Company's currency, fuel and by-
product metal derivative strategies. For a more detailed discussion of such risks and other factors that may affect the Company's ability to achieve the expectations set forth in the forward-
looking statements contained in this presentation, see the AIF and MD&A filed on SEDAR at www.sedar.com and included in the Form 40-F filed on EDGAR at www.sec.gov, as well as
the Company's other filings with the Canadian securities regulators and the SEC. Other than as required by law, the Company does not intend, and does not assume any obligation, to
update these forward-looking statements.
Currency
All amounts in this presentation are expressed in U.S. dollars except as otherwise noted.
Further Information
For further details on Agnico Eagle’s second quarter 2019 results, please see the Company's news release dated July 24, 2019.

                                                                                                                                                                    Denver Gold Forum        2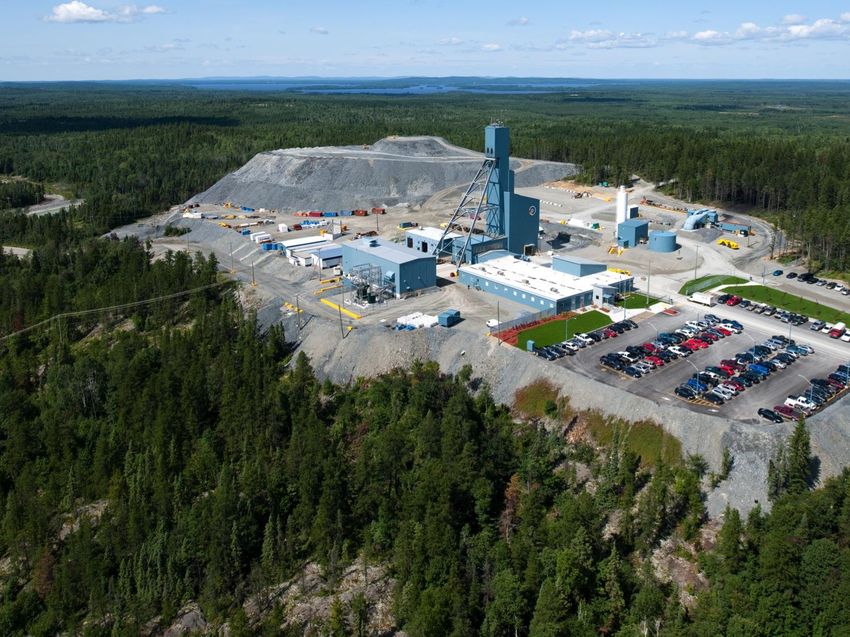
Notes to Investors
Note Regarding the Use of Non-GAAP Financial Measures

This presentation discloses certain measures, including "total cash costs per ounce“, "all-in sustaining costs per ounce" and “mine operating profit” that are not standardized
measures under IFRS. These data may not be comparable to data reported by other issuers. For a reconciliation of these measures to the most directly comparable financial
information reported in the consolidated financial statements prepared in accordance with IFRS and for an explanation of how management uses these measures, see "Non-GAAP
Financial Performance Measures" in the MD&A filed on SEDAR at www.sedar.com and included in the Form 6-K filed on EDGAR at www.sec.gov, as well as the Company's other
filings with the Canadian securities regulators and the SEC.

The total cash costs per ounce of gold produced is reported on both a by-product basis (deducting by-product metal revenues from production costs) and co-product basis (without
deducting by-product metal revenues). Unless otherwise specified total cash costs per ounce of gold produced is reported on a by-product basis in this presentation. The total cash
costs per ounce of gold produced on a by-product basis is calculated by adjusting production costs as recorded in the consolidated statements of income for by-product revenues,
unsold concentrate inventory production costs, smelting, refining and marketing charges and other adjustments, and then dividing by the number of ounces of gold produced. The
total cash costs per ounce of gold produced on a co-product basis is calculated in the same manner as the total cash costs per ounce of gold produced on a by-product basis except
that no adjustment is made for by-product metal revenues. Accordingly, the calculation of total cash costs per ounce of gold produced on a co-product basis does not reflect a
reduction in production costs or smelting, refining and marketing charges associated with the production and sale of by-product metals. The total cash costs per ounce of gold
produced is intended to provide information about the cash-generating capabilities of the Company's mining operations. Management also uses these measures to monitor the
performance of the Company's mining operations. As market prices for gold are quoted on a per ounce basis, using the total cash costs per ounce of gold produced on a by-product
basis measure allows management to assess a mine's cash-generating capabilities at various gold prices.

All-in sustaining costs per ounce ("AISC") is used to show the full cost of gold production from current operations. The Company calculates all-in sustaining costs per ounce of gold
produced on a by-product basis as the aggregate of total cash costs per ounce on a by-product basis, sustaining capital expenditures (including capitalized exploration), general and
administrative expenses (including stock options) and reclamation expenses. The all-in sustaining costs per ounce of gold produced on a co-product basis is calculated in the same
manner as the all-in sustaining costs per ounce of gold produced on a by-product basis, except that the total cash costs per ounce on a co-product basis are used, meaning no
adjustment is made for by-product metal revenues. Management is aware that these per ounce measures of performance can be affected by fluctuations in foreign exchange rates
and, in the case of total cash costs per ounce of gold produced on a by-product basis, by-product metal prices. Management compensates for these inherent limitations by using
these measures in conjunction with other data prepared in accordance with IFRS. The World Gold Council ("WGC") is a non-regulatory market development organization for the gold
industry. Although the WGC is not a mining industry regulatory organization, it has worked closely with its member companies to develop relevant non-GAAP measures. The
Company follows the guidance on all-in sustaining costs released by the WGC in November 2018. Adoption of the all-in sustaining costs metric is voluntary and, notwithstanding the
Company's adoption of the WGC's guidance, all-in sustaining costs per ounce of gold produced reported by the Company may not be comparable to data reported by other gold
producers. The Company believes that this measure provides helpful information about operating performance. However, this non-GAAP measure should be considered together
with other data prepared in accordance with IFRS as it is not necessarily indicative of operating costs or cash flow measures prepared in accordance with IFRS.

The Company calculates mine operating profit for a given period by taking the amount equal to the Company’s gold production from its mines multiplied by the differential in the price
of gold over the total cash costs per ounce. Management uses mine operating profit as a means of assessing the cash flow generation of the business. Estimates of mine operating
profit in future periods are based on the Company's production guidance, total cash cost guidance and internal forecasts as of the date hereof.

Note Regarding Production Guidance

The gold production guidance is based on the Company's mineral reserves but includes contingencies and assumes metal prices and foreign exchange rates that are different from
those used in the mineral reserve estimates. These factors and others mean that the gold production guidance presented in this presentation does not reconcile exactly with the
production models used to support these mineral reserves.

The Company's production guidance at Meliadine is based, in part, on the results of preliminary economic assessments. These preliminary economic assessments include inferred
mineral resources that are considered too speculative geologically to have the economic considerations applied to them that would enable them to be categorized as mineral
reserves, and there is no certainty that the production guidance set out in this presentation will be realized. The preliminary economic assessment used in respect of the Meliadine
mine project included 3.6 million contained ounces of inferred mineral resource, 3.3 million contained ounces of measured and indicated mineral resource and 3.4 million contained
ounces of proven and probable mineral reserve. For further information on the Company's production guidance at Meliadine, including the qualifications and assumptions made in
connection with the preparation of the assessments, please see the Company's press release dated February 14, 2019 and the Company's AIF, as well as the Company's other
filings with the Canadian securities regulators and the SEC.

                                                                                                                                                                Denver Gold Forum        3
Building A Long Term, Sustainable, Self Funding Business

➢ Track record of strong operational performance – have exceeded production and cost guidance for
  seven consecutive years

➢ Record gold production expected in 2019 with 2.0Moz anticipated in 2020 and beyond

   • Completing large expansion in Nunavut in 2019
   • Capital spending expected to decline significantly as the Company moves to a cash “harvest” mode

➢ Quality mineral reserve base – gold reserves growing and grades improving

➢ Operating in low-political risk, pro-mining jurisdictions

➢ Longer term project pipeline provides additional opportunities to add value

➢ Deep “bench strength” – broad range of technical skills and experience

➢ Committed to continuous improvement in ESG

   • Participant in World Gold Council initiative “Responsible Gold Mining Principles”

                                                                                         Denver Gold Forum   4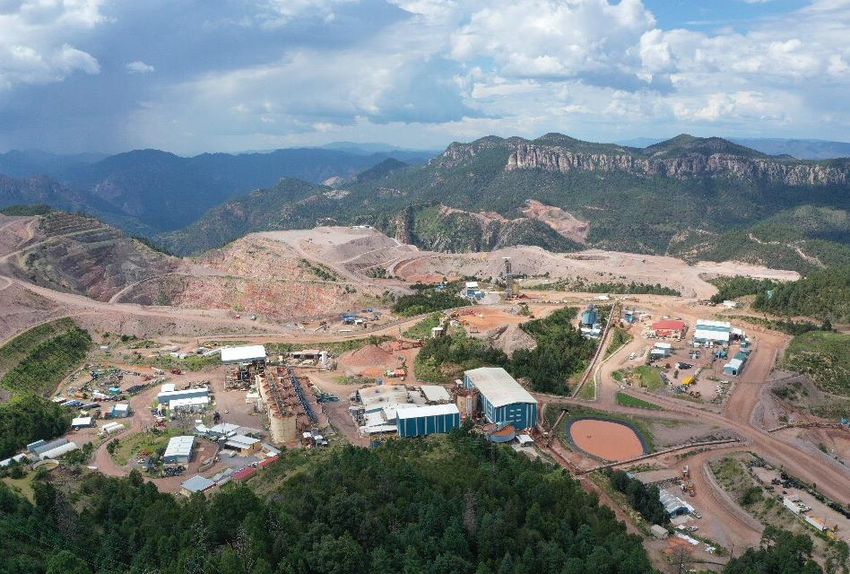
2018 ESG Performance Highlights

         Health and Safety
         • Perfect score at Lapa (0 combined accident frequency); awarded Safest Mine in Canada 2018
         • Zero lost-time accidents from our exploration group
         • Pinos Altos earned the “Casco de Plata” Award in 2018, a safety recognition in mining rescue in
           Mexico and La India received the Silver Helmet Award for safety performance
         • No fatal accidents in 2018
         • 20,227,598 hours worked, the highest in Agnico Eagle’s history

            Environment
            • Kittila, La India, LaRonde, Meadowbank and Pinos Altos were re-certified with the International
              Cyanide Code
            • Goldex, Kittila, La India, LaRonde, Meadowbank and Pinos Altos have received Leadership
              Awards (TSM) from the Mining Association of Canada for their performance during external
              audits - Agnico won 6 of 8 awards in 2018

        Social
        •   In 2018, $5.9 M was spent in community investment
        •   100% of our Pinos Altos and La India mine workforce from Mexico
        •   19th out of 75 companies for Agnico Eagle Mexico in Great Place to Work’s Best Workplaces
        •   16% of our employees in 2018 are female – diversity action plan ongoing to increase %
        •   370 tonnes of community hazardous materials was cleaned up at the Baker Lake landfill

                                                                                                  Denver Gold Forum   5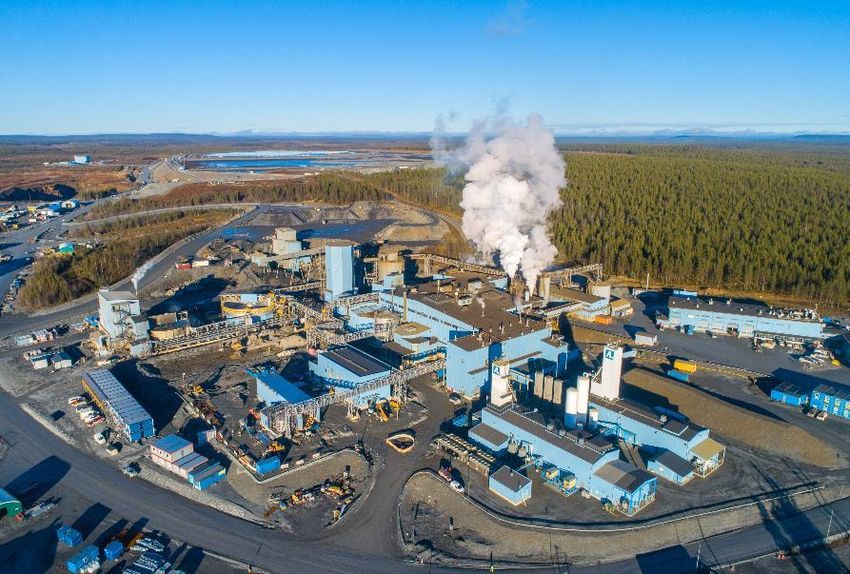
Strong Operating Platform Drives Outperformance
Guidance Exceeded for Seven Consecutive Years

            Production Guidance Versus Actual                                             Total Cash Cost Per Ounce Guidance
                       (in Millions)                                                                 Versus Actual
                                                                            $800
                                                           1.71
                                      1.67             1.68
                                  1.65          1.66
                                                                     1.63   $750
                                             1.60

                                                                  1.53
                                                                            $700
                           1.43
                       1.40

                                                                            $650

                                                                            $600
                1.10
            1.06
     1.04
 1.03                                                                       $550

                                                                            $500
  2012       2013       2014       2015       2016      2017       2018            2012     2013      2014     2015       2016      2017      2018

            Initial Production Guidance        Production Actual                                   Cost Guidance      Cost Actual

                                                                                                                                 Denver Gold Forum   6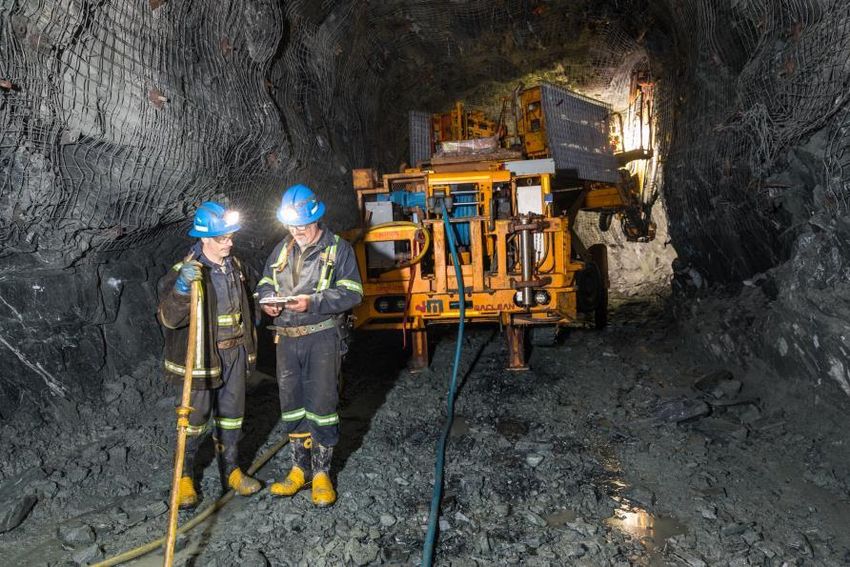
Focused on Maintaining Quality Gold Reserves
Successfully Replaced Gold Reserves in 2018 with Higher Grades

                                Gold Mineral Reserve Grade (g/t)                                         5-Year Difference Between Production and
                                                                                                                   Mineral Reserve Grade
                2.70
                                                                                                                                                 44%       45%

                              1.56                                                                                                        23%
                                            1.17          1.08          1.08
                                                                                                                             10%

                                                                                    0.45

                                                                                     AUY
                 AEM

                                             IAG

                                                                          AVERAGE
                                                            NEM**
                               ABX*

                                                                                                               -17%
                                                                                                  -20%

                                                                                                   IAG         AEM          NEM           ABX    YRI       KGC

     Source: Company reports as at December 31, 2018                                           Source: Company reports, Raymond James Research
     * Excludes Randgold mineral reserves as merger was effective January 1, 2019
     ** Excludes Goldcorp mineral reserves as merger was effective April 18, 2019

   ➢ Mined below reserve grade in 2018
              ➢        1.86 grams per tonne (“g/t”) gold, compared to reserve grade of 2.49 g/t gold*
   ➢ Large percentage of current mineral reserves are mineable at total cash costs below $900/oz
   ➢ 2018 gold mineral reserves increased by 7.2% to 22.0Moz of gold (average reserve grade 2.70 g/t)
   ➢ Mineral reserve sensitivity to gold price:
              ➢        $100/oz increase/decrease in the gold price assumption results in +4%/-6% change

Detailed information on mineral reserves and mineral resources can be found in the February 14, 2019 news release

* Reserve grade at December 31, 2017                                                                                                                   Denver Gold Forum   7
Nunavut Assets Provide Production and Reserve Growth in
2019 and Beyond

➢ Gold production set for significant increase
➢ Large land package has exploration upside
➢ Operating base benefits from cost
  synergies with Quebec operations
➢ Opportunities to lower costs with cheaper,
  renewable energy options

                                                 Detailed information on mineral reserves and mineral resources can be found in the
                                                 February 14, 2019 press release

                                                                                                                   Denver Gold Forum   8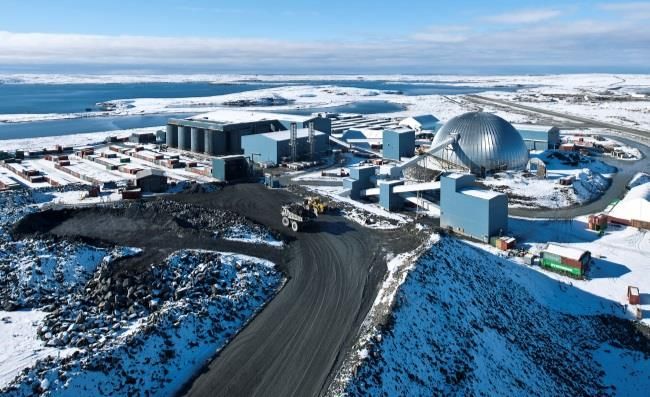
Meliadine
Commercial Production Achieved on Schedule and Under Budget; Production Ramp Up
Ongoing; Drilling outlines New Tiriganiaq Ore Lenses at Depth
 Proven & probable gold                    Measured & indicated                     Inferred gold resource              Q2 2019 Production*   Q2 2019 Total Cash
 reserves (million oz)                     gold resources (million oz)              (million oz)                        (koz)                 Costs/oz

 3.8                                       3.2                                      2.6                                 31                    $850
                                                                                  ➢ Declared commercial production on May 14, 2019

                                                                                  ➢ After accounting for lower pre-commercial production gold
                                                                                    sales (which would have offset some of the capital costs),
                                                                                    total project construction costs (at the date of commercial
                                                                                    production) were ~$830M (below the forecast of $900M)

                                                                                  ➢ Underground operations continue to ramp up and three
                                                                                    mining horizons are now well established

                                                                                  ➢ The process plant continues to ramp up towards nameplate
                                                                                    capacity of 3,750 tpd. The plant has operated at up to 4,800
                                                                                    tpd (~4,000 tpd average in August)

                                                                                  ➢ During Q2 2019, recoveries averaged 92.1%, which was
                                                                                    slightly below guidance. Work is underway to increase
                                                                                    recoveries

                                                                                  ➢ Production guidance (including pre-commercial production
                                                                                    ounces) for 2019 remains unchanged at ~230koz gold
See AEM February 14, 2019 press release and appendix for detailed breakdown of mineral reserves and mineral resources

* Excludes pre-commercial production of 30koz                                                                                                      Denver Gold Forum   9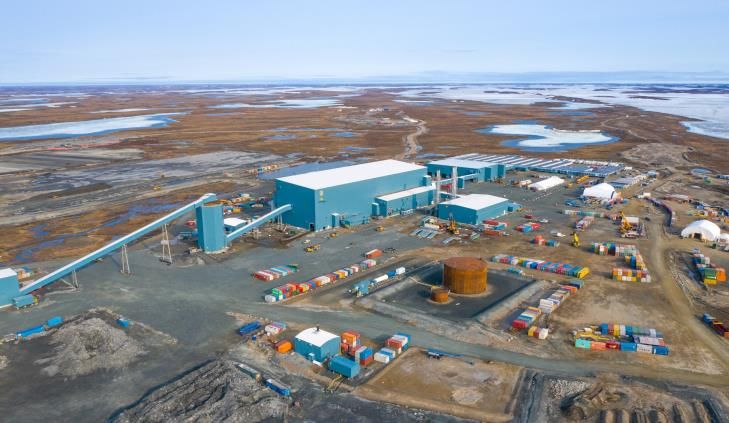
Amaruq Project – Mining Activities Continue to Ramp Up; Commercial Production
Expected to be Achieved Shortly; Drilling Continues to Enhance U/G Potential

                                  ➢ Mining at Whale Tail was impacted by slower than
                                    expected pit dewatering activities (related to adverse
                                    weather conditions) and a longer than expected
                                    caribou migration period. Final lake dewatering is
                                    expected to be completed in late Q3 2019

                                  ➢ 2019 production guidance for the Meadowbank
                                    Complex remains unchanged at 230koz gold, but with
                                    a higher percentage of ounces produced from
                                    Meadowbank ore

                                  ➢ In late June 2019, ~39.2k tonnes of low-grade ore (1.83
                                    g/t gold) from the Whale Tail deposit was processed at
                                    the Meadowbank mill to test the characteristics of the
                                    ore and was in line with expectations

                                  ➢ At Amaruq, total project development capital
                                    expenditures are forecast to be ~$350 to $370 million.
                                    Some variability is expected depending on the timing of
                                    the achievement of commercial production, prevailing
                                    gold prices and foreign exchange rates

                                  ➢ As a result of ongoing positive exploration drilling, an
                                    additional $21M has been added to the capital forecast
                                    for the Amaruq underground project to fund increased
                                    underground development and conversion drilling.
                                    This accelerated program could help facilitate potential
                                    underground production in 2022
                                                                                 Denver Gold Forum   10
Nunavut Production Platform Supports Continued Growth
Pipeline Expected to Drive Future Production Growth Beyond 2021
2.50
Pipeline
Projects
2.05
2.00
2.00
Near-Term Pipeline
1.75
Projects (2021-2023)
1.63
Gold Ounces (in Millions)
• LaRonde Complex
1.50 • Goldex Deep 2 & South Zone
• Amaruq U/G
• Meliadine Phase 2 expansion
• Kittila expansion (under
construction)
1.00 • Pinos Altos satellites
• La India satellites
• Odyssey & East Malartic U/G
0.50
0.00
2018A 2019E 2020E 2021E 2022E - 2023E
Denver Gold Forum 11Agnico Eagle’s Growing Business Positioned to Generate Rising
Net Free Cash Flow
$2,000,000
$1,900,000
$1,800,000
$1,700,000
$1,600,000
$1,500,000
$1,400,000
$1,300,000
$1,200,000 Potential uses of rising cash flow:
(In Thousands)
$1,100,000
• Funding pipeline projects
• Re-pay debt
$1,000,000
• Increase dividends
$900,000
$800,000
$700,000
Potential total capex
$600,000
$500,000
$400,000
$300,000
$200,000
$100,000
$-
2014 2015 2016 2017 2018 2019E 2020E 2021E 2022E
Sustaining Capex Growth Capex Mine Operating Profit*
* Mine Operating Profit = ounces x (gold price – total cash costs per ounce). Estimated Mine Operating Profit was based on a gold price of $1400.
For further details on growth capex guidance related to the Amaruq, Meliadine and the Kittila Expansion projects for 2019 and onwards, please refer to the news release dated February 14, 2019.
Denver Gold Forum 12Focused on Growing Value on a per Share Basis
Consistent Strategy that Works
➢ 9% NAVPS CAGR* from 2005 to 2018 ➢ Production per 1000 Shares CAGR from
versus 2% NAVPS CAGR of peers 2005 to 2021E of 8%
15%
NAVPS Compound Annual Growth Rate Production per 1000 shares
10.0
(2005 – 2018)
9.0
10% 9%
8.0
7.0
6.0
5% 5.0
3% 2% 2% 4.0
1% 1% 3.0
0% 2.0
1.0
-2% -
-5% -4%
Source: Scotiabank Global Banking and Markets, Bloomberg Source: Agnico reports
* Compound Annual Growth Rate ("CAGR") Denver Gold Forum 13Agnico Eagle’s Long History of Returning Value to Shareholders
Business Positioned to Potentially Grow Dividends
$961M
$200,000 $1,800
in cumulative
$180,000
dividends over
$1,600
the last 36 years
$160,000
$1,400
$140,000
$1,200
$120,000
(In Thousands)
$1,000
$100,000
$800
$80,000
$600
$60,000
$400
$40,000
$20,000 $200
$- $-
2008 2009 2010 2011 2012 2013 2014 2015 2016 2017 2018
Total Annual Dividend Average Gold Price
Denver Gold Forum 14Superior Share Performance Since 1998
Agnico Eagle has consistently outperformed gold and gold equities
AEM US Equity Gold Spot S&P 500 Index XAU Index
10000%
AEM US Equity
CAGR
1000%
13.40%
Gold Spot CAGR
8.24%
100%
S&P 500 Index CAGR
4.78%
XAU Index CAGR
10%
2.03%
Source: Bloomberg – August 3, 1998 to September 6, 2019
Denver Gold Forum 15Agnico Eagle – A Growing, High Quality Business
➢ Strategy is simple, consistent and effective – no need to change
➢ Business is performing and well positioned – delivering on promises and growing at a
steady, measured pace
➢ Gold production increasing, unit costs declining – drives rising cash flow per share
➢ Capital investment declining, mine operating profit increasing – drives rising net free
cash flow
➢ Financial position strengthening – rising cash flow to fund project pipeline, repay debt
and increase dividends
Denver Gold Forum 16Click to edit Master title style
Appendix
Denver Gold ForumSecond Quarter 2019 Highlights
➢ Solid operating results – Payable gold production in Q2 2019 was 412koz including pre-commercial production ounces at
Meliadine (30koz) and Amaruq (2koz) at $735 production costs/oz, $652 total cash costs/oz and $953 all-in sustaining
costs/oz (“AISC”). Production costs, total cash costs and AISC exclude Meliadine and Amaruq pre-commercial production
➢ Meliadine mine declared commercial production on May 14, 2019 – Total pre-commercial production was 47koz. Total
project development capital costs for Meliadine were ~$830M (below the forecast of $900M). Operations are continuing to
ramp up and expected production for 2019 is unchanged at ~230koz gold (including pre-commercial production ounces)
➢ Amaruq project remains on schedule for commercial production – Mining impacted by slower than expected
dewatering activities (related to adverse weather conditions) and a longer than expected caribou migration period. Despite
this, the project continues to ramp up, with commercial production expected to be achieved shortly. FY2019 production
guidance for the Meadowbank Complex remains unchanged at 230koz gold, but with a higher percentage of ounces
produced from Meadowbank ore
➢ Production and cost guidance maintained for 2019 – Total production guidance remains unchanged at 1.75Moz gold
(including pre-commercial production ounces from Meliadine and Amaruq). Total cash costs/oz and AISC for 2019 are
expected to continue to be in the range of $620 to $670 and $875 and $925, respectively
➢ Increased Capital Budget for 2019 – Capital costs estimated at $750M (previous guidance was $660M). Increased capital
costs are primarily due to lower pre-commercial gold sales at Meliadine, advancement of the Amaruq underground
development program (based on positive exploration results to date) and accelerated spending on the Meliadine saline water
treatment system (receipt of discharge permit earlier than expected)
➢ A quarterly dividend of $0.125 per share was declared
Denver Gold Forum 18Exploration Continues to Enhance Minesite and Pipeline Projects ➢ Amaruq exploration ramp and conversion results – The exploration ramp has reached 192m depth between the Whale Tail and V Zones; drilling from the ramp started in late June and is expected to increase the rate of conversion to underground indicated mineral resources ➢ Meliadine exploration focused on Tiriganiaq at depth – Two new lodes discovered approximately 75m north of previously known Tiriganiaq mineralization, at depth in the southwest, including 9.2 g/t gold over 4.6m at 812m depth, the deepest reported intercept to date at Meliadine ➢ Kittila conversion yields strong grades and widths in Rimpi Zone – Conversion drilling cut three closely-spaced intercepts over 48m core length: 6.5 g/t gold over 3.9m, 9.7 g/t gold over 13.1m and 6.0 g/t gold over 13.6m at ~950m depth ➢ Santa Gertrudis exploration extends high-grade mineralization in Amelia Deposit – Recent drill results, such as 8.2 g/t gold over 7.3m at 208m depth, have extended the Amelia deposit (in the Trinidad Zone) to 700m strike length and 450m depth; the deposit remains open along strike and at depth See AEM February 14, 2019 press release and appendix for detailed breakdown of mineral reserves and mineral resources Denver Gold Forum 19
Q2 2019 Operating Results
Stable Operational Performance
                                                                                     Q2 2019                                                                  Q2 YTD 2019
                                                             Production*          Total Cash Costs**              Operating Margin                     Production*          Total Cash Costs**
                                                                (Gold oz)                     ($/oz)                       ($000’s)                       (Gold oz)                     ($/oz)
 Northern Business
    LaRonde                                                        76,587            $              506            $          66,902                         154,020           $          497
    LaRonde Zone 5                                                 16,170            $              780            $           8,882                          29,158           $          733
    Lapa                                                                -            $                -            $               -                               5           $            -
    Goldex                                                         34,325            $              589            $          25,126                          68,779           $          574
    Canadian Malartic (50%)                                        84,311            $              607            $          60,232                         167,981           $          589
    Kittila                                                        20,077            $              619            $           8,205                          69,413           $          730
    Meadowbank                                                     39,457            $            1,066            $           9,244                          82,959           $          982
    Meliadine                                                      61,112            $              850            $          15,033                          78,694           $          850
                                                                 332,039             $              672            $         193,624                         651,009           $          653
 Southern Business
    Pinos Altos                                                   41,740             $               597           $          27,281                          84,470           $          545
    Creston Mascota                                               18,336             $               320           $          14,863                          31,865           $          407
    La India                                                      20,200             $               780           $          11,346                          43,188           $          769
                                                                  80,276             $               580           $          53,490                         159,523           $          578
 Total                                                           412,315             $               652           $         247,114                         810,532           $          638
                   Q2 2019 Revenue by Metal                                                                       Q2 2019 Total Operating Margin – $247.1M
                                                                                                                                         Kittila, 3%         LaRonde, 27%
                                                                                                                       LaRonde Zone 5,
                                                                                                                            4%
            Base Metals                                     Gold
                2%                                          95%
               Silver                                                                                           Meadowbank, 4%
                                                                                                                                                                      Canadian
                3%                                                                                                       La India, 5%                                Malartic, 24%
                                                                                                                             Creston
                                                                                                                           Mascota, 6%
                                                                                                                              Meliadine, 6%
                                                                                                                                                                 Pinos Altos, 11%
                                                                                                                                        Goldex, 10%

* Gold production includes pre-commercial production from Amaruq (2koz for Q2 and Q2 YTD 2019) and Meliadine (30koz for Q2 2019 and 47koz for Q2 YTD 2019)                    Denver Gold Forum   20
** Excludes Amaruq and Meliadine pre-commercial production
Financial Position
Strong Financial Liquidity Underpins Current Growth Phase
Strong Available Liquidity - $1.3B*
➢ As at June 30, 2019 the Company
$126 had strong liquidity with $126M in
cash and cash equivalents and $1.2B
(excluding $300M accordion) in
undrawn credit lines available
$1,200
➢ Low share count of 237M fully diluted
shares after 61 years of operating
Cash and cash equivalents Undrawn credit facilities
history
*As at June 30, 2019 excluding accordion
Debt Maturities**
$400 $360
$350
$300
$250
$250 $225
$200
$200
$150
$150
$100 $100 $90 $100 $95
$100
$55
$50 $10
$-
2020 2022 2023 2024 2025 2026 2027 2028 2029 2030 2032 2033
**As at June 30, 2019
Denver Gold Forum 21Successful M&A and Exploration Strategy
Significant Value Added, Key Deposits Still Open and Positioned to Deliver More Value
Mined through 2018 (koz) Proven & Probable (koz) Measured & Indicated (koz) Inferred (koz) Cost per Oz ($)
Kittila Meadowbank Meliadine Pinos Altos La India
8,884 koz (Including Amaruq) 9,617 koz 5,012 koz
9,530 koz
1,999 koz
+217% +151% +90% +139%
+58%
5,020 koz
3,830 koz 2,100 koz
1,266 koz
2,800 koz
2005 2018 2007 2018 2010 2018 2006 2018 2011 2018
$186
$173
$121
$63
$54
$43
$29 $33
$14 $16
Purchase Discovery Purchase Discovery Purchase Discovery Purchase Discovery Purchase Discovery
For a full detailed description of mineral reserves and mineral resources please see the Company’s news release dated Februar y 14, 2019. Denver Gold Forum 22Near-Term Potential to Increase Life of Mine Production – 2021 to 2023
Evaluating several potential opportunities (none of which has yet been approved for construction, with the
exception of the construction of the new Kittila shaft) at a number of existing operations to build further value and
enhance the gold production profile in 2021 and beyond
Minesite/Region Opportunity
Evaluating phased development of LaRonde 3 (located below a depth of 3.1 km) where recent drilling
LaRonde Complex has resulted in significant mineral resource conversion. In addition, other production opportunities such
as Zone 11-3 are also being evaluated
LaRonde Zone 5 ("LZ5") Potential to mine additional ozs from LZ5 and other nearby satellite zones
Potential for increased throughput from Deep Zone 1 and potential for advanced development of Deep
Goldex
Zone 2. Also potential for increased gold production from the South Zone and Akasaba West
Canadian Malartic (50%) Potential production from Odyssey and East Malartic underground zones
Meadowbank Complex Potential to develop the higher grade underground deposits at Amaruq
Advancement of Phase 2 pit implementation and testing the depth and lateral extensions of the
Meliadine
Wesmeg, Normeg and Tiriganiaq zones
Expansion to 2.0 million tonnes per annum including optimization of the Rimpi and Sisar zones via the
Kittila
new shaft currently under construction
Pinos Altos/Creston Mascota Potential development of the Cubiro and Reyna de Plata satellite zones
La India Potential development of the El Realito and El Cochi satellite zones
Denver Gold Forum 23Project Pipeline Expected to Provide Further Production Growth Beyond 2023
Agnico Eagle has a strong pipeline of development projects that could provide further production growth
beyond 2023. These opportunities are typically at an earlier stage than those outlined in the previous slide
Minesite/Region Opportunity
Goldex Evaluation of the Deep 3 Zone (below 1,500 metres)
Evaluation of the potential for production from deeper portions of the Odyssey and East Malartic
Canadian Malartic (50%)
underground zones
Kittila Further optimization of underground mine and development of the lower mine with shaft access
Meadowbank Complex Continued evaluation of the regional potential at Amaruq
Meliadine Further drill testing of known zones and gold occurrences on the 80-kilometre-long greenstone belt
Barsele Testing additional mineralized zones and evaluation of production potential
Evaluation of known mineralized trends with a view to potentially restart operations at this past
Santa Gertrudis
producing heap leach mine
Potential production scenario at Upper Beaver and potential synergies from development of other
Kirkland Lake
properties such as Upper Canada
Hammond Reef Potential for production in a higher gold price environment
Denver Gold Forum 24Click to edit Master titleNorthern
style Business
Denver Gold ForumAbitibi Region
Production H1 2019 Production Highlights
and Costs
LaRonde
• To address wear related issues in the ore handling system at LaRonde, a previously reported, 10-day unplanned, underground
154,020 ozs maintenance shutdown occurred in May 2019
at a production cost of • Concurrent with the 10-day underground shutdown, a five-day planned mill maintenance shutdown occurred. In addition, there were four
$718/oz and total days of unscheduled maintenance on the LaRonde ball mill, for a total mill shutdown of nine days. These shutdowns resulted in lower
cash costs of $497/oz tonnes processed in Q2 2019
• In Q2 2019, the Quebec government granted authorization to combine the daily capacity at both the LaRonde & LaRonde Zone 5 mill
circuits, which increases production flexibility at the LaRonde Complex. Previously, ore milled at each operation had been accounted for
separately
Canadian Malartic (50%)
• Work on the Barnat extension project is on budget and on schedule. Work is primarily focused on the Highway 117 road deviation,
167,981 ozs overburden stripping and topographic drilling/rock excavation
at a production cost of • The highway deviation work re-started in Q2 2019 and is expected to be completed in Q4 2019. Production activities at Barnat are
$601/oz and total expected to begin in late 2019 (after completion of the highway deviation)
cash costs of $589/oz • Exploration programs are ongoing to evaluate several underground deposits to the east of the Canadian Malartic open pit, including the
Odyssey, East Malartic, Sladen and Sheehan zones. These opportunities have the potential to provide new sources of ore for the
Canadian Malartic mill
Goldex
• Gold production in Q2 2019 increased when compared to the prior-year period due to higher throughput levels as a result of higher
68,779 ozs utilization of the Rail-Veyor system, which achieved its best monthly production of ~5,500 tpd in June
at a production cost of • Mining in the South Zone continued in Q2 2019. Stopes mined to-date have shown better grades than expected and have confirmed
$572/oz and total dilution and recovery assumptions. ~1 stope/month from the South Zone is expected to be mined in H2 2019
cash costs of $574/oz • Evaluation of the potential for the South Zone to provide additional incremental ore feed to the mill continues
• Drilling at the Deep 2 Zone continued in Q2 2019, focusing on areas below the current mineral reserve limit of Level 130. A ventilation
upgrade was completed and the development of the exploration ramp for the Deep 2 Zone resumed in the Q2 2019
LaRonde Zone 5 (LZ5)
• Integration and pilot testing of automated mining equipment (two trucks and one scoop tram) continued in Q2 2019 and will be ongoing
29,158 ozs over the balance of the year. During Q2 2019, the Company tested autonomous mining at LZ5 on weekend night shifts when
underground activity was at reduced levels. Testing yielded favourable results as autonomous mucking and hauling of ore from
at a production cost of underground to surface was successfully achieved
$616/oz and total
cash costs of $733oz • Under the current LZ5 mine plan, a total of ~350koz of gold are expected to be mined through 2026. The Company is evaluating
scenarios to integrate the additional mineral reserves in the down plunge extension of the LZ5 deposit into the mine plan along with the
potential to process additional tonnage through the LaRonde Complex
For a full detailed description of mineral reserves and mineral resources please see the Company’s news release dated February 14, 2019. Denver Gold Forum 26Finland
Production H1 2019 Production Highlights
and Costs
Kittila
• During Q2 2019, a scheduled mill shutdown took place for a 58-day period to allow for full autoclave relining. The last full autoclave
69,413 ozs relining was carried out in 2013. During the mill shutdown, underground mining continued and generated a sizable surface stockpile
at a production cost of • The mill expansion is advancing as planned. During the scheduled mill shutdown in Q2 2019, tie-in work was completed
$859/oz and total cash
costs of $730/oz • The shaft project is ongoing with all segments of the raise boring completed in Q2 2019. In addition, slashing of the first section of the
raise boring was completed in July 2019. Raise boring of the ore silos is scheduled to be completed later in 2019 and construction of
the head frame is expected to begin in Q3 2019
Nunavut
Production H1 2019 Production Highlights
and Costs
Meadowbank
• Gold production in Q2 2019 decreased when compared to the prior-year period as expected due to anticipated lower grades from
80,812 ozs processing marginal ore stockpile as the mine transitions through the last few months of mining at the Meadowbank site
at a production cost of • At the end of Q2 2019, a test batch of low-grade Amaruq ore was processed in the mill confirming ore characteristics and recoveries.
$1,035/oz and total cash The 2koz of gold produced are included in the pre-commercial production
costs of $982/oz • Mining and milling activities at the Meadowbank site have been extended to Q3 2019, largely due to additional ore being sourced from
the Portage pit. Production at the Meadowbank mine in 2019 is now expected to be between 95k to 105koz gold, compared to the
previous guidance of 65koz
Meliadine
• Declared commercial production on May 14, 2019. After accounting for lower pre-commercial production gold sales (which would have
31,413 ozs offset some of the capital costs), total project construction costs (at the date of commercial production) were ~$830M (below the
forecast of $900M)
at a production cost of
$888/oz and total cash • Underground operations continued to ramp up and three mining horizons are now well established
costs of $850/oz • The process plant continues to ramp up towards nameplate capacity of 3,750 tpd. The plant has operated at up to 4,800 tpd (~4,000
tpd average in August). During Q2 2019, recoveries averaged 92.1%, which was slightly below guidance. Work is underway to increase
recoveries
• Production guidance (including pre-commercial production ounces) for 2019 remains unchanged at ~230koz gold
For a full detailed description of mineral reserves and mineral resources please see the Company’s news release dated February 14, 2019. Denver Gold Forum 27Click to edit Master title style
Southern Business
Denver Gold ForumMexico Operations
Production H1 2019 Production Highlights
and Costs
Pinos Altos
• Gold production in Q2 2019 decreased when compared to the prior-year period due to a decrease in tonnes stacked on the heap leach,
84,470 ozs partially offset by higher grades
at a production cost of • At Sinter, the development of the underground continued while ore production at the open pit began in Q2 2019
$721/oz and total
• At Cubiro, 417m of underground ramp development was completed in Q2 2019 (~1,155 m completed to-date)
cash costs of $545oz
• In 2018, the Company completed the installation of an ore sorting pilot plant at Pinos Altos. To-date, open pit ore from the Sinter deposit
has yielded favourable preliminary results. Similar ore sorting pilot testing is being considered at the Company's other operating regions
• Drilling extends the Reyna de Plata East Zone yielding 4.5 g/t gold and 92 g/t silver over 20.7m at 108m depth. At Cubiro, underground
delineation is underway to convert mineral resources to mineral reserves by year-end 2019
Creston Mascota
• Gold production in Q2 2019 increased significantly when compared to the prior-year period due to higher tonnes processed and higher
31,865 ozs grades. In addition, higher grade ore from the Bravo pit was processed at the Pinos Altos mill during Q2 2019. Quarterly production
levels are expected to be significantly lower in H2 2019 (more in line with 2019 production guidance)
at a production cost of
$591/oz and total • Due to the higher silver content in the ore mined and to enhance gold and silver recoveries, a sixth carbon column was installed in the
cash costs of $407/oz circuit and commissioned in Q2 2019
• 2019 is expected to be the last year of mining activities. Mining is expected to continue until Q4 2019 with leaching activities expected to
continue through 2020
La India
• Gold production in Q2 2019 decreased when compared to the prior-year period due to less tonnes stacked on the heap leach as a result
43,188 ozs of higher clay content in the ore mined. Belt agglomeration testing (adding cement to the ore at the transfer chutes) is currently underway
to help improve percolation of leach solutions on the heap leach pad
at a production cost of
$784/oz and total • The heap leach expansion project was completed during Q2 2019 and stacking of ore commenced
cash costs of $769/oz
• Detailed engineering is underway to optimize the crushing circuit to potentially increase capacity from 17k to 18k tpd
• Drilling extended the Chipriona polymetallic zone to the southeast. High-grade intercepts included 4.1 g/t gold and 190 g/t silver over
18.3m at 71m depth. Results of the 2019 drill program are expected to enhance the mineral resource estimate at year-end
For a full detailed description of mineral reserves and mineral resources please see the Company’s news release dated February 14, 2019. Denver Gold Forum 29Mexico Exploration and Development Projects
Exploration and Highlights
Development
El Barqueno
• Agnico Eagle acquired its 100% interest in the El Barqueno project in November 2014. The 79,746-hectare property is in the Guachinango gold-silver mining district
of Jalisco State in west-central, Mexico, approximately 150 kilometres west of the state capital of Guadalajara
• El Barqueno is estimated to contain 318,000 ounces of gold and 1.2 million ounces of silver in indicated mineral resources (8.1 million tonnes grading 1.22 g/t gold
and 4.63 g/t silver) and 322,000 ounces of gold and 4.6 million ounces of silver in inferred mineral resources (8.2 million tonnes grading 1.22 g/t gold and 17.45 g/t
silver).
• In 2018, 28,000 metres of drilling was completed at the El Barqueno project, with a principal focus on testing new target areas. Although the exploration results were
geologically encouraging, current development studies indicate that the project does not meet the Company's investment criteria. As a result, the carrying value of
the property has been reduced while exploration activity continues in 2019
Santa Gertrudis
• Agnico Eagle holds a 100% interest in the 42,000-hectare Santa Gertrudis gold property. Three favorable geological trends with a potential strike length of 18 km
have been identified with limited drilling between deposits
• Three favorable geological trends have been identified and at least nine mineralized zones with multiple deposits have been discovered to date
• Recent drill results, such as 8.2 g/t gold over 7.3m at 208m depth, have extended the Amelia deposit (in the Trinidad Zone) to 700m strike length and 450m depth; the
deposit remains open along strike and at depth
For a full detailed description of mineral reserves and mineral resources please see the Company’s news release dated February 14, 2019. Denver Gold Forum 30Click to edit Master title style Innovation
Denver Gold ForumInnovation Is an Area of Long Term Strategic Focus at Agnico Eagle
➢ Collaborating with industry to advance innovative solutions
➢ Examining and implementing multiple new (for Agnico Eagle) technologies
➢ LTE (Long Term Evolution) network: Improved wireless communication
• Currently deployed at LZ5 and automated mining equipment is
currently being tested
• LTE network was installed at LaRonde below level 269
– potential to test automated equipment by 2020
➢ Rail-Veyor: Lower cost ore transportation
• Deployed at Goldex, evaluating use at other mines
➢ Ore sorting: Improve quality of low-grade ore, convert waste to ore
• Pilot plant testing at Pinos Altos
➢ Mechanical cutting: Improve development rates at lower costs
• Closely following technology pilot to assess fit
➢ Energy management: Reduce cost and environmental footprint
• Examining renewable energy solutions in Nunavut and Mexico
Denver Gold Forum 32Agnico Eagle’s Global Approach to Energy Management
Developing a global approach for energy
management across Agnico Eagle’s operations to
reduce energy costs at select regions by up to
30% and lower greenhouse gas emissions
Areas of Study
➢ Nunavut
‒ Wind/Solar
‒ Liquefied Natural Gas (LNG)
‒ Hydro
‒ Southern power link
➢ Mexico
‒ Examining solutions (i.e. solar power) to
increase renewable sources of energy in
Mexico
Denver Gold Forum 33Click to edit Master title style
ESG Initiatives
Denver Gold ForumESG Risk Management Approach and Tools
Risk Management The foundation upon which we have built our capacity to manage the commitments
and Monitoring made in our Sustainable Development Policy.
System (RMMS)
Toward The Mining Association of Canada’s (MAC) TSM initiative promotes best practices
Sustainable Mining in environmental protection, energy efficiency, tailing management, community
(TSM) engagement, safety and transparency.
International A voluntary industry program for companies that use cyanide to recover gold. It
Cyanide Code focuses on the responsible and safe management of cyanide and cyanide solutions
used in gold mining, including the protection of human health and the reduction of
environmental impacts, through every stage of the mining process.
Voluntary Agnico Eagle has formally adopted the Voluntary Principles on Security and Human
Principles Rights (VP). Created in 2000, the VPs are standards to help extractive sector
companies balance the obligation to respect human rights while protecting the
assets and people at their operations.
Conflict-Free Gold Developed by the World Gold Council and based upon internationally-recognised
benchmarks, the Conflict-Free Gold Standard helps companies to provide
assurance that their gold is not contributing to conflict.
Stakeholder We have established a SAC to provide us with feedback on our corporate social
Advisory responsibility efforts and to complement and help us make strategic links to our
Committee (SAC) existing local stakeholder engagement activities.
Global Reporting Sets out specific criteria and indicators that organizations can use to measure and
Initiative (GRI) report on their economic, environmental and social performance.
Denver Gold Forum 35Committed to Continuous Improvement
in Sustainable Development
ENVIRONMENTAL SOCIAL GOVERNANCE
We act in a socially responsible
manner and contribute to the
We focus on limiting our environmental communities in which we operate We act in an ethically responsible
impacts by: manner and uphold our core values
• using natural resources efficiently We are committed to working with our using our:
• preventing or limiting emissions employees and other stakeholders to • Code of Business Conduct
• reducing waste create growth and prosperity • Ethics & anti-corruption, anti-bribery
policy
We identify, analyze and manage our We work in a transparent manner with • Our supplier code of conduct
environmental risks local stakeholders • Our SD policy
• Our Indigenous Peoples Engagement
We have established a committee to Policy
provide us with feedback on our • Our Diversity and Inclusion Policy
corporate social responsibility efforts
and to complement and help us make
strategic links to our existing local
stakeholder engagement activities
ACTIVE PARTICIPATION IN LEADING MANAGEMENT AND DISCLOSURE INITIA TIVES
RECOGNIZED BY INDEPENDENT ESG RATING & RESEARCH AGENCIES FOR OUR LEADING INDUSTRY PRACTICES
Denver Gold Forum 36ESG Risk Management Approach and Tools
Filtered tailings –Oberon Weber Canadian Malartic LaRonde Mine
Tailings Management
• Tailings storage facilities at all of our operating and closed sites meet or exceed regulatory
requirements, and we are continually improving the management of our facilities by developing and
incorporating best practices
• In 2018, an Accountable Executive Officer (AEO) was officially appointed by our Board of Directors
for Agnico’s Tailings Storage Facilities, Water Management Infrastructures, Rockfill Storage
Facilities and Heap Leach Facilities
• The AEO will report yearly to the Board of Directors on the management and safety of Agnico’s
facilities and whether Agnico’s operations have the tools, staff and budget to do their work properly
• Agnico Eagle is identifying, for all sites, specific Responsible Persons (RP), Engineers of Record
(EoR) and Independent Reviewers (IR). These different functions are key to ensuring that we have
in place the proper systems and processes to manage our risks responsibly
• 24% of our tailings returned underground in paste backfill
Find more information in our 2019 tailings summary report on our web page.
https://s21.q4cdn.com/374334112/files/doc_downloads/Sustainability/TM-Report/Agnico-Eagle-Summary-Tailings-Management-Report-June-2019.pdf
Denver Gold Forum 37Responsible Gold Mining Principles
Agnico Eagle is an active participant in this initiative
➢ An over-arching framework that sets out
clear expectations as to what constitutes
responsible gold mining.
➢ Designed to provide confidence to
investors, supply chain participants and
investors that gold has been produced
responsibly.
➢ Implementing companies will be
required to publicly disclose
conformance and obtain external
assurance on this.
➢ Reflects the commitment of the world’s
leading gold mining companies to
responsible mining.
Denver Gold Forum 38Click to Reserves
Mineral edit Master title
and style Resources
Mineral
Denver Gold ForumMineral Reserves - December 31, 2018
Denver Gold Forum 40Mineral Resources - December 31, 2018
MINERAL RES OURCES
As of December 31, 2018
OP ERAT ION MEAS URED INDICAT ED MEAS URED & INDICAT ED INFERRED
GOL D Mining Method Owners hip 000 T onnes g/t 000 Oz Au 000 T onnes g/t 000 Oz Au 000 T onnes g/t 000 Oz Au 000 T onnes g/t 000 Oz Au
LaR onde Underground 100% - - 4,872 3.25 509 4,872 3.25 509 5,494 4.95 874
LaR onde Zone 5 Underground 100% - - 6,796 2.34 510 6,796 2.34 510 2,985 5.19 498
Ellison Underground 100% - - 665 3.19 68 665 3.19 68 2,343 3.38 254
Canadian Malartic Open P it 50% 238 0.48 4 915 0.48 14 1,153 0.48 18 998 0.98 32
Canadian Malartic Underground 50% 1,647 1.49 79 6,426 1.66 342 8,073 1.62 421 1,694 1.38 75
Canadian Malartic T otal 1,885 1.36 83 7,341 1.51 356 9,226 1.48 439 2,692 1.23 107
Odyssey Underground 50% - - 1,009 2.11 68 1,009 2.11 68 11,498 2.19 809
East Malartic Underground 50% - - 5,265 2.13 361 5,265 2.13 361 22,021 1.98 1,403
Goldex Underground 100% 12,360 1.86 739 15,413 1.90 944 27,773 1.88 1,683 27,791 1.50 1,338
Akasaba West Open P it 100% - - 2,141 0.67 46 2,141 0.67 46 - -
Lapa Underground 100% - - - - - - - -
Zulapa Open P it 100% - - - - - - 391 3.14 39
Meadowbank Open P it 100% 25 0.96 1 1,728 2.35 130 1,752 2.33 131 63 2.05 4
Amaruq Open P it 100% - - 4,247 3.34 455 4,247 3.34 455 899 4.20 121
Amaruq Underground 100% - - 4,618 4.56 676 4,618 4.56 676 11,675 5.19 1,948
Amaruq T otal - - 8,865 3.97 1,132 8,865 3.97 1,132 12,573 5.12 2,069
Meadowbank Complex T otal 25 0.96 1 10,593 3.71 1,262 10,618 3.70 1,263 12,637 5.10 2,073
Meliadine Open P it 100% - - 10,643 3.51 1,200 10,643 3.51 1,200 997 4.60 148
Meliadine Underground 100% - - 15,319 4.02 1,979 15,319 4.02 1,979 12,482 6.11 2,450
Meliadine T otal - - 25,962 3.81 3,179 25,962 3.81 3,179 13,479 6.00 2,598
Hammond R eef Open P it 100% 165,662 0.70 3,724 42,754 0.57 777 208,416 0.67 4,501 501 0.74 12
Upper Beaver Underground 100% - - 3,636 3.45 403 3,636 3.45 403 8,688 5.07 1,416
AK P roject Underground 100% - - 1,268 6.51 265 1,268 6.51 265 2,373 5.32 406
Anoki-McBean Underground 100% - - 1,868 5.33 320 1,868 5.33 320 2,526 4.70 382
Upper Canada Open P it 100% - - - - - - 4,886 1.97 309
Upper Canada Underground 100% - - - - - - 7,212 6.22 1,442
Upper Canada T otal - - - - - - 12,098 4.50 1,752
Kittila Open P it 100% - - 229 3.41 25 229 3.41 25 373 3.89 47
Kittila Underground 100% 1,776 2.62 150 16,802 2.64 1,424 18,578 2.63 1,574 7,879 3.84 972
K ittila T otal 1,776 2.62 150 17,030 2.65 1,449 18,807 2.64 1,599 8,252 3.84 1,019
Kuotko Open P it 100% - - - - - - 284 3.18 29
Kylmäkangas Underground 100% - - - - - - 1,896 4.11 250
Barsele Open P it 55% - - 3,178 1.08 111 3,178 1.08 111 2,260 1.25 91
Barsele Underground 55% - - 1,158 1.77 66 1,158 1.77 66 13,552 2.10 914
B ars ele T otal - - 4,335 1.27 176 4,335 1.27 176 15,811 1.98 1,005
P inos Altos Open P it 100% - - 934 0.61 18 934 0.61 18 758 0.84 20
P inos Altos Underground 100% - - 18,165 1.84 1,073 18,165 1.84 1,073 4,041 2.17 282
P inos Altos T otal - - 19,098 1.78 1,091 19,098 1.78 1,091 4,799 1.96 302
Creston Mascota Open P it 100% - - 1,345 0.65 28 1,345 0.65 28 386 1.02 13
La India Open P it 100% 11,908 0.57 219 2,774 0.53 47 14,682 0.57 267 1,761 0.53 30
Tarachi Open P it 100% - - 22,665 0.40 294 22,665 0.40 294 6,476 0.33 68
Chipriona Open P it 100% - - - - - - 6,355 0.78 160
El Barqueño Gold Open P it 100% - - 8,115 1.22 318 8,115 1.22 318 8,200 1.22 322
S anta Gertrudis Open P it 100% - - - - - - 27,498 1.09 962
Totals Totals 193,615 0.79 4,916 204,946 1.89 12,475 398,562 1.36 17,390 209,232 2.69 18,122
S IL VER Mining Method Owners hip 000 T onnes g/t 000 Oz Ag 000 T onnes g/t 000 Oz Ag 000 T onnes g/t 000 Oz Ag 000 T onnes g/t 000 Oz Ag
LaR onde Underground 100% - - 4,872 25.34 3,969 4,872 25.34 3,969 5,494 14.31 2,528
Kylmäkangas Underground 100% - - - - - - 1,896 31.11 1,896
P inos Altos Open P it 100% - - 934 13.05 392 934 13.05 392 758 17.41 424
P inos Altos Underground 100% - - 18,165 42.42 24,771 18,165 42.42 24,771 4,041 49.16 6,387
P inos Altos T otal - - 19,098 40.98 25,163 19,098 40.98 25,163 4,799 44.15 6,811
Creston Mascota Open P it 100% - - 1,345 8.78 380 1,345 8.78 380 386 9.91 123
La India Open P it 100% 11,908 3.20 1,227 2,774 4.44 396 14,682 3.44 1,623 1,761 3.37 191
Chipriona Open P it 100% - - - - - - 6,355 89.63 18,312
El Barqueño S ilver Open P it 100% - - - - - - 4,108 127.97 16,901
El Barqueño Gold Open P it 100% - - 8,115 4.63 1,208 8,115 4.63 1,208 8,200 17.45 4,600
Totals Totals 11,908 3.20 1,227 36,205 26.73 31,116 48,112 20.91 32,343 32,998 48.41 51,362
COP P ER Mining Method Owners hip 000 T onnes % T onnes Cu 000 T onnes % T onnes Cu 000 T onnes % T onnes Cu 000 T onnes % T onnes Cu
LaR onde Underground 100% - - 4,872 0.16 7,582 4,872 0.16 7,582 5,494 0.24 13,248
Akasaba West Open P it 100% - - 2,141 0.40 8,511 2,141 0.40 8,511 - -
Upper Beaver Underground 100% - - 3,636 0.14 5,135 3,636 0.14 5,135 8,688 0.20 17,284
Chipriona Open P it 100% - - - - - - 6,355 0.19 11,787
El Barqueño Gold Open P it 100% - - 8,115 0.18 14,949 8,115 0.18 14,949 8,200 0.22 18,069
Totals Totals - - 18,764 0.19 36,177 18,764 0.19 36,177 28,736 0.21 60,388
ZINC Mining Method Owners hip 000 T onnes % T onnes Zn 000 T onnes % T onnes Zn 000 T onnes % T onnes Zn 000 T onnes % T onnes Zn
LaR onde Underground 100% - - 4,872 0.97 47,051 4,872 0.97 47,051 5,494 0.63 34,523
Chipriona Open P it 100% - - - - - - 6,355 0.79 50,400
Totals Totals - - 4,872 0.97 47,051 4,872 0.97 47,051 11,849 0.72 84,923
Mineral reserves are not a subset of mineral resources. Tonnage amounts and contained metal amounts presented in this table have been rounded to the nearest thousand, Denver Gold Forum 41
so aggregate amounts may differ from column totals.You can also read