DEPARTMENT OF TRANSPORT - Interim National Passenger Rail Plan 'Towards a National Passenger Rail Strategy'
←
→
Page content transcription
If your browser does not render page correctly, please read the page content below
DEPARTMENT OF TRANSPORT

    Interim National Passenger Rail Plan

‘Towards a National Passenger Rail Strategy’

                 June 2005
Department of Transport                                                  Interim National Passenger Rail Plan
                                                                                              Phase 1 Report

CONTENTS                                                                                            Page

PART 1:      INTRODUCTION, PURPOSE AND ORIENTATION                                                         1
Introduction                                                                                               1
Purpose                                                                                                    1
Background and Orientation                                                                                 1

PART 2:         SURVEY – BUSINESS AND MARKET REVIEW                                                        4

A. POLICY                                                                                                  4

1.              PASSENGER TRANSPORT POLICY REVIEW                                                          4
1.1             Introduction                                                                               4
1.2             Rail Policy Issues Internationally                                                         4
1.3             Broad National Policy Framework                                                            4
1.4             Transport Vision And Goals                                                                 4
1.5             Overview Of Policy Related To Passenger Rail Transport                                     5

B. INDUSTRY                                                                                                7

2.              PASSENGER RAIL FUNDING ANALYSIS                                                           7
2.1             Introduction                                                                              7
2.2             Background To Public Transport Funding Generally                                          7
2.3             Trends In Rail Passenger Subsidies                                                        8
2.4             The Current Funding Process                                                              10
2.5             Subsidies And The Analysis Of Revenues And Costs                                         11
2.6             Summary And Conclusions                                                                  19

3.              REVIEW OF COMMUTER TRAVEL DEMAND GENERALLY                                               20
3.1             Summary And Introduction                                                                 20
3.2             Main Findings                                                                            21

4.              ANALYSIS OF COMMUTER RAIL USAGE AND USER ATTITUDES                                       25
4.1             Introduction                                                                             25
4.2             Rail Usage Based On Census Data                                                          25
4.3             The Rationale For Improving Service Quality                                              25
4.4             Rail Customer Profile And Needs                                                          25
4.5             Improving The Quality Of Rail Service                                                    26
Department of Transport                                                           Interim National Passenger Rail Plan
                                                                                                       Phase 1 Report

                5.                           THE ROLE OF SARCC IN RAIL PASSENGER TRANSPORT
                                                                                        30
5.1             Introduction                                                            30
5.2             Strategic Planning                                                      30
5.3             Asset Management – Rolling Stock And Infrastructure                     31
5.4             Compliance/Performance Monitoring                                       31
5.5             Marketing And Communication                                             32
5.6             Property Management – Intersite                                         32

6.              REVIEW OF EXISTING COMMUTER RAIL BUSINESS PERFORMANCE                                             34
6.1             Introduction                                                                                      34
6.2             Metrorail Operating Performance                                                                   34
6.3             Infrastructure Performance                                                                        36
6.4             Rolling Stock Performance                                                                         41

7.              REVIEW OF COMMUTER RAIL ASSET DEPLOYMENT, CONDITION AND
                PERFORMANCE                                                                                       45
7.1             Introduction                                                                                      45
7.2             Rolling Stock                                                                                     45
7.3             Permanent Way                                                                                     45
7.4             Electrical Systems                                                                                46
7.5             Signals                                                                                           46
7.6             Telecommunications                                                                                46
7.7             Station And Station-Related Facilities                                                            47

8.              REVIEW OF LONG DISTANCE PASSENGER RAIL BUSINESS                                                   49
8.1             Introduction                                                                                      49
8.2             Business Focus Of Shosholoza Meyl                                                                 49
8.3             Market Share                                                                                      49
8.4             Delivery Structure                                                                                50
8.5             Operational Performance                                                                           51
8.6             Financial                                                                                         52
8.7             Capital Requirement                                                                               53

PART 3:         ANALYSIS OF BUSINESS PROSPECTS                                                                    55

9.              ANALYSIS OF THE ROLE OF RAIL IN MEETING NATIONAL AND REGIONAL
                PASSENGER MOVEMENT REQUIREMENTS                                                                   55
9.1             Introduction                                                                                      55
9.2             Multi-criteria Matrix Method Of Analysis                                                          55
9.3             Results Of Analysis – Priority Corridors Identified                                               60
9.4             Implications Of The Analysis For The Railplan                                                     61

10.             THE CASE FOR RAIL – A PROPOSED STRATEGY                                                           61
10.1            Introduction – Strengths And Weaknesses Of Rail                                                   66
10.2            Criteria For Developing Strategy Options                                                          66
10.3            Defining The Options                                                                              68
10.4            ‘Full Recovery’ - restore the whole network to full efficiency                                    68
10.5            ‘Limited System’ – retain only near-commercial services                                           69
10.6            ‘Priority Rail Corridors’ – focus resources where rail performs best                              70
10.7            Recommended Strategy                                                                              73
10.8            Key Decisions/Interventions To Secure The Priority Rail Corridors Strategy                        73
Department of Transport Interim National Passenger Rail Plan
Phase 1 Report
PART 4: THE PASSENGER RAIL BUSINESS PLAN
75
A. COMMUTER (URBAN) RAIL BUSINESS 75
11. OVERALL FRAMEWORK OF THE PASSENGER RAIL BUSINESS PLAN 75
11.1 Structure 75
12. STABILISATION PLAN – ACTIONS TO SECURE FEASIBLE SHORT TERM GOALS, BY
REGION AND CORRIDOR 78
12.1 Introduction And Context 78
12.2 Structure Of The Stabilisation Plan 78
12.3 Operational Issues 79
12.4 Financial Issues: 79
13. SUSTAINING THE BUSINESS – ACTIONS TO CONSOLIDATE FEASIBLE BUSINESSES,
BY REGION AND CORRIDOR 81
14. GROWING THE BUSINESS – ACTIONS WHERE FUTURE DEVELOPMENT MAY BE
BUILT UPON A STABILISED AND SECURED RAIL BUSINESS 82
14.1 Introduction 82
14.2 The use Of PPP’s 82
B. LONG DISTANCE PASSENGER RAIL BUSINESS 84
15. SHORT, MEDIUM AND LONG TERM PROPOSALS FOR THE LONG DISTANCE
PASSENGER RAIL BUSINESS 84
15.1 Introduction 84
15.2 Short Term Issues 84
15.3 Sustaining The Business 84
15.4 Growing The Business 84
PART 5: INDUSTRY STRUCTURE PROPOSALS 86
16. IMPLICATIONS FOR INDUSTRY STRUCTURE 86
16.1 Business Consolidation And Industry Structure 86
16.2 Institutional/Regulatory Structure 87
16.3 Relationship Between A New Rail Entity And Transport Authorities 87
16.4 Long Term Sustainability Of The Railplan 88Department of Transport Interim National Passenger Rail Plan
Phase 1 Report
PART 1: INTRODUCTION, PURPOSE AND ORIENTATION
Introduction
In November 2004, the South African Rail Commuter Corporation (SARCC) appointed
consultants to develop an Interim National Rail Passenger Plan, (referred to throughout this
report as the ‘Railplan’). Arup SA (Pty) Ltd, the Project Coordinator, has prepared this
compendium report, drawing together its own technical work and that of the other members of
the consultancy team: Arcus Gibb, Khuthele Projects, and Stewart Scott International.
Parts 1 and 2 of the report cover the principal findings of the Survey stage of the work. Part 3
reports the Analysis of the collected information, and Parts 4 and 5 are the Interim Railplan
proposals and implications for industry structure, respectively.
The report represents the collective efforts and findings of the entire consultancy team
although Arup has exercised the principal editorial responsibility.
Purpose
The original purpose of the assignment was to prepare a comprehensive internal business plan
for the SARCC. In the event the scope has been extended and refocused because the
Department of Transport (DOT) needed to align the Railplan process with the proposed
merger between SARCC and the commuter rail operator, Metrorail. A review of the long
distance rail business, currently offered through Spoornet’s Shosholoza Meyl service was also
brought into the scope of the Railplan work by DOT.
The project is divided into two phases. The present document reports on Phase 1. This phase
was required to provide as much technical analysis as possible within the time available in
support of a recommended strategic direction for the passenger rail industry.
Although this Phase 1 report is the ‘Interim National Rail Passenger Plan’, its findings at the
strategic level, dealing with the general direction to be taken by the passenger rail industry in
South Africa, should be regarded as robust. The findings of the report will nevertheless be
subjected to a comprehensive consultation process with all stakeholders in Phase 2.
The detailed implications of these conclusions for different operating regions and their
emerging Transport Authorities will be consulted and further developed in Phase 2 of the
Railplan between June 2005 and December 2005. Details of capital and operating budgets by
corridors, routes and lines will also be developed in detail in Phase 2.
Background and Orientation
The following factors are part of the background to the Railplan:
x Long term trends in land uses are resulting in travel patterns that in many circumstances
cannot be effectively met by the rail mode;
x Insufficient funding for the recapitalisation of ageing rolling stock and signalling systems
has recently necessitated a substantial reduction in passenger rail service levels
x To improve service delivery in these circumstances SARCC requires strategic direction
from government. The Railplan aims to provide the basis for this direction.
Page 1Department of Transport Interim National Passenger Rail Plan
Phase 1 Report
Long term travel trends
South Africa has particularly low-density patterns of residential and commercial development.
This is testimony in part to its geographical endowment of an abundance of space, and also to
the socio-political heritage of separate development.
Whilst rail can be, and still is, an effective mode of passenger transport between dense
population nodes, less dense patterns of development are less suitable for service by a fixed
track mode of transport. The intrinsic flexibility of road-based modes of transport present
makes it very difficult for the relatively fixed network rail mode to compete effectively.
Most cities accept the need for densification and restructuring of their land-use developments
if public transport is to become more viable. The form-giving characteristics of rail transport
can contribute substantially to this. However, low-density land use patterns cannot be easily
changed by transport planning policy. If these benefits are to be achieved the rail industry
may need focus all its attention in those areas where it has an advantage over other modes.
The Analysis section of this report outlines a method of identifying such areas of advantage.
Funding uncertainties
South Africa is not unique in experiencing a funding crisis in its rail industry. While there is
almost always a degree of managerial and structural inefficiency in public utility services, the
funding crisis in the railway industry worldwide is partly a result of its technological
complexity compared to the more flexible for road-based public transport modes.
Rail transport can play a socio-economic role in providing accessibility to work and other
services for lower income population groups and others who do not have access to other
modes of transport. This needs to be considered in any assessment of the value of rail.
It is nevertheless a simple public financing reality that road transport generally realises more
than sufficient in tax revenues to governments to cover the cost of its infrastructure. Whether
governments re-allocate all such revenues to the providing tax constituency is separate issue
not addressed here. Rail passenger transport systems rarely if ever generate tax revenues and
their operating revenues are often insufficient to cover as much as half of their operating costs
let alone major maintenance and development costs. While this fact cannot constitute an
excuse for inefficient financial management, it is an important element in any attempt to
understand what is an endemic funding problem in the rail industry worldwide.
Need for strategic direction
There are examples in other countries where this endemic funding and efficiency problem has
been overcome. This generally occurs where a passenger railway has been able:
To demonstrate its value to a broad spectrum of the population of an urban area;
To be visibly efficient in the delivery of its services
To thus entrench support for the railway in the political expression of the voters, and
hence create the political commitment to the necessary public funding.
In summary, a strategic balance is created between the consumers, politicians and railway
management in an equilibrium that ensures appropriateness, efficiency and funding.
This document reviews the context, the technical state and the funding situation of the
passenger rail industry in South Africa in order to map out a future strategy. It recognises that
in order to bring greater funding certainty to the industry it will be essential to identify those
circumstance in which the rail mode performs best. Resources may then be concentrated on
making these parts of the network as successful as possible.
Page 2Department of Transport Interim National Passenger Rail Plan
Phase 1 Report
DIVIDER PAGE
Page 3Department of Transport Interim National Passenger Rail Plan
Phase 1 Report
PART 2: SURVEY – BUSINESS AND MARKET REVIEW
A. POLICY
1. PASSENGER TRANSPORT POLICY REVIEW
1.1 Introduction
Rail passenger transport in South Africa is facing major challenges, necessitating a total new
approach towards the way it is managed and the manner in which it conducts its business. The
need is particularly relevant in the light of the proposed merger of SARCC, Metrorail and
Shosholoza-Meyl, and also the establishment of the metropolitan Transport Authorities.
This chapter reviews national and other level policies relevant to the passenger rail industry,
commenting on their adequacy in the face of current circumstances. In the context of this
report, this review is linked to the survey of rail transport usage and user attitudes covered in
Chapter 4. Some implications of these reviews for rail transport policy and for the structuring
of a future passenger rail industry are then addressed in Part 5 (Chapter 16) of the report.
As with many parts of this report, this chapter is a condensed version of a more detailed
analysis of current policy, which is contained in a separate workstream report.
1.2 Rail Policy Issues Internationally
A broad scan of international policy topics dealing with rail passenger transport revealed that
similar generic issues are addressed in most instances. Rail passenger transport is generally
not financially sustainable without government assistance. Rail transport is, therefore, often
viewed as an essential social service and economic enabler that is to the good of society as a
whole. This is supported by the lower environmental impact, larger capacities and the spatial
form-giving characteristics of an effective and efficient passenger rail transport system.
Government intervention is often motivated by control of the fare levels for political and
social purposes. This results in an acceptance that rail services need to be subsidised.
Various models of government involvement and intervention are found internationally, and
these tend to change over time. In the 1980’s and 1990’s, a great drive to increase private
sector involvement was found in many countries in the world.
1.3 Broad National Policy Framework
The national government’s broad economic and social policy context for transport is contained
in policy documents such as the Reconstruction and Development Programme, and the ANC
Election Manifesto. More recent Government policy advocates job creation, poverty
alleviation and economic development and – to some extent - the notion of the involvement of
the private sector in what was previously typically the domain of Government.
The concept of user charging and the promotion of public transport above private transport
also remains an objective in most of the relevant policy documents.
1.4 Transport Vision And Goals
The transport vision and goals for the country are contained in the Department of Transport’s
1996 White Paper on National Transport Policy and also the National Land Transport
Transition Act (NLTTA) of year 2000. The earlier White Paper remains as valid today as
when the it was drafted. Its main features have been worked out in more detail in a working
Page 4Department of Transport Interim National Passenger Rail Plan
Phase 1 Report
document/policy process entitled ‘Moving South Africa’, (MSA) which was published in
1999. The general policy vision is repeated below, and provides the link between the broad
national policy framework and specific transport policy as discussed later.
Provincial and municipal policy guidelines indicate general support of the national vision.
The stated national vision for transport in South Africa is to:
“Provide safe, reliable, effective, efficient, and fully integrated transport operations and
infrastructure which will best meet the needs of freight and passenger customers at improving
levels of service and cost in a fashion which supports government strategies for economic and
social development whilst being environmentally and economically sustainable.”
1.5 Overview Of Policy Related To Passenger Rail Transport
1.5.1 Promotion of Public Transport
The promotion of public transport is considered to be of much greater importance than in the
past by all levels of government. This is reflected in current transport policies and legislation.
However, not much has changed over the last decade in terms of the upgrading of services or
facilities. A number of public transport projects in the Western Cape and Gauteng seem to
indicate that, at least at provincial and municipal levels, government are becoming committed
to improve and invest in public transport operations and infrastructure / facilities.
1.5.2 The role of rail
All policy sources acknowledge a role for passenger rail within a hierarchy of transport modes.
The National White Paper in its transport vision, states that: “Rail is seen as an essential
long-term component of the network for both freight and passenger transport”.
At the provincial level, it is especially those provinces with large urban areas where rail is seen
to play an important role and therefore requiring a special provincial initiative. Metropolitan
municipalities, on the other hand, differ in their acknowledgement of the role of rail. This is
mainly due to the fact that the rail function still resides with national government. Ekurhuleni,
as an example, in its first phase rail commuter plan, refers to rail as the “backbone of its
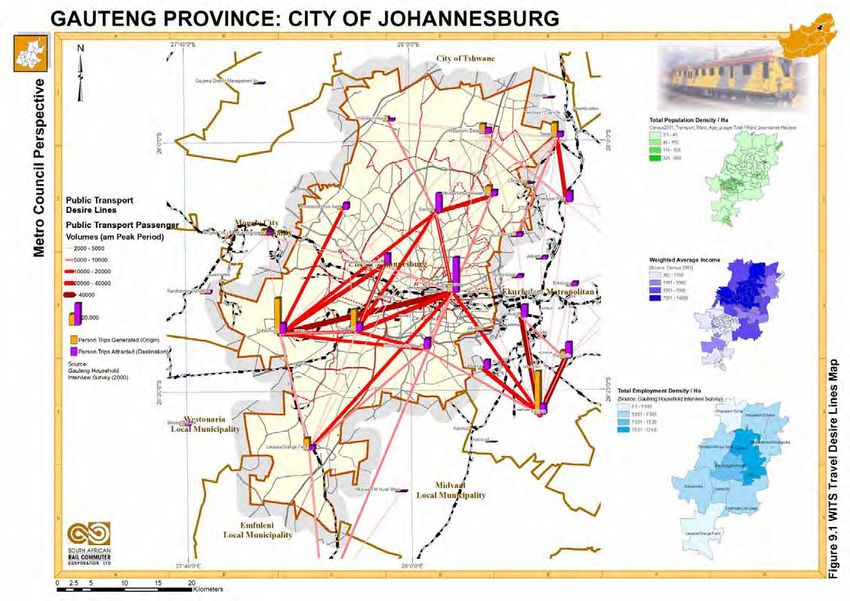
transport system”. In contrast, the City of Johannesburg has little reference to the rail
passenger system in its Integrated Transport Plan (ITP).
1.5.3 Planning for passenger rail services
Current official policy is for rail passenger planning to be done at the municipal level as part
of their ITP. This national requirement has, however, been given varied levels of attention in
the ITPs prepared to date. Most ITP’s or other planning documents regard rail as an important
part of their integrated public transport system. Concerns are expressed that municipalities do
not have effective powers in connection with planning of rail. Some municipalities such as
Cape Town, Ethekwini and Ekurhuleni have indeed formulated rail strategies for their areas,
while Tshwane’s ITP expresses the need to develop a Rail Master Plan.
The question can be asked whether it is a practical arrangement to require a municipal
authority to do the planning for a service over which it has no control,. Effective integration of
rail planning is an issue that needs to be addressed in Phase 2 of the Project. Part 5 gives a
strategic framework for such integrated planning.
1.5.4 Land-use developments at stations
There is a growing realisation that poor town planning is one of the most important reasons for
ineffective and unsustainable public transport, resulting in high public transport costs. This is
also very difficult to turn around. The NLTTA encapsulated the White Paper policy into the
legislative framework and is equally strong on land use and transport integration. The answer
Page 5Department of Transport Interim National Passenger Rail Plan
Phase 1 Report
to this problem is seen by the MSA: Action Agenda as the densification of transport corridors.
It suggests that: “the densities created by corridor enhancement lower system cost, not just
for transport but also for other infrastructure.”
1.5.5 Formalisation, regulation and control
The NLTTA covers the formalisation, regulation and control of public transport. The White
Paper and NLTTA allow for competition for a route through tendered contracts, in order to
ensure that unnecessary competition is eliminated. For this reason minibus-taxi can be
included to compete for the awarding of contracts for public transport services, provided that
all tender requirements are met. Many planning authorities are not clear how rail transport is
to be treated in this regard.
1.5.6 Funding
The section on funding in the NLTTA is in many quarters considered to be disappointing as
there are no specific provisions for the generation of additional moneys over and above the
“normal” allowance for the transfer of funds appropriated by Parliament or an applicable
provincial legislature. The NLTTA also did not establish a dedicated fund similar to the
Urban Transport Fund established by the Urban Transport Act.
Despite the fact that the NLTTA does not bring much financial relief to local government for
improving their transport systems, substantial amounts of subsidy money is being appropriated
by Parliament for state subsidised bus services and for commuter rail.
A more thorough comparison of the relative costs of rail and road-based public transport
modes of transport is needed to give government a rational basis for future funding. This issue
is addressed to some extent in Phase 1 (see for example Chapter 2 below and the separate
Funding Analysis report). Phase 2 will address the question of financial values and external
economic benefits in much greater detail.
1.5.7 Private sector involvement
Private sector involvement in urban transport has been widely used in an international context
to enhance the quality of service and the efficiency by which it is provided. MSA as a result
made a strong case for greater levels of private sector involvement in many parts of the
transport sector and specifically in commuter rail. MSA did not specify exactly what the
institutional arrangement for this should be, but emphasized the role of Government in
overseeing, planning and co-ordinating private sector involvement, such as through franchises
or concessions.
The Business Plan proposals in Chapters 11-14 make some suggestions along these lines.
1.5.8 Public transport subsidies
Currently, public transport subsidies funded from the national budget are paid to support
commuter rail and bus services, for the benefit of commuters travelling within or between
urban areas. The rationale for payment of such subsidies is mainly equity reasons, i.e. the
relief of the distance burden to commuters from dislocated communities. However, it could
be argued that commuter rail subsidies to some extent also contribute toward poverty
alleviation and the promotion of more efficient transport in urban areas.
In terms of the current policy in the White Paper a large number of potential beneficiaries in
South Africa are currently not benefiting from the subsidy system. The basic mobility needs of
many of these beneficiary groups that often do not travel every day, such as the pensioners, the
unemployed, work-seekers or subsistence farmers in rural areas, who have extremely limited
financial means to pay for transport, are not met. By implication, this raises a number of
issues about the scope and targeting of transport subsidies.
Page 6Department of Transport Interim National Passenger Rail Plan
Phase 1 Report
B. INDUSTRY
2. PASSENGER RAIL FUNDING ANALYSIS
2.1 Introduction
The purpose of this section is to provide an overview of the funding arrangements of the South
African Rail Commuter Corporation (SARCC) and Metrorail. It is not intended to be a
detailed financial audit of either of these organisations. In the context of the short timescale
allocated to Phase 1 of the development of the Interim National Rail Passenger Plan (the
Railplan) this was not feasible.
The report specifically covers:
x Some background to public transport funding generally;
x Trends in rail passenger subsidies;
x The institutional basis for the current rail subsidy and investment processes;
x A review of the costs, revenues and the applications of subsidies including a reconciliation
of the flow of funds between the Department of Transport (DOT) SARCC and Metrorail;
x Some conclusions based on the information presented.
2.2 Background To Public Transport Funding Generally
Within the overall funding constraints, growing demand on the South African government’s
annual budget for the provision of goods and services for public consumption make it essential
that the best value for money is provided. This includes the bus and rail public transport
subsidies provided by government, and particularly in the various metropolitan areas where
there are significant commuter volumes.
With growing road congestion in cities, governments around the world find themselves under
pressure to increase spending on public transport. At the same time governments need to be
able to demonstrate good value for public expenditure by ensuring that politically agreed
social objectives are addressed in a cost effective manner. The South African government is
therefore not unique in experiencing a predicament of funding with regard to its public
transport objectives. This is especially true in regard to the country’s commuter railway
industry.
There are almost invariably significant elements of managerial and structural inefficiency in
public utility services and these are referred to in this report. Yet the global trend, especially
in developing countries, away from rail and towards road-based modes of public transport
suggests that institutional and structural issues are not the only problem. It is rather a case that
rail transport’s relatively fixed network does not have the flexibility to respond to rapidly
changing patterns of development.
While improved financial and structural efficiency is always possible, the more appropriate
response to the position that it frequently finds itself in may be for rail passenger transport to
discover the circumstances in which it can still operate relatively efficiently, and concentrate
business attention in those areas.
This review of passenger rail funding should be viewed against this broad background. The
National Rail Passenger Plan (Railplan) project represents the Department of Transport’s
(DOT) commitment to set a future direction of passenger rail that a address these concerns.
Page 7Department of Transport Interim National Passenger Rail Plan
Phase 1 Report
2.3 Trends In Rail Passenger Subsidies
The aim of this chapter is to make a number of general, but reliable, comments about the value
for money obtained through the subsidy paid for commuter rail.
There are two parts to the chapter:
x Trends in rail subsidy levels and trends in rail patronage levels;
x The implications for possibly future rail subsidy levels if government were to address the
deficit in funding that would be needed to restore the rail network as it currently stands.
2.3.1 Subsidy performance of commuter rail
In the year 2002/03 the commuter rail industry received an operating subsidy of R1.5 billion
plus capital grants for the heavy maintenance rolling stock and infrastructure of some R700
million, making for a total government contribution of R2.2 billion in that year. The industry
was responsible for 465 million passenger trips in 2002/03 at an average trip length of 27km.
Table 2.1 indicates this data in terms of subsidy value per trip and per passenger kilometre.
Table 2.1: Subsidy per passenger trip and passenger/km for subsidised rail, 2002/03
Mode Rands per …
Passenger trip Passenger-km
Op subsidy only Op + cap subsidy Op subsidy only Op + cap subsidy
Rail
3.23 4.73 0.12 0.18
Trends in rail commuter subsidies are shown in Figure 2.1 for 2000 to 2004. The rail subsidy
includes both the operational subsidy and the capital grants received by the SARCC.
Figure 2.1: Rail Subsidy Trends
Rail Subsidy: Operating and Capital
2 500 000 Rail Operating Subsidy
Subsidy (R'000)
2 000 000
1 500 000
Total Rail Operating
1 000 000 and Capital Grant
Subsidy Budget
500 000
-
2000/2001 2001/2002 2002/2003 2003/2004
Financial Year
Page 8Department of Transport Interim National Passenger Rail Plan
Phase 1 Report
The figure shows that:
x There is an increasing trend in rail subsidies;
x The commuter rail operating subsidy reached R1.6bn in the 2003/2004 financial year,
while the total rail subsidy was approximately R2.4bn;
x The average annual rail increase is 7.9 % pa for the operational and capital grant subsidies
taken together. Compared to the CPIX for the same period of approximately 6.8% per
annum this shows a real increase in rail subsidy of 1.1%.
Figure 2.1 does not reveal that within the general increase in the level of the rail subsidy, the
capital grant element has grown considerably faster than the CPIX. (Capital spend on rail is
discussed in more detail in Chapters 6 and 7 of the main Railplan report).
2.3.2 Rail passenger trends
The increasing subsidy levels for commuter rail should be considered against the trends in
commuter rail passengers. Figure 2.2 shows the trend in annual commuter rail passenger
volumes over the period 1999 to 2003. The figure clearly shows the decreasing trend in the
number of rail passenger trips per annum to the latest available levels of approximately 465m
in 2002/2003. (In 1980, there were approximately 680m commuter rail trips, albeit in the
absence of the taxi mode at that stage).
This decreasing trend should be seen against the increasing trend in rail subsidy. In strict
financial terms at least, this indicates a declining trend in value for money for commuter rail
transport. This is one factor, amongst others that is considered in the overall review of
passenger rail in the main Railplan report.
Figure 2.2: Annual Rail Passenger Trends
Annual Rail Passengers
Millions of Passengers per
500
490
480
Annum
Annual Rail
470
Passengers
460
450
440
9
0
1
2
3
99
00
00
00
00
/1
/2
/2
/2
/2
98
99
00
01
02
19
19
20
20
20
Financial year
Note: Recently received data for years 2003/04 and 2004/05 shows an increase in passenger
numbers back to about the same level as 2000/2001. When compared to the increased
operational and capital subsidy levels, (see Figure2.1) the rising trend in unit costs for rail
is continuing.
Page 9Department of Transport Interim National Passenger Rail Plan
Phase 1 Report
The national mode share for rail is only 4% of all trips (including bus, taxi and private modes)
for 2002. As a further insight into the overall mode share for commuter rail, the average
morning peak period mode share for the 6 metropolitan regions in which commuter rail
services are provided is 20.5% of all public transport trips (i.e. bus, taxi and rail). The much
higher proportion of market share (approximately 60%) that commuter rail enjoys in Cape
Town bolsters this. If the Cape Town mode share is removed from the average, the rail share
for the public transport modes’ morning peak drops to 12.6% in the remaining five regions.
2.4 The Current Funding Process
The commuter rail funding process is shown in Figure 2.3.
Figure 2.3: Commuter Rail Funding Process
Department of Transport
(DoT)
Provision of Operating
Subsidy and Capital Grants
Own Funding
Sources, e.g. Property SARCC (“Owner”)
Development
Provision of Capital and
Operating Subsidy
Own Funding
Sources, e.g. Fare
Revenue
Metrorail (“Operator”)
It is important to note that while both the SARCC and Metrorail depend materially on the
operational and capital subsidies from the DOT, both organisations have their own sources of
funding that are used to reduce the overall subsidy requirement from the state.
For the SARCC these include revenue sources such as property development and access
charges to Spoornet for use and rental of commuter rail facilities. For Metrorail these sources
include fare revenue and advertising.
The budgeting process requires both SARCC and Metrorail to prepare detailed separate
operating and capital budgets on an annual basis. The budgets are submitted annually to the
DoT, where they are evaluated. Based on overall government budgetary constraints, the annual
operating and capital grant subsidies are then finalised and approved by central government.
The money flow then occurs as per the above flow chart.
It is important to note that the subsidy paid to SARCC and Metrorail are ‘supply’ budgets, not
‘demand’ budgets, i.e. they are based on what is affordable to central government, not what is
required to optimally plan, manage and provide rail services. This is an important distinction,
and explains to some extent the reason for the under funding of commuter rail operations in
South Africa.
Page 10Department of Transport Interim National Passenger Rail Plan
Phase 1 Report
2.5 Subsidies And The Analysis Of Revenues And Costs
2.5.1 Operating Revenues and Costs
2.5.1.1 SARCC Revenues and Costs
Table 2.2 provides a summary of the annual operating subsidy provided by the DOT to
SARCC and the allocation made to Metrorail over the period 2002/2001 to 2003/2004.
Table 2.2: Total Annual Operational Subsidy 2000/2001 to 2003/2004 (R billion)
2000/2001 2001/2002 2002/2003 2003/2004
Total Operating Subsidy
1.372 1.366 1.545 1.678
Received by SARCC
Metrorail Operating
1.342 1.326 1.410 1.583
Subsidy
It is important to note that the Metrorail subsidy shown in Table 2.2 includes a management
fee paid to Transnet that covers the Transnet support and management costs for Metrorail.
As indicated previously, both the SARCC and Metrorail have other income sources that
support day-to-day operations. The following tables reflect these other income sources as well
as the operating costs of both organisations.
Table 2.3: SARCC Revenues and Costs 2000/2001 to 2003/2004 (R’000)
Revenues / Expenses (R’000 ) 2000/2001 2001/2002 2002/2003 2003/2004
Total Operating Subsidy 1 372 000 1 366 250 1 545 919 1 678 840
SARCC Other Income 200 806 214 792 231 406 245 174
SARCC Sundry Income 2 890 3 792 52 616 23 639
SARCC Total Income 1 575 696 1 584 834 1 829 941 1 947 653
SARCC Operating Expenses* 1 758 219 1 900 014 2 035 175 2 207 286
SARCC Deprecation Charge 226 443 226 443 226 443 204 214
SARCC Net Income 43 920 -88 737 21 209 -55 419
* Includes subsidy and management fee passed to Metrorail
Table 2.3 shows that the received operating subsidy is approximately 86% of the SARCC’s
total revenue in 2003/2004, although the majority of the received subsidy is passed through to
Metrorail.
The SARCC operating expenses are summarised in Table 2.4 and shows that the Metrorail
subsidy and management fee equates to 76% of SARCC’s total expenditure.
Page 11Department of Transport Interim National Passenger Rail Plan
Phase 1 Report
Table 2.4:SARCC Operating Expenses (R’000)
Expense 2000/2001 2001/2002 2002/2003 2003/2004
Depreciation charge 175 113 237 372 226 443 204 214
Loss on Disposal of Assets - 153 1 578 9 159
Insurance Claims 64 640 82 847 110 776 111 704
Insurance Premiums 31 371 37 712 52 807 56 424
Metrorail Subsidy & Management
1 342 006 1 326 802 1 410 964 1 583 032
fee
Infrastructure Assets Rental - 37 500 37 500 37 500
Other Expenses 12 888 25 150 22 951 16 671
Property portfolio Expenses 106 218 125 106 138 526 148 020
Personnel Costs 25 983 27 372 33 630 40 562
Total: 1 758 219 1 900 014 2 035 175 2 207 286
The breakdown of SARCC operational expenditure is shown in Figure 2.4. It is based on the
average expenditure per cost item over the period 2000/2001 to 2003/2004.
Figure 2.4: SARCC Average Expenditure Patterns 2000 – 2004 (%)
SARCC Expenditure Patterns VAT Payable
0.3%
(2000-2004) 1.3%
Spoornet Rental
0.3%
0.3% 6.2%
0.8% Spoornet Rates & Docs.
1.2%
23.1%
Spoornet Station Maintenance
16.1%
Census
Project R&D
Concessioning Consultation
Fees
Group Operating Expenses
19.7% Rolling Stock Heavy Repairs
Insurance Claims & Premiums
31.0%
Property Expenses
Figure 2.4 shows:
x A significant proportion of expenditure on rolling stock heavy repairs (31%)
x A very high level of expenditure on insurance premiums and claims at 23% of expenditure
Page 12Department of Transport Interim National Passenger Rail Plan
Phase 1 Report
x Significant expenditure on maintaining the property portfolio (20%)
x Group operating expenses making up 16% of all costs
2.5.1.2 Metrorail Revenues and Costs
The Metrorail revenues and costs are shown in Table 2.5.
Table 2.5:Metrorail Revenues and Costs 2000/2001 to 2003/2004 (R’000)
Revenues / Expenses (R‘000) 2001/2002 2002/2003 2003/2004
Operational Subsidy 1 326 802 1 410 964 1 583 032
Fare Revenue 777 760 866 715 938 561
Other Income 71 897 87 580 53 987
Total Income 2 176 459 2 365 259 2 575 580
Operating Expenses 1 836 656 2 020 762 2 192 962
Metrorail Net Income/(Loss) from Operations 147 446 60 295 22 383
Net Finance Income / (Costs) 13 927 8 064 5 929
Net Profit/(Loss) 161 373 68 359 28 312
Table 2.5 shows that in 2003/04, the operational subsidy is some 60% of total revenue. Fare
revenue equals about 60% of the subsidy. Reduction of fare evasion can thus be seen to have
an important impact on the total revenue. Operating expenses are shown in Table 2.6.
Table 2.6: Metrorail Expenditure 2000/2001 to 2002/2003 (Rand)
Cost Allocation 2000/2001 2001/2002 2002/2003
Head Office 300 406 760 220 868 793 203 968 312
Regional Overheads 20 132 740 39 333 660 97 118 624
Rolling Stock 218 673 849 259 723 154 252 178 102
BBS Civil 45 721 610 57 219 921 60 887 789
BBS Electrical 14 492 772 20 216 274 20 599 460
Permanent Way 142 218 315 155 568 784 161 990 320
Electrical 209 141 970 213 546 779 203 499 457
Signalling 64 124 615 63 898 452 114 208 641
Train Operations 352 860 462 361 714 755 395 869 149
Stations Operations 267 359 353 268 665 343 275 442 413
Security 141 234 931 182 697 046 179 075 195
Total 1 776 367 376 1 843 452 962 1 964 837 461
Figure 2.5 is an analysis of Metrorail’s average expenditure over a period of three years.
Page 13Department of Transport Interim National Passenger Rail Plan
Phase 1 Report
Figure 2.5: Metrorail Expenditure Patterns 2000 – 2002 (%)
Metrorail Expenditure Patterns (2000 - 2002)
Head Office
Regional Overheads
9.01% 12.99%
Rolling Stock
2.80%
14.53% BBS Civil
BBS Electrical
13.08%
Permanent Way
2.93% Electrical
19.88% Signalling
0.99%
Train Operations
4.34% 8.23%
Stations Operations
11.21% Security
Figure 2.5 shows:
x Approximately 33% of expenditure was on train and station operations
x Regional head office and overheads of approximately 16%
x The sum of civil, electrical, perway and signalling expenditure was 28%
x Rolling stock maintenance of 13%
x Security 9%
Based on the income statement expenditure report, the Metrorail expenses are shown in the
following chart, Figure 2.6 This provides a different breakdown of Metrorail expenses;
offering further insight into expenditure patterns.
Figure 2.6: Metrorail Income Statement Expenditure Proportions for 2004 (Rand)
Page 14Department of Transport Interim National Passenger Rail Plan
Phase 1 Report
MANPOWER
Metrorail Expenditure Proportions 2004
MATERIAL
-0.19% ENERGY COSTS
0.29% 0.20%
0.61% RENTAL
1.45%
1.41% MAINTENANCE
8.59%
2.25% VEHICLES
2.58%
2.53% COMMUNICATION
PROFESSIONAL SERVICES
10.69%
53.64% SECURITY
1.38% HEALTH AND RISK SERVICES
9.38% TRAVEL AND ACCOMODATION
5.20% OFFICE EXPENDITURE
PUBLICATIONS AND PRINTING
INTEREST AND PENALTIES
SUNDRY EXPENDITURE
Figure 2.6 shows that manpower costs makes up the most significant proportion of Metrorail
costs, albeit that the organisation has significant senior technical manpower shortages.
Maintenance and energy costs make up 10.7% and 9% respectively, with security being the
last large cost component at approximately 8.6%.
2.5.2 Capital Grants/Subsidies
2.5.2.1 General Analysis
Grants and subsidies relating to capital expenditure are also provided to the SARCC. These
grants and subsidies are typically project specific, and relate mainly to new asset planning,
purchases, expansion and renewal projects. Associated costs such as professional fees are also
included in these subsidies and grants.
The breakdown of capital subsidies and grants received by the SARCC between 2001 and
2003 are shown in Table 2.7.
Table 2.7: Capital Subsidies and Special Grants - 2001/1002 and 2003/2004 (R’000)
Capital Subsidy / Grant 2001/2002 2002/2003 2003/2004
Capital Subsidy 490,200 663,000 665,000
Capital Grant 36,776 60,600 49,414
Total 526,976 723,600 714,414
The capital subsidy for 2004/2005 is in the order of R700m.
The total of the subsidies and grants for capital and operational expenditure purposes provided
by the DOT for commuter rail services are thus:
Page 15Department of Transport Interim National Passenger Rail Plan
Phase 1 Report
x 2001/2002: R1.893bn
x 2002/2003: R2.269bn
x 2003/2004: R2.393bn
Because the capital grants and subsidies are project specific and the projects typically run over
several financial years, the funds for these projects are rolled over the full life of the projects.
SARCC raises interest revenues from the unused portion of the funds in a particular year.
A significant proportion of the capital subsidy has been spent on the SARCC’s rolling stock
renewal program. This program has been designed to renew the rolling stock fleet over a 10-
year period, with the objective of having 4,500 reliable coaches at the end of this period.
In 2003/2004 a total of R400m was spent on this program, or 60% of the total capital grant of
R665m in that year. In the same financial year, R80m (12%) was spent on infrastructure
upgrades, including signalling (R46m), perway (R21m), electrical supply (R12m), and
bridges, structures and communication R2m. The balance of the subsidy was allocated to other
costs such as professional fees, as well as rolled over into the next financial year.
It is planned that the expenditure on the rolling stock renewal program will accelerate
significantly over time, with approximately R780m being spent in 2004/2005.
While the above capital expenditure of R480m is a significant sum of money, it represents
only 8% of the book value of the assets, and less than 1% of the asset replacement value.
The levels of investment in new assets, and asset renewal vary significantly as a proportion of
asset book value and replacement value, but the above levels are low and based on
international standards should be closer to 10% of replacement value, or some R6 billion per
annum in order to maintain the asset value effectively.
2.5.2.2 Capital Project Breakdown
As indicated, the capital subsidies and grants are used to fund specific projects, normally over
a number of years, depending on the nature of the project. The following table provides a
breakdown of the capital investment projects as at March 2004. The table shows a summary of
the total project cost, the total spend to March 2004, and the anticipated expenditure for 2005,
2006 and 2007.
Table 2.8 shows a total capital expenditure value budget of R6.7bn, with a total of R1.7bn of
this having already been spent by March 2004. The total spend in 2004/2005 is planned to be
R1.08bn, with a significant increase in 2005/2006 to R1.8bn.
The most significant projects in this program are:
x The rolling stock renewal program at R4.42bn (R1.22bn spent by March 2004);
x Signaling upgrades at R771m, R221m of which has already been spent.
Page 16Department of Transport Interim National Passenger Rail Plan
Phase 1 Report
Table 2.8: SARCC and Metrorail Capital Expenditure Projects and Values (R’000)
Total Planned Planned
Total Project Expenditure
Project Description Expenditure Expenditure Expenditure
Cost 2004/2005
to March ‘04 2005/2006 2006/2007
METRORAIL
PROGRAMS
Various Programme
2 000 - 2 000 - -
Managers - Sub Total
IT Support Services - Sub
2 557 - 2 557 - -
Total
Metrorail Regional Projects -
103 998 27 998 75 098 - -
Sub Total
Department: Human
2 035 - 2 035 - -
Resources - Sub Total
Chief Executive Officer - Sub
5 000 - 5 000 - -
Total
Metrorail Projects Total 115 590 27 998 86 690 - -
SARCC Asset Management
& Development Projects
Rolling Stock Renewal - Sub
4 418 610 1 233 523 779 663 1 110 692 903 633
Total
Bridges & Structures - Sub
14 400 - 60 14 340 -
Total
Perway -Sub Total 202 153 34 670 6 655 66 149 81 829
Signals -Sub Total 712 641 220 891 23 906 67 654 254 873
Electrical – Sub Total 211 430 16 706 13 072 52 455 103 297
Telecommunications - Sub
91 946 2 197 3 710 45 032 41 006
Total
IT & Systems - Sub Total 145 782 44 590 76 655 19 537 5 000
Infrastructure - Sub Total 207 441 12 475 6 603 137 353 51 009
SARCC Asset Management
& Development Projects - 6 004 403 1 565 052 910 324 1 513 212 1 440 647
Total
INTERSITE PROGRAMS
Intersite Projects - Sub Total 521 186 101 950 62 139 259 797 97 301
INTERSITE - TOTAL 521 186 101 950 62 139 259 797 97 301
METRORAIL MINOR
PROJECTS
Metrorail Minor Projects 2 750 - 950 1 800 -
IT & Systems -Sub Total 9 200 - 4 000 5 200 -
METRORAIL - TOTAL 11 950 - 4 950 7 000 -
SARCC RAIL STRATEGY
& DEVELOPMENT
Network Planning &
25 373 78 625 16 251 8 419
Development - Sub Total
SARCC Programme Office -
20 000 - 20 000 - -
Sub Total
RAIL STRATEGY &
45 373 78 20 625 16 251 8 419
DEVELOPMENT - TOTAL
GRAND TOTAL 6 698 502 1 695 078 1 084 728 1 796 260 1 546 367
Page 17Department of Transport Interim National Passenger Rail Plan
Phase 1 Report
The extent of the under-funding of the rail assets has been assessed by SARCC. This is shown
in Table 2.9. It is important to note that the funding of the rolling stock renewal program has
been estimated beyond 2006.
Table 2.9: Asset Renewal Budgets and Requirements (R million)
Asset group 2005/2006 2006/2007 2007/2008 2008/2009
Rolling Stock
Budget 1 100 903 1 000 1 000
Requirement 1 583 1 833 2 394 2 336
Signaling, Perway,
telecoms, Electrical,
stations
Budget 200 216 233 252
Requirement 296 392 411 494
2.5.3 Total Spend on Rail
Table 2.10 provides a summary of the total income for commuter rail every year, including all
sources of revenue, i.e. i.e. all internal and external revenue streams. This gives what, in
effect, is the full cost of running the existing commuter rail service.
Table 2.10: Total SARCC and Metrorail Income from All Revenue Sources (R billion)
Capital
SARCC Metrorail
Year DOT Subsidy Subsidies & Total Income
Other Income Other Income
Grants
2001/2002 1.366 0.218 0.849 0.526 2.961
2002/2003 1.545 0.284 0.954 0.723 3.506
2003/2004 1.678 0.268 0.992 0.714 3.654
2.5.4 Asset Values
The book value of the SARCC assets as at the end of the 2003/2004 financial year is R5.79bn.
This is significantly less than the estimated replacement costs of these assets of R60bn.
This large discrepancy reflects the low levels investment in new asset procurement, asset
renewal and heavy (capital like) maintenance of assets.
Page 18Department of Transport Interim National Passenger Rail Plan
Phase 1 Report
2.6 Summary And Conclusions
This review of the funding structure and value for money in the commuter rail sector has
highlighted the following issues:
x Past and current levels of operational subsidy and capital grant are insufficient to halt the
declining levels of service, decreasing patronage and deteriorating asset conditions.
x The level of capital expenditure as a proportion of the book value of the assets is
approximately 15% (i.e. approximately R1bn per annum versus R6bn). This is relatively
low, and also explains the deteriorating condition of the assets (particularly rolling stock).
Moreover, when considering the replacement value of the assets estimated at R60bn, this
level of investment is extremely low (1.7%).
x The under expenditure on commuter rail assets over at least the last decade now means
that the commuter passenger railway is being provided at subsidy level far lower than is
actually needed to maintain efficient, effective and safe services.
x The skewed expenditure pattern in Metrorail toward manpower costs (53%) is partly a
consequence of the underinvestment in rolling stock and infrastructure maintenance. It
also reflects the fact that many of the maintenance and operational systems which might
be automated in more modern rail networks, are still manual in Metrorail;
x A more typical expenditure pattern based on international rail systems would look like:
o 35% on infrastructure operations, maintenance and renewal, including security;
o 30% to rolling stock maintenance and renewals;
o 25% to operations staff (drivers, conductors, station staff, operators, etc)
o 10% for head office staff
x From a financial perspective there is an urgent need to develop and apply the Railplan in a
way that identifies where best value for money can be obtained for rail transport, and
perhaps giving way to other modes in circumstances that are less suited to rail.
x This plan needs to take into account alternative approaches to raising money especially for
the very urgent issue of rolling stock refurbishment. Chapters 12-14 of this report take
this issue further and Phase 2 of the Railplan will be considering a number of models for
bringing private sector funds into the industry.
x In order to improve operational and financial efficiency a more focussed approach to
determining service priorities will need to be developed. This will require a much more
detailed understanding of rail service costing by route/corridor than has been possible in
Phase 1. Phase 2 of the Railplan should focus on preparation of budgets for staffing,
rolling stock and infrastructure maintenance by region, and route.
x Phase 2 should also undertake a detailed review of existing capital budgeting in order to
assess the extent to which refocusing of expenditure priorities may be able to bring about
early efficiency improvements. This analysis should be undertaken in conjunction with
the relevant rail industry players in order that conclusions reached are owned and
implemented immediately.
Page 19Department of Transport Interim National Passenger Rail Plan
Phase 1 Report
3. REVIEW OF COMMUTER TRAVEL DEMAND GENERALLY
3.1 Summary And Introduction
The aim of this chapter is to present an overview of the role of rail in the context of travel
patterns generally. The background to the chapter is the recognition that rail forms only a part
of the total picture of passenger travel and that optimisation of its role requires an appreciation
of the role of the other modes as well.
A comprehensive analysis of the roles of different transport modes would need a modelling
approach. In the context of the present project, timescales did not permit this. Moreover, the
different municipalities are at different stages of redeveloping their multi-modal transport
models and so it would have been very difficult to obtain consistency of approach.
The review of travel patterns and mode use undertaken for this Phase 1 work is therefore
based primarily upon the results of home interview surveys and conducted by the various
municipalities.
As well as analysing existing travel patterns by mode this chapter also considers a potential
future role for rail transport. This is not based on detailed demand forecasting but rather on
the expressed intentions of local authorities in their Integrated Development Plans (IDPs) and
Integrated Transport Plans (ITPs). These offer a framework within which, in future, it may be
possible to once again expand the role of rail transport.
It should be noted that the analysis of rail’s potential presented here needs to be viewed in the
context of all other parts of this report, especially Chapters 9 and 10 that seek to define a
future role for rail based on multi-criteria analysis.
The planning for rail and other transport modes is in the future likely to be in the hands of the
emerging Transport Authorities and consequently their potential role is considered. At present
planning for the development of the rail network is undertaken by the SARCC and its
approach is briefly reviewed here.
Although this chapter focuses primarily on the national picture, it is based upon detailed
analysis that has been undertaken for the six metropolitan areas:
x City of Tshwane
x City of Johannesburg
x Ekurhuleni
x City of Cape Town
x Ethekwini
x Nelson Mandela
A less detailed review of the following Major District Municipalities was also covered:
x Buffalo City
x Sedibeng
x West Rand
x Metsweding
Page 20Department of Transport Interim National Passenger Rail Plan
Phase 1 Report
3.2 Main Findings
3.2.1 National Overview of Passenger Rail Transport
Historically rail infrastructure in South African was designed to link major cities. Limited
suburban services and extensions into townships served the urban community by linking
residential areas to the major centres of economic activity – mostly industrial areas and CBD.
During this earlier era mobility of the population in terms of private vehicle ownership was
low and rail played a very prominent role in the establishment of the urban structure.
At the time most of the cities also developed as single nodal cities with the CBD being the
main/only activity centre comprising of retail, office, social and recreational activities. It was
convenient to serve these areas with rail as the destinations (activity nodes) were limited in
number and spatially well-defined.
The situation has, however, changed dramatically over the past thirty years, for various
reasons such as lack of funding for transport and rail, and the decentralisation of CBD’s to
suburban areas better served by car. As a result the current situation reflects a metropolitan
railway network which has been outgrown by rapid urban development. It has become the
transport medium for the poor with its main function being to carry large volumes of
disadvantaged people to their workplace during the morning peak, and back home during the
afternoon peak.
Outside these two peak periods the rail network is significantly under-utilised. It plays
virtually no part in serving urban activities for the remainder of the day e.g. school/university
trips, shopping trips, social trips to clinic, library, sport etc.
Physically the rail system has also become more isolated from the surrounding urban fabric.
Along railway corridors virtually all buildings are orientated away from the railway lines
(along freeways competition is very tough to obtain visual exposure to the freeway). Railway
stations have become mono-functional precincts within neighbourhoods, industrial areas and
business areas. It is merely a modal transfer facility attracting only people who want to make
use of the train.
3.2.2 Rail Demand in the Context of Overall Transport Trends
According to national transport statistics provided by the DOT, commuter rail has accounts for
4% of the total annual commuter demand, although 9% of respondents mention rail as the
preferred mode. Even in terms of preferred mode the share of rail is the least of all modes.
Table 3.1 below gives the modal split for the country as a whole based on a national random
sample, as reported in the DOT’s Annual Transport Statistics.
TABLE 3.1: NATIONAL MODAL SPLIT FOR VEHICULAR MODES
Preferred Mode Usage by Main Mode
Main Mode
(%) (%)
Taxi 22 43
Bus 31 12
Train 9 4
Private/other 37 41
Total 100 100
Source: Annual Transport Statistics 2002
It is important to note that this data presents the aggregated national picture only. The
situation varies considerably by region (see Table 3.2) and also by individual rail route or
corridor.
Rail passenger numbers have declined from 681 million per annum in 1980 to 491 million in
2004/2005. The steepest decline was during the 1980s. This was followed by a slow increase
Page 21Department of Transport Interim National Passenger Rail Plan
Phase 1 Report
through the mid 1990s to 507 million in 1998/99. Since then passenger numbers have
fluctuated between 470 and 490 million..
The rapid growth of minibus taxis since the 1980’s and its personalised service has been a
significant factor in the shift from both the subsidised bus and rail modes to taxi.
The competition between the private car, bus, taxi and train modes in terms of their relative
levels of services and costs resulted in a declining mode share for public transport generally,
and within the public transport market, the emerging dominance of the mini-bus taxi.
Table 3.2 gives the morning peak period modal split of motorised modes for each of nine
municipalities. The share of rail varies between 1% and 33 %. Rail has the highest share in
Cape Town, where it is also the dominant mode, and the lowest in Nelson Mandela.
Public transport’s mode share varies between 46% and 68%, with the highest share being in
Buffalo City and Ethekwini municipalities, and the lowest in the West Rand, Tshwane and
Johannesburg.
TABLE 3.2: MODAL SPLIT BY REGION
Authority % Car % Train % Taxi % Bus % Public % Total
City of Johannesburg 54 7 35 5 46 100
City of Tshwane 54 10 23 14 46 100
Ekurhuleni 39 10 49 2 61 100
Metsweding 68 1 22 9 32 100
Sedibeng 39 6 44 11 61 100
West Rand 59 4 32 6 41 100
Gauteng 50 8 36 6 50 100
Ethekwini (2 hours count) 36 13 32 19 64 100
City of Cape Town 44 33 14 8 56 100
Nelson Mandela 46 1 39 14 54 100
Buffalo City 32 4 59 5 68 100
Source: Annual Transport Statistics 2002
3.2.3 Potential Development Role of Rail in the South African Urban Context?
Notwithstanding the declining trend of usage, there are reasons to think that rail may face an
opportunity to change this situation, if current land use planning policies were to be backed by
higher investment in rail transport.
The new political dispensation in South Africa brought about a total reorientation in the way
town planners look at the urban environment and the way it is being planned.
At national level, government promulgated the Development Facilitation Act (DFA) (Act 67
of 1995) which put forward a set of Land Development Principles to guide urban and rural
land use processes in South Africa. At the core of the DFA lies the concept of the compact
city which focuses on promoting high density, mixed land uses, the optimum utilisation of
existing infrastructure rather than creating new; the integration of historically segregated
communities, and a general focus towards densification, intensification, infill development and
redevelopment within the existing urban fabric. In line with this concept most South African
metropolitan areas have now adopted an Urban Edge to contain urban sprawl and to promote
the general densification of the urban fabric.
Section 4 of the NLTTA supports this notion and requires that land transport functions be
integrated with land use and economic planning through measures such as corridor
development, densification and infilling and that transport planning must guide land use and
development planning.
Page 22You can also read