Determination of vadose zone and saturated zone nitrate lag times using long-term groundwater monitoring data and statistical machine learning - HESS
←
→
Page content transcription
If your browser does not render page correctly, please read the page content below
Hydrol. Earth Syst. Sci., 25, 811–829, 2021
https://doi.org/10.5194/hess-25-811-2021
© Author(s) 2021. This work is distributed under
the Creative Commons Attribution 4.0 License.

Determination of vadose zone and saturated zone nitrate lag times
using long-term groundwater monitoring data and
statistical machine learning
Martin J. Wells2,a , Troy E. Gilmore1,2 , Natalie Nelson3,4 , Aaron Mittelstet2 , and John K. Böhlke5
1 Conservation   and Survey Division, School of Natural Resources, University of Nebraska – Lincoln,
Lincoln, NE 68583, USA
2 Biological Systems Engineering Department, College of Engineering, University of Nebraska – Lincoln,

Lincoln, NE 68583, USA
3 Department of Biological and Agricultural Engineering, North Carolina State University, Raleigh, NC 27695, USA
4 Center for Geospatial Analytics, North Carolina State University, Raleigh, NC 27695, USA
5 U.S. Geological Survey, Reston, VA 20192, USA
a currently at: Natural Resources Conservation Service Field Office, Redmond, OR 97756, USA

Correspondence: Troy E. Gilmore (gilmore@unl.edu)

Received: 15 April 2020 – Discussion started: 5 May 2020
Revised: 9 December 2020 – Accepted: 27 December 2020 – Published: 19 February 2021

Abstract. In this study, we explored the use of statistical        previous observations of relatively high water fluxes and
machine learning and long-term groundwater nitrate moni-           short transit times for water and nitrate in the primarily oxic
toring data to estimate vadose zone and saturated zone lag         aquifer. Partial dependence plots from the model indicate a
times in an irrigated alluvial agricultural setting. Unlike most   sharp threshold in which high groundwater nitrate concentra-
previous statistical machine learning studies that sought to       tions are mostly associated with total travel times of 7 years
predict groundwater nitrate concentrations within aquifers,        or less, possibly reflecting some combination of recent man-
the focus of this study was to leverage available ground-          agement practices and a tendency for nitrate concentrations
water nitrate concentrations and other environmental vari-         to be higher in diffuse infiltration recharge than in canal leak-
ables to determine mean regional vertical velocities (trans-       age water. Limitations to the machine learning approach in-
port rates) of water and solutes in the vadose zone and satu-      clude the non-uniqueness of different transport rate combi-
rated zone (3.50 and 3.75 m yr−1 , respectively). The statis-      nations when comparing model performance and highlight
tical machine learning results are consistent with two pri-        the need to corroborate statistical model results with a robust
mary recharge processes in this western Nebraska aquifer,          conceptual model and complementary information such as
namely (1) diffuse recharge from irrigation and precipita-         groundwater age.
tion across the landscape and (2) focused recharge from leak-
ing irrigation conveyance canals. The vadose zone mean ve-
locity yielded a mean recharge rate (0.46 m yr−1 ) consistent
with previous estimates from groundwater age dating in shal-       1   Introduction
low wells (0.38 m yr−1 ). The saturated zone mean velocity
yielded a recharge rate (1.31 m yr−1 ) that was more consis-       Nitrate is a common contaminant of groundwater and surface
tent with focused recharge from leaky irrigation canals, as        water that can affect drinking water quality and ecosystem
indicated by previous results of groundwater age dating in         health. Predicting responses of aquatic resources to changes
intermediate-depth wells (1.22 m yr−1 ). Collectively, the sta-    in nitrate loading can be complicated by uncertainties related
tistical machine learning model results are consistent with        to rates and pathways of nitrate transport from sources to re-
                                                                   ceptors. Lag times for the movement of non-point source ni-

Published by Copernicus Publications on behalf of the European Geosciences Union.
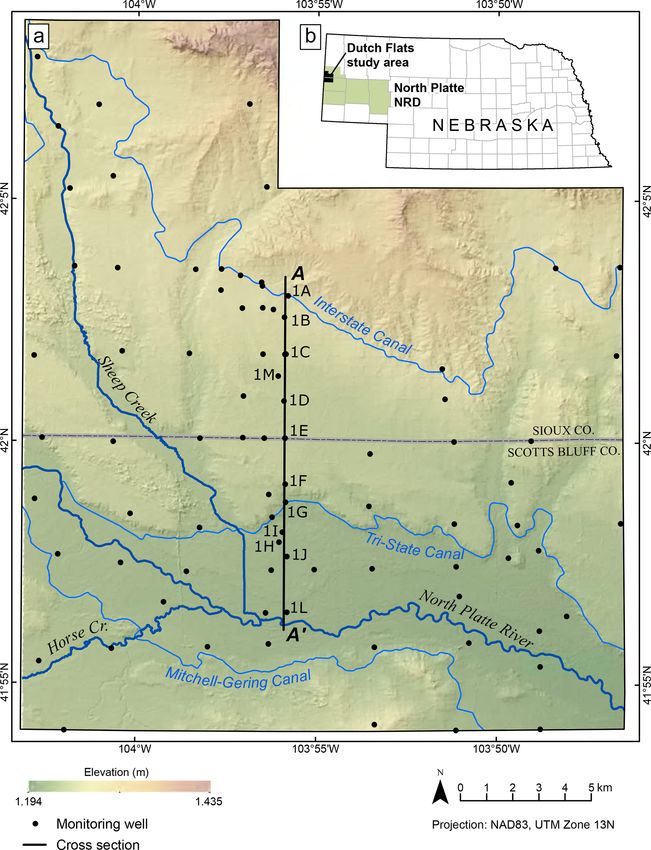
812                                    M. J. Wells et al.: Determination of vadose zone and saturated zone nitrate lag times

trate contamination through the subsurface are widely rec-          also sought to integrate vertical transport model parameters
ognized (Böhlke, 2002; Meals et al., 2010; Puckett et al.,          and outputs to evaluate nitrate-related predictors, including
2011; Van Meter and Basu, 2017) but difficult to measure.           vadose zone travel times (Nolan et al., 2018).
Vadose (unsaturated zone) and groundwater (saturated zone)             The objective of this study is to test a data-driven approach
lag times are of critical importance for monitoring, regulat-       for estimating vadose and saturated zone transport rates and
ing, and managing the transport of contaminants in ground-          lag times for an intensively monitored alluvial aquifer in
water. However, transport timescales are often generalized          western Nebraska (Böhlke et al., 2007; Verstraeten et al.,
due to the coarse spatiotemporal resolutions in data available      2001a, 2001b; Wells et al., 2018). Results are compared to
for groundwater systems being impacted by agricultural ac-          the hydrogeologic and mechanistic understanding from pre-
tivities (Gilmore et al., 2016; Green et al., 2018; Puckett et      vious groundwater studies to determine the strengths and
al., 2011), which results in a simplified groundwater man-          weaknesses of the approach as (1) a stand-alone technique or
agement approach. Regulators and stakeholders in agricul-           (2) as an exploratory analysis to guide or complement more
tural landscapes are increasingly in need of more precise and       complex physically based models or intensive hydrogeologic
local lag time information to better evaluate and apply reg-        field investigations.
ulations and best management practices for the reduction of
groundwater nitrate concentrations (e.g., Eberts et al., 2013).
   Field-based studies of lag times (time required for wa-          2     Methods
ter to move through both the vadose zone and saturated
zone) commonly use vadose zone sampling and/or expen-               2.1    Site description
sive groundwater age-dating techniques to estimate nitrate
transport rates moving into and through aquifers (Böhlke            The Dutch Flats study area is in the western Nebraska coun-
et al., 2002, 2007; Böhlke and Denver, 1995; Browne and             ties of Scotts Bluff and Sioux (Fig. 1). The North Platte
Guldan, 2005; Kennedy et al., 2009; McMahon et al., 2006;           River delivers large quantities of water for crop irrigation to
Morgenstern et al., 2015; Turkeltaub et al., 2016; Wells et         this region and runs along the southern portion of this study
al., 2018). Detailed process-based modeling studies focused         area. Irrigation water is diverted from the North Platte River
on lag times require complex numerical models combined              into three major canals (Mitchell–Gering, Tri-State, and In-
with spatially intensive and/or costly hydrogeological obser-       terstate) that feed a network of minor canals. Several pre-
vations (Ilampooranan et al., 2019; Rossman et al., 2014;           vious Dutch Flats area studies have investigated groundwa-
Russoniello et al., 2016). Thus, efficient but locally appli-       ter characteristics and provided thorough site descriptions
cable modeling approaches are needed (Green et al., 2018;           of the semiarid region (Babcock et al., 1951; Böhlke et al.,
Liao et al., 2012; Van Meter and Basu, 2015). In this study,        2007; Verstraeten et al., 2001a, 2001b; Wells et al., 2018)
an alternative data-driven approach (random forest regres-          The Dutch Flats area overlies an alluvial aquifer character-
sion) leverages existing long-term groundwater nitrate con-         ized by unconsolidated deposits of predominantly sand and
centration (hereafter referred to as NO−  3 ) data and easily ac-   gravel, with the aquifer base largely consisting of consoli-
cessible environmental data to estimate vadose and saturated        dated deposits of the Brule, Chadron, or Lance formations
zone vertical velocities (transport rates) for the determination    (Verstraeten et al., 1995; Fig. 2). Irrigation water not derived
of subsurface lag times.                                            from the North Platte River is typically pumped from the al-
   Statistical machine learning methods, including random           luvial aquifer or water-bearing units of the Brule Formation.
forest, have been used successfully for modeling NO−      3 dis-       The total area of the Dutch Flats study area is roughly
tribution in aquifers (Anning et al., 2012; Juntakut et al.,        540 km2 , of which approximately 290 km2 (53.5 %) is agri-
2019; Knoll et al., 2020; Nolan et al., 2014; Ouedraogo et al.,     cultural land (cultivated crops and pasture). Most agricultural
2017; Rodriguez-Galiano et al., 2014; Rahmati et al., 2019;         land is concentrated south of the Interstate Canal (Homer et
Vanclooster et al., 2020; Wheeler et al., 2015), but there has      al., 2015). Due to the combination of intense agriculture and
not been robust analysis of model capabilities for estimat-         low annual precipitation, producers in Dutch Flats rely on a
ing vadose and/or saturated zone lag times. Proxies for lag         network of irrigation canals to supply water to the region.
time, such as well screen depth, have been used as predic-          From 1908 to 2016, a mean precipitation of 390 mm was
tors in random forest models (Nolan et al., 2014; Wheeler et        measured at the nearby Western Nebraska Regional Airport
al., 2015). Decadal lag times have been suggested from us-          in Scottsbluff, NE (NOAA, 2017).
ing time-averaged nitrogen inputs as predictors (e.g., 1978–           While some groundwater is withdrawn for irrigation and
1990 inputs vs. 1992–2006 inputs) and by comparing their            some irrigated acres in the study area are classified as
relative importance in the model (Wheeler et al., 2015). The        commingled (groundwater and surface water source), Scotts
application of similar machine learning methods suggested           Bluff County irrigation is mostly from surface water sources.
that groundwater age could be used as a predictor to improve        Estimates determined every 5 years suggest that surface wa-
model performance (Ransom et al., 2017). Hybrid models,             ter provided between 76.8 % and 98.6 % of the total water
using both mechanistic models and machine learning, have            withdrawals from 1985 to 2015, which is about 92 % on

Hydrol. Earth Syst. Sci., 25, 811–829, 2021                                           https://doi.org/10.5194/hess-25-811-2021
M. J. Wells et al.: Determination of vadose zone and saturated zone nitrate lag times                                                  813

Figure 1. Dutch Flats study area (a) overlain by 30 m digital elevation model (DEM; USGS, 1997). The study area is located within the
North Platte Natural Resources District of western Nebraska (b). Depending on data availability, multiple wells (well nest) or a single well
may be found at each monitoring well location. Transect A–A0 represents the location and wells displayed in the Fig. 2 hydrogeologic cross
section.

average (Dieter et al., 2018). Canals transport water from              2010; Luckey and Cannia, 2006). Leakage estimates from a
the North Platte River to fields throughout the study area,             downstream section of the Interstate Canal (extending to the
most of which are downgradient (south) of the Interstate                east of the study area; Hobza and Andersen, 2010) suggest
Canal. Mitchell–Gering, Tri-State, and Interstate canals are            fluxes ranging from 0.08 to 0.7 m d−1 through the canal bed.
the major canals in Dutch Flats, with the latter holding the            Assuming a leakage of 0.39 m d−1 over the Interstate Canal
largest water right of 44.5 m3 s−1 (NEDNR, 2009). Leakage               bed area (16.8 m width × 55.5 km length) within Dutch Flats
from these canals provides a source of artificial groundwa-             yields 4.1 × 10⁵ m3 d−1 of leakage. Applied over an average
ter recharge. Previous studies estimate that the leakage po-            operation period of 151 d (USBR, 2018), leakage from the
tential of canals in the region results in as much as 40 % to           Interstate Canal alone could approach 6.1 × 10⁷ m3 annually,
50 % of canal water being lost during conveyance (Ball et               which is about 29 % of the annual volume of precipitation in
al., 2006; Harvey and Sibray, 2001; Hobza and Andersen,                 the Dutch Flats area.

https://doi.org/10.5194/hess-25-811-2021                                                 Hydrol. Earth Syst. Sci., 25, 811–829, 2021
814                                     M. J. Wells et al.: Determination of vadose zone and saturated zone nitrate lag times

Figure 2. Cross section along representative well transect (see Fig. 1) within the Dutch Flats area. Surface elevation data were derived from
a 30 m digital elevation model (USGS, 1997). Water surface and base of aquifer elevations were sourced from a 1998 Dutch Flats study
(Böhlke et al., 2007; Verstraeten et al., 2001a, 2001b). Small black arrows beneath the surface indicate general groundwater flow direction.

   A 1990s study investigated both the spatial and temporal              6.1 m), (2) intermediate groundwater from mid-aquifer
influences from canals in the Dutch Flats area (Verstraeten              depths (length of screened interval = 1.5 m), and (3) deep
et al., 2001a, 2001b), with the results later synthesized by             groundwater near the base of the unconfined aquifer
Böhlke et al. (2007). Canals were found to dilute groundwa-              (length of screened interval = 1.5 m). Depending on well lo-
ter NO−                        −           −
        3 locally with low-NO3 (e.g., NO3 < 0.06 mg N L
                                                             −1          cation within the Dutch Flats area, depths of the water table
                                                      3
in 1997) surface water during the irrigation season. H/ He 3             and base of aquifer are highly variable, such that shallow, in-
age dating was used to determine apparent groundwater ages               termediate, and deep wells can have overlapping ranges of
and recharge rates. It was noted that wells near canals dis-             depths below land surface (Fig. 2).
played evidence of high recharge rates influenced by local                  Influenced by both regulatory and economic incentives,
canal leakage. Data from wells far from the canals indi-                 the Dutch Flats area has undergone a notable shift in irri-
cated that shallow groundwater was more likely influenced                gation practices in the last two decades. From 1999 to 2017,
by local irrigation practices (i.e., furrows in fields), while           the center pivot irrigated area has increased by approximately
deeper groundwater was impacted by both localized irriga-                270 %, from roughly 3830 to 14 253 ha or from 13 % to 49 %
tion and canal leakage (Böhlke et al., 2007). Shallow ground-            of the total agricultural land area, respectively. Most of this
water in the Dutch Flats area has hydrogen and oxygen                    shift in technology has occurred on fields previously under
stable isotopic compositions consistent with surface water               furrow irrigation. Conventional furrow irrigation has an esti-
sources (i.e., North Platte River and associated canals), indi-          mated potential application efficiency (which is a “measure
cating that most groundwater intercepted by the monitoring               of the fraction of the total volume of water delivered to the
well network has been affected by surface water irrigation               farm or field to that which is stored in the root zone to meet
recharge (Böhlke et al., 2007; Cherry et al., 2020).                     the crop evapotranspiration needs,” according to Irmak et al.,
   The Dutch Flats area is within the North Platte Nat-                  2011) of 45 % to 65 %, compared to center pivot sprinklers at
ural Resources District (NPNRD), one of 23 ground-                       75 % to 85 % (Irmak et al., 2011). Based on improved irriga-
water management districts in Nebraska tasked with,                      tion efficiency (between 10 % and 40 %), the average precip-
among other functions, improving water quality and quan-                 itation throughout the growing season (29.5 cm for 15 April
tity. The NPNRD has a large monitoring well net-                         to 13 October; Yonts, 2002), and average water requirements
work consisting of 797 wells, 327 of which are nested.                   for corn (69.2 cm; Yonts, 2002), converting furrow irrigated
Nested well clusters are drilled and constructed such                    fields to center pivot over the aforementioned 14 253 ha could
that screen intervals represent (1) shallow groundwater                  represent a difference of 1×10⁷ m3 to 6×10⁷ m3 in the water
intersecting the water table (length of screened interval =              applied. Those (roughly approximated) differences in water

Hydrol. Earth Syst. Sci., 25, 811–829, 2021                                                 https://doi.org/10.5194/hess-25-811-2021
M. J. Wells et al.: Determination of vadose zone and saturated zone nitrate lag times 815
volumes are equivalent to between 6 % and 28 % of the av- 2.2 Statistical machine learning modeling framework
erage annual precipitation applied over the Dutch Flats area,
suggesting that the change in irrigation practice does have Statistical machine learning uses algorithms to assess and
potential to alter the water balance in the area. identify complex relationships between variables. Learned
The hypothesis of lower recharge due to changes in irriga- relations can be used to uncover nonlinear trends in data that
tion technology was investigated by Wells et al. (2018), who might otherwise be overshadowed when using simple regres-
compared samples collected in 1998 and 2016. Sample sites sion techniques (Hastie et al., 2009). In this study, we used
were selected based on a well’s proximity to the fields that random forest regression to evaluate site-specific explanatory
experience a conversion in irrigation practices (i.e., furrow variables (e.g., precipitation, vadose zone thickness, depth
irrigation to center pivot) between the two collection periods. to the bottom of screen, etc.) that may impact the response
While the mean recharge rate was not significantly different, variable, i.e., groundwater NO− 3 . Additionally, as described
a lower recharge rate was indicated by data from 88 % of the in detail in Sect. 2.4, we estimated a range of total travel
wells. Long-term Dutch Flats NO− 3 trends were also assessed times (from land surface to the point of sampling) at each
in the study, suggesting decreasing trends (though statisti- of the wells by varying the vadose and saturated zone trans-
cally insignificant) from 1998 to 2016 throughout the Dutch port rates. The relative importance of total travel time as a
Flats area, and nitrogen isotopes of nitrate indicated little predictor variable was ultimately used to identify an optimal
change in the biogeochemical processes. For additional back- travel time and model.
ground, Wells et al. (2018) provides a more in-depth analysis
of recent NO− 3 trends in this region (see also Fig. S1A in the 2.3 Variables and project setup
Supplement, which shows the nitrate data used in the present
study). Data from 15 predictors were collected and analyzed (Ta-
As in other agricultural areas, nitrate in Dutch Flats ble 1). Spatial variables were manipulated using ArcGIS
groundwater is dependent on nitrogen loading at the land sur- 10.4. The NO− 3 data set for the entire NPNRD had 10 676
face, the rate of leaching below crop root zones, the rate of observations from 1979 to 2014 and was downloaded from
nitrate transport through the vadose and saturated zones, the the Quality-Assessed Agrichemical Contaminant Database
dilution from focused recharge in the vicinity of canals, the for Nebraska Groundwater (University of Nebraska – Lin-
rate of discharge from the aquifer (whether from pumping coln, 2016). We used data encompassed by the Dutch Flats
or discharge to surface water bodies), and the rates of nitrate model area (2829 NO− 3 observations from 214 wells). In or-
reduction (primarily denitrification) in the aquifer. Based on der to have an accurate vadose zone thickness, only wells
nitrogen and oxygen isotopes in nitrate and redox conditions with a corresponding depth to groundwater record, of which
observed in previous studies, denitrification likely has a rela- the most recent record was used, were selected (2651 obser-
tively minor or localized influence on groundwater nitrate in vations from 172 wells). Over this period, several wells were
the Dutch Flats area (Wells et al., 2018). Evidence of deni- sampled much more frequently than others (e.g., monthly
trification (from dissolved gases and isotopes (Böhlke et al., sampling over a short period of record), especially during a
2007; Wells et al., 2018) was mostly limited to some of the U.S. Geological Survey (USGS) National Water-Quality As-
deepest wells near the bottom of the aquifer. Leakage of low- sessment (NAWQA) study from 1995 to 1999. To prevent
nitrate water in the major canals causes nitrate dilution in those wells from dominating the training and testing of the
the groundwater (i.e., relatively little nitrate addition, at least model, the annual median NO− 3 was calculated for each well
from the upgradient canals). Additional isotope data might be and used in the data set. The data set was further manipu-
useful for documenting temporal shifts in recharge sources or lated such that each median NO− 3 observation had 15 com-
irrigation return flows to the river; however, it is difficult to plementary predictors (Table 1). The selected predictor vari-
know the exact location or size of the contributing area for ables capture the drivers of long-term NO− −
3 and NO3 lags.
each well, especially for the deeper ones. After incorporating all the data, including limited records
Other long-term changes to the landscape were evaluated of dissolved oxygen (DO), the final data set included 1049
by Wells et al. (2018) and included statistically significant re- NO− 3 observations from 162 wells sampled between 1993
ductions in mean fertilizer application rates (1987–1999 vs. and 2013 (Fig. S1A). Additional details of the data selection,
2000–2012) and the volume of water diverted into the Inter- sources, and manipulations may be found in the Supplement.
state Canal (1983–1999 vs. 2000–2016), while a significant Predictors were divided into two categories, namely static
increase in the area of planted corn occurred (1983–1999 vs. and dynamic (Table 1). Static predictors are those that either
2000–2016). Precipitation was also evaluated, and though the did not change over the period of record or had only short
mean has decreased over a similar time period, the trend was records. DO, for example, could potentially experience slight
not statistically significant. annual variations, but the data were not available to assign
each nitrate sample with a unique DO value. Instead, obser-
vations for each well were assigned the average DO value
observed from the well. This approximation was considered
https://doi.org/10.5194/hess-25-811-2021 Hydrol. Earth Syst. Sci., 25, 811–829, 2021816 M. J. Wells et al.: Determination of vadose zone and saturated zone nitrate lag times
Table 1. List of the 15 predictors used for random forest evaluation. Average (avg.) and median (med.) values are shown, and DEM denotes
digital elevation model.
Predictor Units Predictor Source
type
Center pivot irrigated area (avg.: 2618; med. : 1037)a ha Dynamic NAIP; NAPP; Landsat-1,5, 7, 8b
Interstate Canal discharge (avg.: 0.53; med.: 0.55)a km3 yr−1 Dynamic USBR (2018)
Area of planted corn (avg.: 8065; med.: 7869)a ha Dynamic NASS (2018)
Precipitation (avg.: 384; med.: 377)a mm yr−1 Dynamic NOAA (2017)
Available water capacity (avg.: 0.1; med.: 0.1) cm cm−1 Static NRCS (2018)
Dissolved oxygen (DO; avg.: 4.6; med.: 5.4) mg L−1 Static Carolyn Hudson, personal com-
munication (2018)
Distance from a major canal (avg.: 1462.2; med.: 1161.4) m Static USGS (2012)b
Distance from a minor canal (avg.: 633.2; med.: 397.6) m Static USGS (2012)b
Bottom screen (avg.: 26.9; med.: 24.4) m Static UNL (2016)b
Saturated hydraulic conductivity (avg.: 68; med.: 28) µm s−1 Static NRCS (2018)
Saturated thickness (avg.: 30.2; med.: 27.6) m Static Travis Preston, personal commu-
nication (2017)b
Saturated zone travel distance (avg.: 13.3; med.: 7) m Static UNL (2016)b
Surface elevation (DEM; avg.: 1244; med.: 1248) m Static USGS (1997)
Total travel time (avg.: 6.4; med.: 5.7)c yr Static UNL (2016)b
Vadose zone thickness (avg.: 9.9; med.: 7.3) m Static Travis Preston, personal commu-
nication (2017); Aaron Young,
personal communication (2016)
a Average and median span from 1946 to 2013. b Data required further analysis to yield calculated values; data sources are USDA (2017) and USGS (2017). c Average and
median reflects transport rates of Vu = 3.5 m yr−1 and Vu = 3.75 m yr−1 .
reasonable because nitrate isotopic composition and DO data rated zones (see Sect. 2.4). The area of planted corn was
from Wells et al. (2018) and Böhlke et al. (2007) did not in- included as a proxy for fertilizer data, which were unavail-
dicate any major changes to the biogeochemical processes able prior to 1987. However, the analysis suggests that there
over nearly 2 decades. Total travel time (from ground surface has been a 17 % reduction (comparing the means of 1987–
to the point of sampling) was strictly considered a static pre- 1999 to 2000–2012) in fertilizer application rates per planted
dictor in this study and was used to link the nitrate sampling hectare, while the area of planted corn has increased by 16 %
year to a dynamic predictor value. (comparing the means of 1983–1999 to 2000–2016) in recent
Dynamic predictors were defined in this study as data that decades (Wells et al., 2018). This trend may be attributed
changed temporally over the study period. Therefore, each to improved fertilizer management by agricultural produc-
annual median NO− 3 was assigned a lagged dynamic value to ers. There was a likely trade-off in using this proxy; we were
represent the difference between the time of a particular sur- able to extend the period of record back to 1946, allowing for
face activity (e.g., timing of a particular irrigation practice) the analysis of a wider range of lag times in the model, but
and when the groundwater sampling occurred. Dynamic pre- we might have sacrificed some accuracy in recent decades
dictors were available from 1946 to 2013 and included an- when nitrogen management may have improved. Lastly, va-
nual precipitation, Interstate Canal discharge, the area under dose and saturated zone transport rates were assumed to be
center pivot sprinklers, and the area of planted corn (Fig. 3). constant over time (Wells et al., 2018).
Dynamic predictors were included to assess their ability to
optimize random forest groundwater modeling and deter-
mine an appropriate lag time. Lag times were based on the
vertical travel distance through both the vadose and satu-
Hydrol. Earth Syst. Sci., 25, 811–829, 2021 https://doi.org/10.5194/hess-25-811-2021M. J. Wells et al.: Determination of vadose zone and saturated zone nitrate lag times 817
Figure 3. Time series plots of all four dynamic predictors. Figures represent the (a) annual precipitation, (b) Interstate canal discharge, (c)
center pivot irrigated area, and (d) area of planted corn from 1946 to 2013.
2.4 Vadose and saturated zone transport rate analysis vertical transport rates will be Vs . In the vadose zone, θ was
assigned a constant value of 0.13, which was calibrated pre-
Ranges of vertical velocities (transport rates) through the viously using a vertical transport model for the Dutch Flats
Dutch Flats vadose zone and saturated zone were estimated area (Liao et al., 2012). In the saturated zone, θ was assigned
from 3 H/3 He age-dating-derived recharge rates. The vertical a constant value of 0.35, equal to the value assumed previ-
velocities were determined from results published for sam- ously for recharge calculations (Böhlke et al., 2007). Vadose
ples collected in 1998 (Böhlke et al., 2007, Verstraeten et al., and saturated zone travel times (τ ) were then calculated as
2001a) and 2016 (Wells et al., 2018) as follows: follows:
z
R τ= , (2)
V = , (1) V
θ
where τ is either the vadose zone (τu ) or saturated zone (τs )
where R is the upper and lower bound of recharge rates travel time in years, and z is the vadose zone thickness (zu )
(m yr−1 ), and θ is the mobile water content in the vadose or distance from the water table to the well mid-screen (zs )
zone or porosity in the saturated zone. The 3 H/3 He data in meters.
were used in this study solely for constraining the range of Though Eqs. (1) and (2) do not explicitly consider hori-
potential transport rates being evaluated in the vadose and zontal groundwater flow, they are approximately consistent
saturated zones and as a base comparison to model results. with the distribution of groundwater ages (travel times from
The age data, however, were not used by the model itself recharge), which increase with depth below the water ta-
when seeking to identify an optimum transport rate combina- ble. Whereas groundwater ages commonly increase expo-
tion. Throughout the text, unsaturated (vadose) zone vertical nentially with depth in idealized surficial aquifers with rela-
transport rates will be abbreviated as Vu , while saturated zone tively uniform thickness and distributed recharge (Cook and
https://doi.org/10.5194/hess-25-811-2021 Hydrol. Earth Syst. Sci., 25, 811–829, 2021818 M. J. Wells et al.: Determination of vadose zone and saturated zone nitrate lag times Böhlke, 2000), our linear approximation is based on several rates that could be evaluated in the random forest model. The local observations including the following: (1) the linear ap- range of transport rates suggested by groundwater age dating proximation is similar to the exponential approximation in was large (more than an order of magnitude) and is consid- the upper parts of idealized aquifers, (2) linear age gradients ered to include rates likely to be expected in a variety of field may be appropriate in idealized wedge-shaped flow systems, settings. Presumably, similar model constraints and results as in some segments of the aquifer section (Fig. 2), (3) fo- could have been obtained without the prior age data and with cused recharge under irrigation canals and distribution chan- some relatively conservative estimates. nels, which can cause the distortion of vertical groundwater Travel times τu and τs were calculated for each well based age gradients in downgradient parts of the flow system, and on zu and zs , respectively. For every possible combination (4) roughly linear age gradients, which were obtained from of vadose and saturated zone transport rates, a unique total groundwater dating in the region, though with substantial lo- travel time, τt , was calculated for each well based on the va- cal variability (Böhlke et al., 2007). Discrete transport rates dose and saturated zone dimensions of that particular well. and travel times calculated from Eqs. (1) and (2) should be considered “apparent” rates and travel times, similar to ap- τt = τu + τs . (3) parent groundwater ages, which are based on imperfect trac- ers and may be affected by dispersion and mixing. Nonethe- less, the saturated open intervals of the monitoring wells used The total travel times from Eq. (3) were used to lag dynamic for this study (
M. J. Wells et al.: Determination of vadose zone and saturated zone nitrate lag times 819
cliffe, 1970) was calculated as follows: 3 Results and discussion
P 2
n
Y obs − Y pred
i=1 i i This study addressed a relatively unexplored use of random
NSE = 1 − P 2 , (4)
n obs mean
forest, which is to identify optimal lag times based on testing
i=1 Yi −Y a range of transport rate combinations through the vadose
and saturated zones, historical NO− 3 , and the use of easily
where n is the number of observations, Yiobs is the ith obser- accessible environmental data sets.
pred
vation of the response variable (NO− 3 ), Yi is the ith pre-
diction from the random forest model, and Y mean is the mean 3.1 Relative importance of transport time and dynamic
of observations from i through n. Values from negative in- variables
finity to zero suggest the mean of the observed NO− 3 would
serve as a better predictor than the model. When NSE is zero,
In our initial modeling (using both static and dynamic pre-
the model predictions are as accurate as that of a model with
dictors), we anticipated that we could use the random forest
only the mean observed NO− 3 as a predictor. From zero, the model with the highest NSE to identify the optimal pair of
larger NSE values indicate how a model’s predictive ability
vadose and saturated zone transport rates. However, no clear
improves, until NSE is one, where observations and predic-
pattern emerged among the different models (Fig. 4). Given
tions are equal. NSE was calculated for both the training and
the small differences and lack of defined pattern in testing
testing data.
NSE values, we selected 10 transport rate combinations (the
For each tree, a random bootstrapped sample (i.e., data
five top-performing models, four transport rate combinations
randomly pulled from the data set and sampled with a re-
of high and low transport rates, and one intermediate trans-
placement) is extracted from the data set (Efron, 1979) and
port rate combination) for further evaluation of variable im-
a random subset of predictors to consider the fitting at each
portance and sensitivity to a range of transport rate combi-
split. Thus, each tree is grown from a bootstrap sample and
nations (Table 2). The median total travel time ranked third
random subset of predictors, making the trees random and
in the variable importance, while the four dynamic variables
grown independently of the others. Observations not used as
consistently had the four lowest rankings (Fig. 5). Total travel
bootstrap samples are termed the out-of-bag (OOB) data.
time also had the greatest variability in importance among
When building a tree, all NO− 3 from the bootstrap sam- the 15 variables, with a range of 18.4 % between the upper
ple are categorized into terminal nodes, such that each node
and lower values, suggesting some model sensitivity to lag
is averaged and yields a predicted NO− 3 . The performance times. When excluding total travel time, the remaining vari-
and mean squared error (MSE) of a random forest model
ables had an average variable importance range of 6 %.
is evaluated by comparing the observed NO− 3 of the OOB Dynamic variables had little influence on the model, de-
data to the average predicted NO− from the forest. OOB data
3 spite having common potential linkages to groundwater NO− 3
from the training data set may be used to evaluate both the
(Böhlke et al., 2007; Exner et al., 2010; Spalding et al.,
permutation importance, referred to in the rest of this text
2001). A pattern emerged among the dynamic variables
as variable importance, and partial dependence. Variable im-
where the stronger the historical trend of the predictor, the
portance uses the percent increase in the mean squared error
greater the importance of the predictor (Figs. 3 and 5). For
(%inc MSE) to describe the predictive power of each predic-
instance, the center pivot irrigated area (highest-ranking dy-
tor in the model (Jones and Linder, 2015). During this pro-
namic variable) had the least noise and the most pronounced
cess, a single predictor is permuted, or shuffled, in the data
trend, while annual precipitation (lowest-ranking variable)
set. Therefore, each observed NO− 3 has the same relationship was highly variable and lacked any trend over time (Fig. 3)
between itself and all predictors, except one permuted vari-
and also may not be a substantial source of recharge (Böhlke
able. The %inc MSE of a variable is determined by compar-
et al., 2007). Further exploration could be done to test more
ing the permuted OOB MSE to an unpermuted OOB MSE.
refined and/or spatially varying predictors – for instance, an-
Important predictors will result in a large %inc MSE, while a
nual median rainfall intensity for the growing season might
variable of minor importance does little to impact a model’s
have a more direct connection to nitrate leaching than total
performance, as suggested by a low %inc MSE value.
annual precipitation. However, rainfall intensity data are not
Partial dependence curves serve as a graphical representa-
readily available. Likewise, the availability of a long-term,
tion of the relationship between NO− 3 and predictors in the detailed fertilizer loading data set would be advantageous in
random forest model ensemble (Hastie et al., 2009). In these
providing a more substantiated conclusion regarding the via-
models, the y axis of a partial dependence plot represents the
bility of applying dynamic variables for determining the va-
average of the OOB-predicted NO− 3 at a specific x value of dose and saturated zone lag. Dynamic variables could be of
each predictor.
more use in other study areas that undergo relatively rapid
and pronounced changes (e.g., land use). In future work,
the model sensitivity to dynamic variables could be tested
https://doi.org/10.5194/hess-25-811-2021 Hydrol. Earth Syst. Sci., 25, 811–829, 2021820 M. J. Wells et al.: Determination of vadose zone and saturated zone nitrate lag times
Figure 4. Heat map of testing NSE results from 288 vadose and saturated zone transport rate combinations. Testing NSE in this figure is
the median of all 25 model outputs from each of the 288 transport rate combinations. No clear pattern of optimal vadose and saturated zone
transport rate combinations was observed.
Table 2. Summary of 10 vadose and saturated zone transport rate combinations selected from 288 unique potential combinations from the
analysis, including the dynamic variables.
Vadose zone trans- Sat. zone trans- Test NO−
3 Total travel time (years)
port rate (m yr−1 ) port rate (m yr−1 ) NSE observationsa Mean (±1σ ) Median
Five top- 4.00 0.50 0.623 878 19.9 (±15.8) 11.3
performing 2.00 0.50 0.622 861 21.6 (±15.0) 16.5
transport 3.75 4.00 0.617 1049 6 (±3.7) 5.4
rates 4.00 3.50 0.617 1049 6.3 (±4.1) 5.7
4.50 3.00 0.616 1049 6.7 (±4.7) 5.7
Extreme and 4.75 4.50 0.608 1049 5.1 (±3.2) 4.6
midrange 2.75 2.25 0.599 1049 9.6 (±6.3) 8.5
transport 1.00 4.50 0.570 1049 12.6 (±7.7) 10.8
combinations 1.00 0.25 0.559 607 26.7 (±13.3) 20.6
4.75 0.25 0.548 664 21.3 (±15.0) 14.9
a In cases with slow transport rates, lag times were relatively long and not all NO− data could be used in the model. For example, a slow transport
3
rate combination resulting in a lag time with the infiltration year prior to 1946 could not be included. Thus, some models were ultimately based onM. J. Wells et al.: Determination of vadose zone and saturated zone nitrate lag times 821
Figure 5. Box plot of the %inc MSE from the 10 transport rate combinations shown in Table 2. Each box plot has 10 points for each transport
rate combination, representing the median %inc MSE from the 25 models (five-fold cross validation repeated five times). A larger %inc MSE
suggests that the variable had a greater influence on a model’s ability to predict NO−
s . Note:
∗∗ denotes dynamic predictors.
through formal sensitivity analysis and/or automated variable area through previous studies (Böhlke et al., 2007; Wells et
selection algorithms (Eibe et al., 2016). al., 2018). Therefore, a second analysis of just the 11 static
Ultimately, the results from initial analyses suggest that predictors was performed over the full range of vadose and
(1) the dynamic data did little to improve model perfor- saturated zone transport rates (i.e., 288 combinations). How-
mance, and (2) the random forest was not able to relate the ever, in the second analysis, the model sensitivity to total
four considered dynamic predictors to NO− 3 in a meaning- travel time – evaluated with respect to the transport rate com-
ful way that could be used to estimate lag times. It is likely bination corresponding to the largest %inc MSE of total travel
that the influence of these dynamic predictors is dampened time – was used to determine a distinguished transport rate
as nitrate is transported from the surface to wells, such that combination. In other words, the models were retrained and
data-driven approaches are unable to sort through the noise tested for all transport rate combinations, each of which pro-
to identify relationships. duced a unique set of values for the total travel time vari-
able. As described in Sect. 2.5, the %inc MSE value for total
3.2 Use of random forest to determine transport rates travel time was then based on the error induced in the model
by permuting the calculated total travel times across all the
Due to their low relative importance as predictors, all four nitrate observations (i.e., randomly shuffling the total travel
dynamic predictors were removed in the subsequent analy- time variable and, thus, disturbing the structure of the data
sis. As discussed above, a notable variation in total travel set).
time %inc MSE was observed in Fig. 5, suggesting model sen- The random forest models were useful in identifying the
sitivity to this variable. Additionally, a relationship between relative magnitudes of Vu and Vs that led to high %inc MSE.
travel time and NO− Based on the heat map of %inc MSE, a band of transport
3 has been suggested in the Dutch Flats
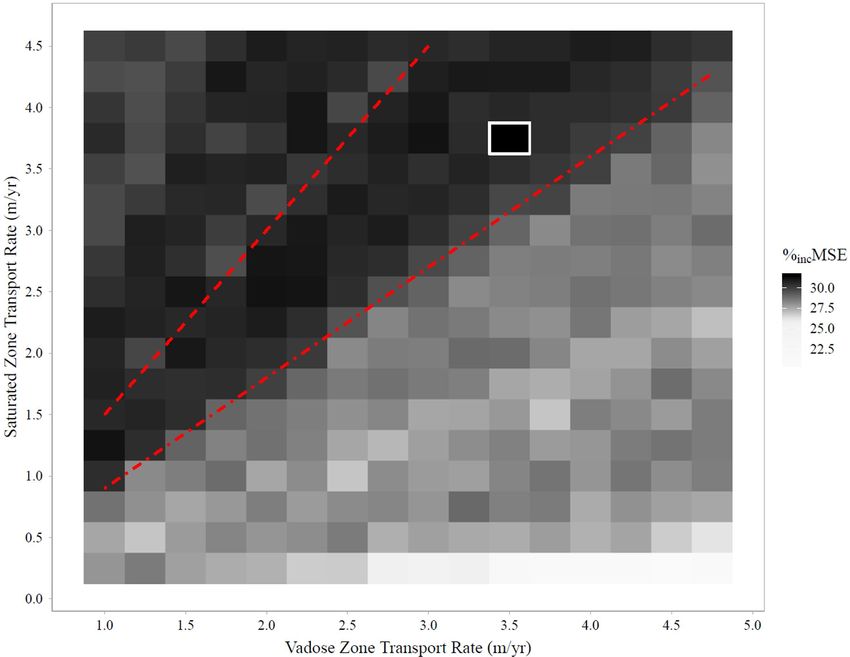
https://doi.org/10.5194/hess-25-811-2021 Hydrol. Earth Syst. Sci., 25, 811–829, 2021822 M. J. Wells et al.: Determination of vadose zone and saturated zone nitrate lag times Figure 6. Heat map of %inc MSE (median from 25 models) from the variable importance of the total travel time for each of the 288 transport rate combinations evaluated. Red dashed lines indicate upper (Vs / Vu = 1.5; long dashes) and lower (0.9; short dashes) bounds of the band of transport rate combinations with consistently higher %inc MSE. The white square highlights the single transport rate combination with the highest %inc MSE. rate combinations with consistently high %inc MSE was vi- ness (Fig. 7). Converting those vadose and saturated zone sually apparent (Fig. 6). The upper and lower bounds of the transport rates to recharge rates yielded values of 0.46 and band translate to transport rate ratios (Vs / Vu ) ranging from 1.31 m yr−1 , respectively. Such a large difference between 0.9 to 1.5 and are values that could be useful in constrain- the two recharge values is consistent with the hydrologic con- ing recharge and/or transport rate estimates in more com- ceptual model of the Dutch Flats area. In fact, both model plex mechanistic models of the Dutch Flats area as part of recharge rates compare favorably with recharge rates calcu- a hybrid modeling approach. This is especially important be- lated from the previous Dutch Flats studies using 3 H/3 He age cause recharge is one of the most sensitive parameters in a dating (Böhlke et al., 2007; Wells et al., 2018). For instance, groundwater model (Mittelstet et al., 2011), yet it is one with the recharge rate determined from the vadose zone trans- high uncertainty. Whereas a saturated zone velocity that is port rate in this study (0.46 m yr−1 ) was comparable to the greater than a vadose zone velocity would be unexpected in mean recharge rate of 0.38 m yr−1 (n = 9) from groundwater many unconsolidated surficial aquifers receiving distributed age dating at shallow wells, which are the most representa- recharge, the statistical machine learning results are consis- tive of the diffuse recharge below crop fields that are present tent with the two contrasting primary recharge processes in across most of the study area (e.g., Fig. S2). Additionally, the Dutch Flats area, namely (1) the diffuse recharge from the recharge rate (1.31 m yr−1 ) determined from the saturated irrigation and precipitation across the landscape and (2) the zone transport rate was consistent with the mean recharge focused recharge from leaking irrigation conveyance canals. value derived from groundwater ages in intermediate wells The %inc MSE of total travel time in the second anal- (1.22 m yr−1 , n = 13; Böhlke et al., 2007; Wells et al., 2018). ysis (using only static variables) ranged from 20.6 % to Intermediate wells are variably impacted by focused recharge 31.5 %, with the largest %inc MSE associated with vadose from canals in upgradient areas. Given the similarity in dif- and saturated zone transport rates of 3.50 and 3.75 m yr−1 , fuse recharge and focused recharge estimates from both ran- respectively (Fig. 6), and the top four predictors for this dom forest and groundwater age dating, the transport rate ra- transport rate combination were total travel time, vadose tios (1.2 and 1.1, respectively) were consistent. That is, the zone thickness, dissolved oxygen (DO), and saturated thick- random forest modeling framework produced transport rates Hydrol. Earth Syst. Sci., 25, 811–829, 2021 https://doi.org/10.5194/hess-25-811-2021
M. J. Wells et al.: Determination of vadose zone and saturated zone nitrate lag times                                                   823

Figure 7. Plot from the secondary analysis exploring the variable importance of the transport rate combination with the largest median
%inc MSE in total travel time (Vu = 3.5 m yr−1 ; Vs = 3.75 m yr−1 ). Each point is from one of 25 random forest models that were run for this
evaluation. A larger %inc MSE suggests the variable had a greater influence on a model’s ability to predict NO−
                                                                                                              s .

consistent with the major hydrological processes in Dutch                between those expected for diffuse infiltration and focused
Flats in both direct (i.e., transport rate estimates) and relative       canal leakage.
(i.e., transport rate ratio) terms.                                         Partial dependence plots, which illustrate the impact that
   Assuming that the random forest approach has accurately               a single predictor has on NO−   3 in the model with respect to
captured the two major recharge processes (diffuse recharge              other predictors (Fig. 8), largely reflect the conceptual un-
over crop fields and focused recharge from canals), a compar-            derstanding of the system from previous studies, including
ison of recharge rates from all sampled groundwater wells                Böhlke et al. (2007) and Wells et al. (2018). Key plots and
representative of recharge to the groundwater system as a                features that strengthen confidence in the random forest mod-
whole (0.84 m yr−1 ; n = 43) to the recharge rates from ran-             eling include (1) depth to the bottom screen, where ground-
dom forest modeling (0.46 and 1.31 m yr−1 ) would provide                water NO−  3 is lower at greater depths; (2) the effects of minor
an estimate of the relative importance of diffuse versus fo-             and major canals, where groundwater NO−       3 in the vicinity of
cused recharge on overall recharge in Dutch Flats. Under                 canals is diluted by canal leakage, and the influence of major
these assumptions, diffuse recharge would account for ap-                canals, which extend over a longer distance when compared
proximately 55 %, while focused recharge would account for               to that of minor canals; (3) land surface elevation, where el-
about 45 % of the total recharge in the Dutch Flats area. Sim-           evations indicating proximity to major canals are associated
ilarly, Böhlke et al. (2007) concluded that these two recharge           with relatively lower groundwater NO−    3 ; and (4) DO concen-
sources contributed roughly equally to the aquifer on the ba-            tration, where higher DO concentration is linked to higher
sis of groundwater age profiles and from dissolved atmo-                 groundwater NO−    3 . We note that decreasing DO and NO3
                                                                                                                                         −

spheric gas data indicating the mean recharge temperatures               with groundwater age can be explained by the DO reduction

https://doi.org/10.5194/hess-25-811-2021                                                  Hydrol. Earth Syst. Sci., 25, 811–829, 2021
824 M. J. Wells et al.: Determination of vadose zone and saturated zone nitrate lag times
and historical changes in NO− 3 recharge, whereas groundwa- signal is preserved. Similarly, vertical profiles of NO−
3
ter chemistry and nitrate isotopic data recorded in both this and isotopic composition in the vadose zone could pro-
study and previous Dutch Flats studies suggest that denitrifi- vide valuable data for investigating (1) the amount of
cation was not a major factor in this alluvial aquifer. nitrate stored in the vadose zone and (2) whether ni-
The partial dependence plot (Fig. 8) for total travel time trate undergoes any biogeochemical changes while be-
exhibits a pronounced threshold, where NO− 3 is markedly ing transported through the vadose zone to the water ta-
higher for groundwater with a travel time of less than 7 years. ble.
It is possible that this reflects long-term stratification of
groundwater NO− 3. While estimates of vadose and saturated zone trans-
3 , stemming from the suggested patterns
stated above, as nitrate varies with the aquifer depth due to port rates determined from %inc MSE are consistent
the influences of diffuse and focused recharge in the region. with previous studies, the predictive performance of the
This 7-year threshold is slightly lower than a previous esti- selected model (based on NSE and a visual inspec-
mate of mean groundwater age in the aquifer (8.8 years; Böh- tion of predicted versus observed nitrate plots) was not
lke et al., 2007; where groundwater age excludes vadose zone substantially different to other models tested. In other
travel time) and suggests that shallow groundwater can re- words, the optimal model was only weakly preferred in
spond relatively rapidly to changes in nitrogen management terms of predicting NO− 3 . Testing the approach of us-
in the Dutch Flats area. ing %inc MSE in other vadose and saturated zones, with
substantial comparison to previous transport rate esti-
3.3 Opportunities and limitations of the random forest mates, is warranted. This would be especially valuable
approach in estimating lag times in an area with a well-defined input function for nitrate
that could be compared to a reconstructed input function
Overall, results suggest that, in a complex system such as from the model. Furthermore, in aquifer settings with
Dutch Flats, random forest was able to identify reasonable relatively evenly distributed recharge, optimized travel
transport rates for both the vadose and saturated zones, and times to wells could be used to estimate the infiltration
with additional validation, this method may offer an inexpen- date of samples, thus providing an optimized view of
sive (i.e., compared to groundwater age dating across a large historical variations in NO− 3 entering the subsurface, as
monitoring well network and/or complex modeling) and rea- illustrated in Fig. S1B. In the Dutch Flats area, how-
sonable technique for estimating the lag time from historical ever, such an analysis is complicated by the effects of
monitoring data. Furthermore, this approach allows for addi- subsurface nitrate dilution by local recharge from canal
tional insight on groundwater dynamics to be extracted from leakage.
existing monitoring data. However, this study was conducted
in the context of a larger project (Wells et al., 2018) and built 4. Despite the potential non-uniqueness in the prediction
on prior research on groundwater flow and NO− metrics, the heat map of %inc MSE did reveal an orderly
3 in the study
area (Böhlke et al., 2007). Therefore, it is critical, in future pattern, suggesting consistent transport rate ratios. For
work, to incorporate site-specific knowledge, process under- modeling efforts where recharge rates are a key calibra-
standing, and approaches for increasing the interpretability tion parameter, the identification of a range of reason-
of machine learning models (Lundberg et al., 2020, Saia et able recharge rates, and/or the ratio of recharge rates
al., 2020), as highlighted in the key considerations below. from diffuse and focused recharge sources for a com-
Some key considerations for the future application of this plex system, will reduce model uncertainty and improve
approach include the following: the results. This statistical machine learning approach,
which essentially leverages nitrate as a tracer (albeit
1. The random forest approach might be useful for esti- with an unknown input function in this case), may pro-
mating future recharge and NO− 3 using multiple poten- vide valuable insight to complement relatively expen-
tial management scenarios as long as the considered sive groundwater age-dating or vadose zone monitoring
management scenarios fall within the range of histori- data or perhaps it will be useful as a stand-alone ap-
cal observations used to train the model. This informa- proach for first-order approximations.
tion could be used to inform policy makers of the impact
that current and future management decisions will have 5. The demonstrated statistical machine learning approach
on recharge and NO− is apparently well-suited for drawing out transport rate
3.
information from a site with two distinct recharge
2. The Dutch Flats overlies a predominantly oxic aquifer sources (diffuse versus focused recharge sources) driv-
where nitrate transport is mostly conservative. In ing the groundwater nitrate dynamics. Further testing is
aquifers with heterogeneity in the denitrification poten- needed at sites where recharge and nitrate dynamics are
tial and/or distinct nitrate extinction depths (Liao et al., more subtle.
2012; Welch et al., 2011), this approach may be biased
toward the oxic portions of the aquifer where the nitrate
Hydrol. Earth Syst. Sci., 25, 811–829, 2021 https://doi.org/10.5194/hess-25-811-2021M. J. Wells et al.: Determination of vadose zone and saturated zone nitrate lag times 825
Figure 8. Partial dependence plot for the model evaluating the transport rate combination of Vu = 3.5 m yr−1 and Vs = 3.75 m yr−1 . Tick
marks on each plot represent predictor observations used to train models.
4 Conclusions combinations, and the combination with a total travel time
that had the largest influence over the model’s ability to pre-
The Dutch Flats area exhibits large variations in NO− 3
dict NO− 3 was selected for additional examination. This anal-
throughout a relatively small region in western Nebraska. ysis identified a vadose zone and saturated zone transport rate
Long-term groundwater NO− 3 monitoring and previous
combination consistent with rates previously estimated from
3 H/3 He age dating in Böhlke et al. (2007) and Wells et al.
groundwater age-dating studies in Dutch Flats provided an
opportune setting to test a new application of statistical ma- (2018), indicating that there is a combination of distributed
chine learning (random forest) for determining vadose and and focused sources of irrigation recharge to this aquifer.
saturated zone transport rates. Overall results suggest that Future studies could include assessments of the proper
random forest has the capability to both identify reasonable conditions for the application of dynamic predictors and
transport rates (and lag time) and key variables influencing comparisons of data-driven analyses with complementary
groundwater NO− 3 , albeit with the potential for non-unique
data sets and/or modeling (e.g., field-based recharge rate es-
results. Limitations were also identified when using dynamic timates, finite-difference flow model). Despite the noted lim-
predictors to model groundwater NO− 3 . Utilizing only static
itations, the partial dependence plots and relative importance
predictors and random forest’s ability to evaluate variable of predictors were largely consistent with the previous find-
importance, vadose zone and saturated zone transport rates ings and mechanistic understanding of the study area, giv-
were selected based on model sensitivity to changing the to- ing greater confidence in the model outputs. The influence of
tal travel time predictor. In other words, total travel time vari- canal leakage on groundwater recharge rates and NO− 3 , for
able importance was evaluated for 288 different transport rate example, was consistent with previous Dutch Flats studies.
https://doi.org/10.5194/hess-25-811-2021 Hydrol. Earth Syst. Sci., 25, 811–829, 2021826 M. J. Wells et al.: Determination of vadose zone and saturated zone nitrate lag times
Partial dependence plots suggest a threshold of higher NO− 3 Review statement. This paper was edited by Nunzio Romano and
for groundwater with a total travel time (vadose and satu- reviewed by Sophie Ehrhardt, Pia Ebeling, and two anonymous ref-
rated zone travel times, combined) of less than 7 years, indi- erees.
cating the potential for a relatively rapid groundwater NO− 3
response to the widespread implementation of best manage-
ment practices. Additionally, research is needed to determine
References
the minimum number of observations necessary to effec-
tively apply the framework shown here. Anning, D. W., Paul, A. P., McKinney, T. S., Huntington, J. M.,
Bexfield, L. M., and Thiros, S. A.: Predicted Nitrate and Ar-
senic Concentrations in Basin-Fill Aquifers of the Southwestern
Code and data availability. The code is available on request. Data United States, United States Geological Survey Scientific Inves-
used in the random forest model and described in the Supplement tigations Report 2012–5065, 78, available at: https://pubs.usgs.
are available via the University of Nebraska – Lincoln Data Repos- gov/sir/2012/5065/ (last access: 8 February 2021), 2012.
itory (UNLDR; https://doi.org/10.32873/unl.dr.20200428; Wells Babcock, H. M., Visher, F. N., and Durum, W. H.: Ground-Water
and Gilmore, 2020). Conditions in the Dutch Flats Area, Scotts Bluff and Sioux Coun-
ties, Nebraska, United States Geological Survey Circular 126,
51, available at: http://pubs.er.usgs.gov/publication/cir126 (last
Supplement. An online file accompanying this article contains ad- access: 8 February 2021), 1951.
ditional figures, tables, and details of the methods used for the Ball, L. B., Kress, W. H., Steele, G. V., Cannia, J. C., and An-
study. The supplement related to this article is available online dersen, M. J.: Determination of Canal Leakage Potential Using
at: https://doi.org/10.5194/hess-25-811-2021-supplement. Continuous Resistivity Profiling Techniques, Interstate and Tri-
State Canals, Western Nebraska and Eastern Wyoming, 2004,
United States Geological Survey Scientific Investigations Report
Author contributions. TG, AM, and NN were responsible for the 2006–5032, 53, available at: http://pubs.er.usgs.gov/publication/
conceptualization. MW and NN developed the model code, and sir20065032 (last access: 8 February 2021), 2006.
MW performed the formal analysis. MW prepared the paper from Böhlke, J. K.: Groundwater Recharge and Agricul-
his Masters thesis, with contributions from all coauthors, including tural Contamination, Hydrogeol. J., 10, 153–179,
JKB. TG was responsible for the project administration and funding https://doi.org/10.1007/s10040-001-0183-3, 2002.
acquisition. Böhlke, J. K. and Denver, J. M.: Combined Use of Groundwater
Dating, Chemical, and Isotopic Analyses to Resolve the History
and Fate of Nitrate Contamination in Two Agricultural Water-
sheds, Atlantic Coastal Plain, Maryland, Water Resour. Res., 31,
Competing interests. The authors declare that they have no conflict
2319–2339, https://doi.org/10.1029/95WR01584, 1995.
of interest.
Böhlke, J. K., Wanty, R., Tuttle, M., Delin, G., and Landon, M.:
Denitrification in the Recharge Area and Discharge Area of
a Transient Agricultural Nitrate Plume in a Glacial Outwash
Disclaimer. Any use of trade, firm, or product names is for descrip- Sand Aquifer, Minnesota, Water Resour. Res., 38, 10-1–10–26,
tive purposes only and does not imply endorsement by the U.S. gov- https://doi.org/10.1029/2001WR000663, 2002.
ernment. Böhlke, J. K., Verstraeten, I. M., and Kraemer, T. F.: Ef-
fects of Surface-Water Irrigation on Sources, Fluxes,
and Residence Times of Water, Nitrate, and Uranium
Acknowledgements. The authors acknowledge the North Platte in an Alluvial Aquifer, Appl. Geochem., 22, 152–174,
Natural Resources District for providing technical assistance and re- https://doi.org/10.1016/j.apgeochem.2006.08.019, 2007.
sources, including long-term groundwater nitrate data accessed via Breiman, L.: Random Forests, Machine Learning, 45, 5–32,
the Quality-Assessed Agrichemical Contaminant Database for Ne- https://doi.org/10.1023/A:1010933404324, 2001.
braska Groundwater. We thank Steve Sibray and Mason Johnson, Browne, B. A. and Guldan, N. M.: Understanding Long-
for their support in the field sampling efforts, and Les Howard, for Term Baseflow Water Quality Trends Using a Synoptic Sur-
the cartography. Models were run on the Holland Computing Cen- vey of the Ground Water–Surface Water Interface, Cen-
ter (HCC) cluster at the University of Nebraska – Lincoln. We also tral Wisconsin, Journal of Environment Quality, 34, 825,
thank Christopher Green, Sophie Ehrhardt, Pia Ebeling, and two https://doi.org/10.2134/jeq2004.0134, 2005.
anonymous reviewers for the helpful comments on earlier versions Cherry, M., Gilmore, T., Mittelstet, A., Gastmans, D., San-
of the paper. tos, V., and Gates, J. B.: Recharge Seasonality Based
on Stable Isotopes: Nongrowing Season Bias Altered by
Irrigation in Nebraska, Hydrol. Process., 34, 1575–1586,
Financial support. This research has been supported by the U.S. https://doi.org/10.1002/hyp.13683, 2020.
Geological Survey (grant no. 2016NE286B), the U.S. Department Cook, P. G. and Böhlke, J. K.: Determining Timescales for Ground-
of Agriculture National Institute of Food and Agriculture (grant water Flow and Solute Transport, in: Environmental Tracers in
no. NEB-21-177; accession no. 1015698), and the Daugherty Water Subsurface Hydrology, edited by: Cook, P. G. and Herczeg, A.
for Food Global Institute Fellowship for graduate students. L., 1–30, Springer US, Boston, MA, 2000.
Hydrol. Earth Syst. Sci., 25, 811–829, 2021 https://doi.org/10.5194/hess-25-811-2021You can also read