DEVELOPMENT AND VALIDATION OF A LIFESTYLEBASED MODEL FOR COLORECTAL CANCER RISK PREDICTION: THE LIFECRC SCORE - BMC ...
←
→
Page content transcription
If your browser does not render page correctly, please read the page content below
Aleksandrova et al. BMC Medicine      (2021) 19:1
https://doi.org/10.1186/s12916-020-01826-0

 RESEARCH ARTICLE                                                                                                                                  Open Access

Development and validation of a lifestyle-
based model for colorectal cancer risk
prediction: the LiFeCRC score
Krasimira Aleksandrova1,2,3*, Robin Reichmann1,2, Rudolf Kaaks4, Mazda Jenab5, H. Bas Bueno-de-Mesquita6,7,
Christina C. Dahm8, Anne Kirstine Eriksen 9, Anne Tjønneland9, Fanny Artaud10,11,
Marie-Christine Boutron-Ruault10,11, Gianluca Severi10,11,12, Anika Hüsing4, Antonia Trichopoulou13,
Anna Karakatsani13,14, Eleni Peppa13, Salvatore Panico15, Giovanna Masala16, Sara Grioni17, Carlotta Sacerdote18,
Rosario Tumino19, Sjoerd G. Elias20, Anne M. May20, Kristin B. Borch21, Torkjel M. Sandanger21, Guri Skeie21,
Maria-Jose Sánchez22,23,24,25, José María Huerta24,26, Núria Sala27,28, Aurelio Barricarte Gurrea24,29,30,
José Ramón Quirós31, Pilar Amiano24,32, Jonna Berntsson33, Isabel Drake34, Bethany van Guelpen35,36,
Sophia Harlid35, Tim Key37, Elisabete Weiderpass5, Elom K. Aglago5, Amanda J. Cross7, Konstantinos K. Tsilidis7,38,
Elio Riboli7 and Marc J. Gunter5

  Abstract
  Background: Nutrition and lifestyle have been long established as risk factors for colorectal cancer (CRC).
  Modifiable lifestyle behaviours bear potential to minimize long-term CRC risk; however, translation of lifestyle
  information into individualized CRC risk assessment has not been implemented. Lifestyle-based risk models may aid
  the identification of high-risk individuals, guide referral to screening and motivate behaviour change. We therefore
  developed and validated a lifestyle-based CRC risk prediction algorithm in an asymptomatic European population.
  Methods: The model was based on data from 255,482 participants in the European Prospective Investigation into
  Cancer and Nutrition (EPIC) study aged 19 to 70 years who were free of cancer at study baseline (1992–2000) and
  were followed up to 31 September 2010. The model was validated in a sample comprising 74,403 participants
  selected among five EPIC centres. Over a median follow-up time of 15 years, there were 3645 and 981 colorectal
  cancer cases in the derivation and validation samples, respectively. Variable selection algorithms in Cox proportional
  hazard regression and random survival forest (RSF) were used to identify the best predictors among plausible
  predictor variables. Measures of discrimination and calibration were calculated in derivation and validation samples.
  To facilitate model communication, a nomogram and a web-based application were developed.
  (Continued on next page)

* Correspondence: aleksandrova@leibniz-bips.de
1
 Nutrition, Immunity and Metabolism Senior Scientist Group, Department of
Nutrition and Gerontology, German Institute of Human Nutrition
Potsdam-Rehbruecke (DIfE), Nuthetal, Germany
2
 Institute of Nutritional Science, University of Potsdam, Potsdam, Germany
Full list of author information is available at the end of the article

                                       © The Author(s). 2020 Open Access This article is licensed under a Creative Commons Attribution 4.0 International License,
                                       which permits use, sharing, adaptation, distribution and reproduction in any medium or format, as long as you give
                                       appropriate credit to the original author(s) and the source, provide a link to the Creative Commons licence, and indicate if
                                       changes were made. The images or other third party material in this article are included in the article's Creative Commons
                                       licence, unless indicated otherwise in a credit line to the material. If material is not included in the article's Creative Commons
                                       licence and your intended use is not permitted by statutory regulation or exceeds the permitted use, you will need to obtain
                                       permission directly from the copyright holder. To view a copy of this licence, visit http://creativecommons.org/licenses/by/4.0/.
                                       The Creative Commons Public Domain Dedication waiver (http://creativecommons.org/publicdomain/zero/1.0/) applies to the
                                       data made available in this article, unless otherwise stated in a credit line to the data.
Aleksandrova et al. BMC Medicine (2021) 19:1 Page 2 of 19 (Continued from previous page) Results: The final selection model included age, waist circumference, height, smoking, alcohol consumption, physical activity, vegetables, dairy products, processed meat, and sugar and confectionary. The risk score demonstrated good discrimination overall and in sex-specific models. Harrell’s C-index was 0.710 in the derivation cohort and 0.714 in the validation cohort. The model was well calibrated and showed strong agreement between predicted and observed risk. Random survival forest analysis suggested high model robustness. Beyond age, lifestyle data led to improved model performance overall (continuous net reclassification improvement = 0.307 (95% CI 0.264–0.352)), and especially for young individuals below 45 years (continuous net reclassification improvement = 0.364 (95% CI 0.084–0.575)). Conclusions: LiFeCRC score based on age and lifestyle data accurately identifies individuals at risk for incident colorectal cancer in European populations and could contribute to improved prevention through motivating lifestyle change at an individual level. Keywords: Colorectal cancer, Risk prediction, Lifestyle behaviour, Risk screening, Cancer prevention Background and the European Prospective Investigation into Cancer Colorectal cancer accounted for over 1.8 million new and Nutrition (EPIC) cohort studies [20]; however, sev- cases or 10% of all new cases of cancer worldwide in eral gaps remain to be addressed. First, only a few previ- 2018 [1]. Worryingly, the global burden of colorectal ous models have been developed based on prospective cancer is expected to rise by 60% reaching 2.2 million cohort data with long enough follow-up time to account new cases and 1.1 million deaths in 2030, with European for the potentially long latency period of colorectal can- countries ranking highest in the global statistics of colo- cer development [18]. Second, important emerging pre- rectal cancer incidence and mortality [2]. The projected dictors related to nutrition and lifestyle such as increase in colorectal cancer burden necessitates im- abdominal fatness have not been considered [22]. Third, proved assessment of primary prevention strategies [2, most models focused only on model development and 3]. Targeted prevention in an asymptomatic population did not address the full continuum of model develop- that addresses potentially modifiable factors has poten- ment, validation and communication recommended in tial for reducing lifestyle-associated long-term risk of recent methodological guidelines for research on risk colorectal cancer and represents a cost-effective ap- prediction (i.e. TRIPOD, Transparent Reporting of a proach to reduce the cancer burden [4, 5]. multivariable Prediction model for Individual Prognosis Lifestyle behaviours such as smoking, alcohol consump- or Diagnosis) [19, 23]. Fourth, previous models were tion, and poor diet have long been recognized to be asso- mostly developed using logistic regression and did not ciated with a higher risk of colorectal cancer [6–15]. account for time-to-event. New approaches such as pe- Updated evidence on nutrition and cancer risk further nalized regression methods (i.e. elastic net regression) highlighted the importance of risk factors such as body and machine learning algorithms (i.e. random survival fatness (i.e. abdominal adiposity), adult-attained height, forest) might offer additional means for model improve- physical activity, high intake of red and processed meat ment [24, 25]. Finally, model communication to the and low intakes of whole grains, dairy products and fish wider public was generally not addressed by previous [15, 16]. Despite accumulation of evidence, translation of studies and was restricted to providing a formula to cal- lifestyle information into individualized colorectal cancer culate individual absolute risk of colorectal cancer [18]. risk assessment strategies has not been implemented so Graphical nomograms and web-based applications could far. Risk stratification may aid the identification of high- further aid in facilitating model communication [26]. risk individuals, guide referral to screening and motivate In this context, we aimed to develop and validate a lifestyle modification [17]. Individualized risk estimates in lifestyle-based risk prediction model for the prevention of primary care may essentially aid behaviour change and colorectal cancer in a population-based European cohort. complement preventive approaches to shifting population We further aimed to construct a simple and widely applic- distributions of risk factors [17]. able user-friendly risk calculator offering an estimate of A number of colorectal cancer risk prediction models colorectal cancer risk based on individual’s personal data. have been published over the last decade [18–21]. Most published models have been predominantly developed Methods using data from American and Asian populations [18, Study design and data source 19]. We have previously validated several models in The lifestyle-based prediction model for colorectal can- European populations based on data from UK Biobank cer risk (LiFeCRC score) was developed using data
Aleksandrova et al. BMC Medicine          (2021) 19:1                                                                                                  Page 3 of 19

collected within EPIC, a multicentre prospective cohort                            follow-up of study participants. Follow-up began at the
study comprising 521,324 participants aged 17 to 98                                date of enrolment and ended at the date of diagnosis of
years at study baseline (predominantly 35 to 70 years) re-                         colorectal cancer, death or last complete follow-up. The
cruited between 1992 and 2000 across 23 centres in 10                              last update of endpoint information was done up to 31
European countries [27]. Participants included blood do-                           September 2010. Colon and rectal cancers were defined
nors, screening participants, health-conscious individuals                         according to the 10th Revision of the International Statis-
and the general population. Written informed consent                               tical Classification of Diseases, Injuries and Causes of
was obtained from all participants before joining the                              Death (ICD-10), proximal colon tumours include tumours
EPIC study. Approval for the EPIC study was obtained                               in the cecum, cecal appendix, ascending colon, hepatic
from the ethical review boards of the International                                flexure, transverse colon and splenic flexure (ICD-10
Agency for Research on Cancer and from all local insti-                            codes C18.0–18.5); distal colon tumours include those in
tutions through which subjects were recruited for the                              the descending colon (ICD-10 code C18.6) and sigmoid
EPIC study, as previously reported [28].                                           colon (ICD-10 code C18.7); and rectal tumours are those
                                                                                   occurring at the rectosigmoid junction (ICD-10 code C19)
Case ascertainment                                                                 or in the rectum (ICD-10 code C20). Only the first pri-
The primary outcome was incident colorectal cancer.                                mary neoplasm was included in the analysis; non-
Cancer cases were identified through population cancer                             melanoma skin cancer was excluded.
registries in Denmark, Italy, the Netherlands, Spain,
Sweden and the UK. In France, Germany and Greece, a                                Study population
combination of methods was used including health in-                               Figure 1 presents a flowchart of study population selec-
surance records, cancer pathology registries and active                            tion for deriving the LiFeCRC score in the EPIC cohort.

                                                  EPIC study (recruited 1992 to 2000)                       Excluded participants:
                                                         521,324 participants                                  Prevalent diseases
                                                             Colon cancer: 4,044 cases                                 Other cancers               27,787   (5.3 %)
                                                             Rectal cancer: 2,180 cases                                Diabetes                    13,049   (2.5 %)
                                                                                                                       Myocardial infarction        5,660   (1.1 %)
                                                                                                                       Stroke                       3,078   (0.6 %)
                                                                                                               Undefined follow-up status           1,493   (0.3 %)
                                                                                                               Incorrect follow-up dates              359   (0.1 %)
                                                                                                               Age ≥70 years                       10,418   (2.0 %)
                                                                                                               Underweight                          5,989   (1.1 %)
                                                              329,885 participants                             (BMI
Aleksandrova et al. BMC Medicine (2021) 19:1 Page 4 of 19
Participants with prevalent cancer, diabetes, myocardial proportional hazard models within the derivation data-
infarction or stroke at recruitment and participants with- set. Time -to - event was defined as time from baseline
out follow-up were excluded. Missing information on assessment to first cancer event. Supplementary Table 3,
main risk factors (sex, anthropometric measurements, Additional File 1 presents the variable names and meas-
lifestyle and dietary data) was present in 22.5% of the urement scales of a predefined set of 16 predictors se-
data, and therefore, entries with missing data were ex- lected based on published literature reflecting latest
cluded for complete case analysis. Based on this, partici- evidence from systematic reviews (i.e. World Cancer
pants from EPIC-Umeå and EPIC-Norway were Research Fund/American Institute for Cancer Research
excluded from the current analyses due to lack of data reports) and based on availability of data in the EPIC co-
on waist circumference measurements. The resulting hort. Analyses based on Schoenfeld residuals and stratified
study sample comprised 329,885 participants among Kaplan-Meier curves revealed no violation of the propor-
which 4626 incident colorectal cancer cases (2847 colon tional hazard assumption of the Cox model. To test
cancer/1560 rectal cancer) were diagnosed during study whether the predictive performance of each variable is the
follow-up. This sample was split into a derivation cohort same, regardless of the values of other predictors, statis-
(N = 255,482) and a validation cohort (N = 74,403) on a tical interactions between different combinations of pre-
non-random principle following the TRIPOD recom- dictor variables on the multiplicative scale were tested
mendations [23]. The derivation sample included par- using the likelihood ratio test. Since model discrimination
ticipants from 21 EPIC centres in France, Italy, Spain, was not improved by including significant interaction
UK, the Netherlands, Greece, Germany, Sweden and terms, the inclusion of interaction terms in the final Cox
Denmark. The validation sample included participants models was disregarded to avoid overfitting.
representing Southern and Northern European popu-
lations from 5 EPIC centres in Italy, Spain, the
Elastic net selection
Netherlands, Germany and Denmark (Fig. 1).
Predictor variable selection was performed using boot-
strapped elastic net regularization [32]. Elastic net
Baseline data collection
regularization is a penalized regression method, combining
At baseline, participants completed extensive medical,
least absolute shrinkage and selection operator (LASSO)
dietary and lifestyle questionnaires, including questions
and ridge regression. A penalty parameter λ is used to
on alcohol use, smoking status, physical activity, educa-
shrink predictor regression coefficients, eventually remov-
tion and previous illnesses. Body weight, height and
ing predictor variables from the model by setting their re-
waist circumference were measured in all centres except
spective regression coefficient to zero. A mixing parameter
for EPIC-Oxford (health-conscious population) and
α is used to fix the proportion for combining LASSO and
EPIC-France where anthropometric measurements were
ridge regression. Optimal values for both parameters λ and
self-reported [27]. Usual food intakes were measured by
α were determined based on minimal mean error of 10-fold
using country-specific validated dietary questionnaires
cross-validation using 100 possible λ values for α values be-
[29]. All dietary variables used in the present study were
tween 0.5 and 1 (0.5, 0.6, 0.7, 0.8, 0.9, 1). The selected pa-
calibrated by using an additive calibration method as
rameters were then used to bootstrap the elastic net
previously described [30]. Non-steroidal anti-inflammatory
regularization of each predictor’s Cox regression coefficient
drug (NSAID) use was only assessed in the Cambridge
with 1000 replications. Based on all bootstrap replications,
study center, and family history of colorectal cancer was
mean coefficient values and 95% confidence intervals were
assessed only in study centres in France, Spain and the UK.
calculated for each predictor coefficient. Predictors with
Baseline characteristics of participants with available
confidence intervals including zero were removed. All
information on NSAID use and family history of colo-
remaining predictors were then used to generate reduced
rectal cancer are presented in Supplementary Table 1,
elastic net penalized Cox regression models. The model se-
Additional File 1.
lection was conducted for colorectal cancer as a single end-
point (LiFeCRC score) and according to sex and cancer
Model development
subsite (colon/rectum). Variable selection and Cox regres-
The model development and model validation were per-
sion modeling were performed using R 3.6.1 (R Core Team)
formed and reported following the TRIPOD guidelines
[33], and the glmnet (version 2.0-18) [34] and survival (ver-
[23, 31] (Supplementary Table 2, Additional File 1). The
sion 2.44-1.1) [35] packages.
general workflow of model derivation, performance
evaluation, validation and model communication are
presented in Supplementary Fig. 1, Additional File 2. Absolute risk assessment
Overall, the LiFeCRC score was derived based on beta The individual 10-year absolute risk P (10y) for colorec-
coefficients for colorectal cancer risk estimated in Cox tal cancer was calculated using the following formula:Aleksandrova et al. BMC Medicine (2021) 19:1 Page 5 of 19
Pð10yÞ ¼ 1 − S m ð10yÞexpðRisk Scorei − Risk Scorem Þ the mean predicted risks and the observed complement
of the Kaplan-Meier survival of each decile was visually
The 10-year survival function estimate Sm (10y) was compared as a measure of calibration. Model perform-
calculated for average predictor variable values. The ance, including Harrell’s C-index and calibration plots,
average Risk Scorem and the individual Risk Scorei were was also evaluated in the validation cohort.
computed using the following formulas:
X Model communication
Risk Scorem ¼ β j predictor mean value j
In order to assist the translation of the generated statis-
Xj
tical model into an individual risk prediction equation,
Risk Scorei ¼ β j predictor valueij
j
we created a 10-year risk assessment nomogram as a
graphical model representation that allows risk estima-
The j index stands for a predictor variable of a Cox re- tion. For this purpose, we used the R [33] package rms
gression model and βj is the beta estimate. (version 5.1-3.1) [36]. In addition, we developed a user-
In additional analyses, the study population was strati- friendly risk calculator application using the R [33] pack-
fied according to predefined risk categories of low, inter- ages shiny (version 1.2.0) [37] and shinydashboard (ver-
mediate and high risk, based the 50th and 90th percentile sion 0.7.1) [38] that can be adapted for a web-based use.
of predicted risk in the derivation cohort. Incidence rates This application allows the prediction of individual colo-
and model selection characteristics across the so defined rectal cancer risk by including characteristics into input
risk categories in both the derivation and validation sam- fields. The input values are then evaluated using the vali-
ples have been assessed. dated colorectal cancer risk prediction model.
Model performance: discrimination and calibration Random survival forest
Model discrimination Random survival forest was used as an alternative ma-
Model discrimination was assessed based on Harrell’s C- chine learning method in order to prove model robust-
index as a measure similar to the receiver operating ness, i.e. assess whether the same set of predictors will
characteristic statistic that takes the censored nature of be selected. Each random survival forest was generated
data into account. This value represents the odds of the with a total number of 500 decision trees with 100
predicted probability of developing colorectal cancer be- unique data points on average in each terminal node
ing higher for those who actually develop colorectal can- and a maximum of 10 possible random split points to
cer compared to those who do not develop the disease. consider at each branch of a decision tree. A variable
To account for model optimism in terms of overfitting, importance measure for each predictor variable, describ-
bootstrapping with 1000 replications was performed. In ing the impact of using randomly permuted values of
bootstrapping, entries are randomly drawn with replace- this variable instead of observed values for the prediction
ment from a data set until the bootstrap sample has the of known entries, was then extracted from the random
size as the original dataset. For each bootstrap sample, survival forest. For the computation of random survival
an elastic net penalized Cox regression model was fitted. forests, the package “randomForestSRC” (version 2.6.1)
Harrell’s C-index of each bootstrap model was then cal- was used. Model performance was evaluated in the der-
culated for the bootstrap sample and the original data in ivation and validation cohort using Harrell’s C-index
each bootstrap replication. The difference of these values and calibration plots.
was averaged over all 1000 bootstrap replications to cal-
culate the amount of optimism for the C-index of the Sensitivity analyses
original model, which was used to calculate an In sensitivity analyses, we evaluated the added predictive
optimism-corrected C-index. This analysis was per- value of lifestyle data beyond age, using the following
formed in R [33] with the package rms (version 5.1-3.1) statistics: (1) improvement in model discrimination—
[36]. based on goodness of fit (likelihood ratio test), estimated
net change in Harrell’s C-index and continuous net re-
Model calibration classification improvement (NRI> 0); (2) improvement in
Calibration plots of estimated individual predicted risks model calibration based on comparison of calibration
of developing colorectal cancer in the next 10 years were plots and (3) net benefit of the model based on decision
derived from the penalized Cox regression model. These curve analysis. We also stratified the study population in
values were divided into deciles, and each decile’s mean the derivation and validation sample according to age
value was computed. The Kaplan-Meier survival func- groups: < 45 years; 45–65 years; > 65 years and calculated
tion at 10 years with 95% confidence interval was calcu- model performance characteristics (Harrell’s C-index
lated for each decile group. Subsequently, the trend of and NRI> 0) for the lifestyle-based model across theseAleksandrova et al. BMC Medicine (2021) 19:1 Page 6 of 19
categories. In addition, we also calculated the predicted the reduced model in men were daily alcohol consump-
10-year absolute risk of colorectal cancer for a prede- tion, dairy intake, dark bread and red meat, and in
fined “healthy” and “unhealthy” lifestyle pattern across women, height and processed meat. The estimated 10-
different age groups and a constant body height. In year mean absolute risk for colorectal cancer of the der-
subsample of the derivation cohort with available infor- ivation cohort was 0.78% in both sexes, 1.07% in men
mation, Harrell’s C-index was compared between models and 0.64% in women (Table 2). Table 3 provides an
with and without inclusion of NSAID use or family overview of selected variables by anatomical subsite,
history. To address model generalizability, we further colon and rectal cancer, overall and separately in men
evaluated model performance across subgroups by and women. An additional predictor that was retained in
selected variables, i.e. waist circumference, education, the model for rectal cancer was the intake of soft drinks.
smoking status (including level of smoking intensity) Notably, selected predictors in women were somewhat
and level of alcohol consumption. Finally, to account different for colon and rectal cancer. For colon cancer,
for the potential influence of competing risk of death the model included age, waist circumference, height,
(N = 23,774), we calculated the cumulative incidence smoking and vegetable intake, whereas for rectal cancer
adjusted for mortality and evaluated the discrimin- it included age, processed meat and soft drinks
ation of the reduced model based on Fine-Gray sub- (Table 3).
distribution hazard regression [39] in both the
derivation and validation samples.
Model performance: discrimination and calibration
Results Overall model discrimination was good with Harrell’s
Baseline characteristics C-index of 0.709 for the derived colorectal cancer risk
Table 1 shows the baseline characteristics of men and model. Optimism-adjusted Harrell's C index ranged
women in the derivation and validation cohorts. from 0.667 for the model for rectal cancer in women
Overall, the distribution of risk factors was similar to 0.716 for the model for colon cancer in both sexes
across both cohorts. In the derivation cohort, the (Table 4). Reduced models showed similar predictive
mean age at study baseline was 51.4 years, 67.5% of performance as the “full models” suggesting that
the participants were women, and mean age at colo- obtaining data on selected predictors would yield suf-
rectal cancer diagnosis was 66.0 years in women and ficient information and additional factors are not add-
66.4 years in men. Never-smokers, physically active ing predictive value to the model. The performance
and highly educated people comprised 49.1%, 10.3% in the validation cohort was similar for all models,
and 24.6% of the derivation cohort, respectively. The suggesting a high level of stability and a lack of over-
median follow-up time was 15.4 (interquartile range fitting. Calibration plots of derived colorectal cancer
13.2 to 16.9) years in the derivation cohort and 14.1 risk models in the derivation and validation sample
(interquartile range 10.5 to 16.0) years in the valid- overall and by sex are presented in Fig. 3. An overall
ation cohort. good calibration was observed based on the compar-
able intercepts for models across derivation and valid-
Model development ation samples.
Figure 2 illustrates the distribution of Cox regression co-
efficients of all predictor variables based on the boot-
strapped elastic net regularization. Selected variables in Model communication
the reduced model are highlighted based on the selec- Absolute risk formula
tion criterion of having a coefficient value of 0 not in- To provide assessment of the absolute 10-year risk of
cluded in the 95% confidence interval. Table 2 shows colorectal cancer for individuals with various combina-
derived colorectal cancer hazard ratios for all risk factors tions of risk factors, we prepared a formula with the fol-
(full model) and risk factors that remained after elastic lowing selected predictors:
net selection (reduced model). The selected predictors of
the overall colorectal cancer risk in men and women !
Colorectal cancer
included age, waist circumference, height, daily alcohol Absolute risk
consumption, smoking, physical activity, vegetables, within 10 years
dairy products, processed meat, and sugar and confec-
¼ 1 − S m ð10 yearsÞexpðRisk Scorei − Risk Scorem Þ
tionary (Table 2). The models derived separately for
men and women confirmed age, waist circumference,
¼ 1 − 0:9943expðRisk Scorei − 6:8089Þ
smoking and vegetable intake as consistent predictors
across both genders. Additional predictors retained inTable 1 Baseline characteristics of participants in the derivation and validation cohorts
Characteristics Derivation cohort Validation cohort
All participants Men Women All participants Men Women
N 255,482 83,101 172,381 74,403 29,259 45,144
Age at recruitment, years, mean (SD) 51.4 (9.7) 52.3 (9.0) 51.0 (9.9) 49.7 (9.6) 50.7 (9.3) 49.0 (9.8)
Age range, years 19.5 to 70.0 19.5 to 70.0 20.0 to 70.0 19.9 to 70.0 20.1 to 69.2 19.9 to 70.0
2
BMI, kg/m , mean (SD) 25.8 (4.3) 26.6 (3.6) 25.4 (4.5) 26.0 (4.2) 26.6 (3.6) 25.7 (4.5)
Waist, cm, mean (SD) 84.6 (12.9) 94.6 (10.0) 79.8 (11.3) 86.0 (12.5) 94.0 (10.2) 80.8 (11.0)
Aleksandrova et al. BMC Medicine
Height, cm, mean (SD) 165.8 (9.1) 174.3 (7.3) 161.7 (6.7) 167.3 (9.6) 175.5 (7.3) 162.1 (6.9)
Postmenopausal status, % 49.5 41.8
Ever use of hormone for menopause, % 26.0 23.8
Smoking status, %
(2021) 19:1
Smoker 23.5 31.3 19.7 27.0 32.3 23.5
Former 27.4 36.2 23.1 27.8 37.3 21.6
Never 49.1 32.4 57.2 45.3 30.4 54.9
Physical activity, %
Inactive 19.1 29.4 14.2 18.3 25.3 13.7
Moderately inactive 30.3 32.9 29.0 27.2 30.0 25.4
Moderately active 40.2 29.3 45.5 43.5 33.7 49.9
Active 10.3 8.5 11.2 11.0 11.0 11.0
Education, %
None 5.9 4.9 6.3 3.1 2.4 3.6
Primary school completed 27.0 30.6 25.2 29.2 24.8 32.1
Technical school/professional school 22.4 22.7 22.3 31.1 29.8 31.9
Secondary school 16.2 11.9 18.3 13.4 11.4 14.7
University degree 24.6 27.4 23.3 23.0 31.5 17.5
Not specified 4.0 2.5 4.7 0.2 0.2 0.3
Dietary intake, g/day, median (IQR)
Alcohol 6.6 (1.1 to 17.1) 14.4 (5.0 to 32.3) 4.1 (0.6 to 11.9) 7.8 (1.5 to 19.7) 16.4 (6.7 to 32.9) 4.2 (0.6 to 11.8)
Vegetables 196.9 (124.4 to 301.8) 179.7 (110.8 to 287.8) 204.9 (131.5 to 307.4) 130.0 (92.8 to 183.2) 124.0 (88.1 to 174.7) 133.9 (95.9 to 189.1)
Fruits 215.1 (117.1 to 340.8) 176.6 (88.5 to 313.3) 232.7 (132.4 to 351.8) 161.0 (94.1 to 264.7) 127.4 (73.9 to 225.3) 186.0 (105.6 to 290.3)
Dark bread 28.6 (0.0 to 91.8) 34.9 (0.0 to 112.5) 27.9 (0.0 to 87.8) 91.4 (15.0 to 150.2) 115.8 (49.3 to 179.6) 73.2 (8.0 to 128.0)
Dairy products 283.0 (159.5 to 447.5) 257.3 (130.0 to 434.3) 295.2 (173.1 to 451.7) 265.1 (150.0 to 434.7) 256.8 (136.7 to 447.0) 270.2 (158.8 to 428.7)
Red meat 38.2 (17.3 to 65.4) 49.7 (24.8 to 80.5) 33.8 (13.9 to 57.3) 44.8 (23.9 to 74.5) 61.9 (33.5 to 93.1) 36.9 (19.8 to 61.1)
Poultry 16.1 (5.8 to 30.9) 16.4 (7.3 to 34.3) 15.8 (4.8 to 29.3) 13.2 (6.5 to 24.3) 14.6 (7.3 to 25.5) 12.4 (5.9 to 23.4)
Page 7 of 19Table 1 Baseline characteristics of participants in the derivation and validation cohorts (Continued)
Characteristics Derivation cohort Validation cohort
All participants Men Women All participants Men Women
Processed meat 19.2 (6.4 to 37.9) 27.9 (10.8 to 51.9) 16.4 (5.4 to 31.8) 34.5 (17.9 to 59.6) 47.6 (27.4 to 76.7) 27.8 (14.6 to 48.7)
Fish 21.4 (9.3 to 37.0) 24.3 (12.6 to 41.2) 19.7 (7.7 to 34.9) 16.1 (6.0 to 30.3) 17.6 (6.3 to 32.2) 15.3 (5.9 to 27.9)
Sugar and confectionary 31.6 (16.3 to 55.2) 36.9 (19.2 to 65.0) 29.6 (15.2 to 51.0) 35.3 (18.7 to 60.0) 41.0 (21.7 to 70.3) 32.3 (17.1 to 54.1)
Soft drinks 9.5 (0.0 to 85.7) 16.4 (0.0 to 100.0) 6.6 (0.0 to 74.3) 8.7 (0.0 to 85.7) 19.3 (0.0 to 118.7) 3.8 (0.0 to 66.0)
BMI body mass index, IQR interquartile range, SD standard deviation
Aleksandrova et al. BMC Medicine
(2021) 19:1
Page 8 of 19Aleksandrova et al. BMC Medicine (2021) 19:1 Page 9 of 19
Fig. 2 Average Cox regression coefficients with 95% confidence intervals after bootstrapped elastic net regularization. Bootstrapping was
performed over 1000 repetitions. Selected variables with a confidence interval not including 0 are highlighted in red
values. Second, the total number of points is calculated
Risk Scorei ¼ 0:0781 Agei ðyearsÞ
by adding up all the points obtained in the previous step,
þ0:0117 Waist circumferencei ðcmÞ
and its value is identified on the total point scale. Finally,
þ0:0115 Body heighti ðcmÞ
the probability of an event corresponding to the total
þ0:1292 Daily alcoholi ðyes ¼ 1; no ¼ 0Þ
points of the individual is represented on the risk scale.
þ0:2125 Smokingi ðyes ¼ 1; no ¼ 0Þ
As a practical example, we estimated the 10-year risk of
− 0:0964 Physically activei ðyes ¼ 1; no ¼ 0Þ
colorectal cancer, for individuals with two different com-
− 0:0773 Vegetable intakei ðper 100g=dayÞ
binations of ages and lifestyle factors, representing low-
− 0:0166 Dairy products intakei ðper 100g=dayÞ
risk and high-risk extremes: individual 1 was 45 years
þ0:0808 Processed meat intakei ðper 50g=dayÞ old (50 points) with a body height of 166 cm (7.5 points),
þ0:0268 Sugar and confectionary i ðper 50g=dayÞ a waist circumference of 70 cm (3 points) and healthy
lifestyle behaviour (low daily alcohol consumption (0
Values for Sm (10 years) and Risk Scorem are given in points), non-smoker (0 points), physically active (0
Table 2. Absolute risk for different timespans can be calcu- points), 430 g daily vegetable intake (7 points), 630 g
lated by replacing Sm in the formula accordingly. The sur- daily dairy products intake (2.5 points), 0 g daily proc-
vival function estimates for timespans between 0 and 20 essed meat intake (0 points), and 5 g daily sugar and
years are shown in Supplementary Fig. 2, Additional File 2. confectionary intake (0 points)), and individual 2 was 65
Incidence rates and model selection characteristics across years old (90 points) with a body height of 166 cm (7.5
predefined risk categories (low, intermediate and high risk) points), a waist circumference of 100 cm (12 points) and
with cut points at 0.62% and 1.60% 10-year absolute risk rather unhealthy lifestyle behaviour (high daily alcohol
are presented in Supplementary Table 4, Additional File 1, consumption (3 points), smoker (5 points), physically in-
for both the derivation and validation sample. active (2.5 points), 80 g daily vegetable intake (14.5
points), 70 g daily dairy products intake (5 points), 60 g
Nomogram daily processed meat intake (2.5 points), and 90 g daily
Figure 4 shows a nomogram of the weights and points sugar and confectionary intake (1.5 points)). The total
of the colorectal cancer risk prediction score allowing number of points of the various prediction indicators
estimation of an individual’s probability to develop colo- was ~ 70 and ~ 143.5 and the corresponding absolute
rectal cancer over a 10-year period. The nomogram is predicted 10-year risk of colorectal cancer was ~ 0.2%
characterized by a scale corresponding to each variable, (risk score of ~ 5.7) and ~ 3–3.5% (risk score of ~ 8.6)
a point scale, a total point scale and a probability scale. for individual 1 and individual 2, respectively.
The use of the nomogram is simple and involves 3 steps.
First, on the scale for each variable, the value corre- Web-based calculator
sponding to a specific individual is read and the point As an alternative approach to model communication, we
scale is used to calculate the points for all variable developed a web-based calculator for the estimation of aTable 2 Characteristics of colorectal cancer prediction models developed in the derivation cohort, overall and by sex
Predictor variables Hazard ratios (95% confidence intervals), p value
Both sexes Men Women
Full model* Reduced model† Full model* Reduced model† Full model* Reduced model†
(LiFeCRC score)
Aleksandrova et al. BMC Medicine
Age at recruitment, per 10 years 2.23 (2.13 to 2.33) < .001 2.18 (2.09 to 2.29) < .001 2.19 (2.04 to 2.35) < .001 2.12 (1.98 to 2.27) < .001 2.26 (2.13 to 2.40) < .001 2.21 (2.08 to 2.34) < .001
Waist circumference, per 10 cm 1.12 (1.09 to 1.15) < .001 1.12 (1.09 to 1.16) < .001 1.19 (1.13 to 1.25) < .001 1.19 (1.13 to 1.25) < .001 1.06 (1.01 to 1.10) 0.008 1.05 (1.01 to 1.09) 0.023
Height, per 10 cm 1.13 (1.08 to 1.17) < .001 1.12 (1.08 to 1.17) < .001 1.04 (0.96 to 1.11) 0.333 1.14 (1.06 to 1.22) < .001 1.16 (1.08 to 1.24) < .001
Daily alcohol consumption, high 1.14 (1.06 to 1.23) < .001 1.14 (1.06 to 1.22) < .001 1.18 (1.07 to 1.31) 0.002 1.18 (1.06 to 1.30) 0.002 1.06 (0.96 to 1.18) 0.245
(2021) 19:1
Ever smoker, yes 1.24 (1.16 to 1.33) < .001 1.24 (1.15 to 1.32) < .001 1.31 (1.17 to 1.47) < .001 1.31 (1.17 to 1.46) < .001 1.15 (1.05 to 1.26) 0.003 1.16 (1.06 to 1.27) 0.001
Physically active, yes 0.89 (0.82 to 0.97) 0.010 0.91 (0.83 to 0.99) 0.026 0.93 (0.83 to 1.04) 0.185 0.87 (0.76 to 0.99) 0.029
Vegetables, per 100 g/day 0.92 (0.90 to 0.95) < .001 0.93 (0.90 to 0.95) < .001 0.89 (0.85 to 0.93) < .001 0.89 (0.85 to 0.92) < .001 0.95 (0.92 to 0.99) 0.009 0.93 (0.90 to 0.97) < .001
Fruits, per 100 g/day 0.99 (0.97 to 1.01) 0.180 0.99 (0.96 to 1.02) 0.424 0.98 (0.96 to 1.01) 0.196
Dark bread, per 50 g/day 0.98 (0.96 to 1.01) 0.147 0.96 (0.93 to 0.99) 0.015 0.97 (0.94 to 1.00) 0.070 1.02 (0.98 to 1.06) 0.329
Dairy products, per 100 g/day 0.98 (0.97 to 0.99) 0.006 0.98 (0.97 to 1.00) 0.017 0.98 (0.96 to 1.00) 0.016 0.98 (0.96 to 1.00) 0.048 0.99 (0.97 to 1.01) 0.198
Red meat, per 50 g/day 1.03 (0.99 to 1.08) 0.158 1.06 (1.00 to 1.13) 0.046 1.08 (1.02 to 1.14) 0.010 0.98 (0.91 to 1.06) 0.577
Poultry, per 50 g/day 1.03 (0.95 to 1.12) 0.461 1.07 (0.96 to 1.20) 0.210 0.99 (0.87 to 1.12) 0.845
Processed meat, per 50 g/day 1.08 (1.02 to 1.14) 0.006 1.08 (1.03 to 1.14) 0.004 1.04 (0.97 to 1.11) 0.296 1.13 (1.03 to 1.24) 0.010 1.12 (1.02 to 1.23) 0.020
Fish, per 50 g/day 0.99 (0.93 to 1.05) 0.665 1.00 (0.93 to 1.09) 0.914 0.92 (0.83 to 1.02) 0.109
Sugar and confectionary, 1.03 (1.00 to 1.05) 0.028 1.03 (1.00 to 1.05) 0.022 1.02 (0.99 to 1.05) 0.118 1.04 (0.99 to 1.09) 0.088
per 50 g/day
Soft drinks, per 100 g/day 1.02 (1.00 to 1.03) 0.097 1.01 (0.99 to 1.04) 0.392 1.02 (1.00 to 1.05) 0.095
Survival functionm (10 years)‡ 0.9944 0.9943 0.9920 0.9919 0.9953 0.9952
Risk Scorem§ 6.8953 6.8089 6.2600 5.5356 6.4758 6.7039
Absolute Riskm (10 years)# 0.78% 0.78% 1.07% 1.07% 0.64% 0.64%
*Full models were derived by using all available predictor variables
†Reduced models were derived by using bootstrapped elastic net variable selection with all predictor variables of the full model
‡Survival functionm (10 years): 10-year survival function estimate of average predictor values of the derivation cohort. Estimates for timespans between 0 and 20 years are shown in Supplementary Fig. 2, Additional
File 2
§Risk Scorem: Mean risk score calculated based on the sum of beta coefficient products of average predictor values of the derivation cohort
#Absolute Riskm: 10-year mean absolute risk of the derivation cohort
Page 10 of 19Table 3 Characteristics of colon and rectal cancer prediction models developed in the derivation cohort, overall and by sex
Predictor variables Hazard ratios (95% confidence intervals), p-value
Colon cancer Rectal cancer
Aleksandrova et al. BMC Medicine
Both sexes Men Women Both sexes Men Women
Age at recruitment, per 10 years 2.30 (2.17 to 2.44) < .001 2.11 (1.93 to 2.30) < .001 2.31 (2.15 to 2.49) < .001 2.02 (1.87 to 2.18) < .001 2.10 (1.88 to 2.35) < .001 1.86 (1.68 to 2.04) < .001
Waist circumference, per 10 cm 1.14 (1.10 to 1.18) < .001 1.27 (1.19 to 1.35) < .001 1.07 (1.02 to 1.12) 0.006 1.10 (1.05 to 1.15) < .001
Height, per 10 cm 1.14 (1.08 to 1.19) < .001 1.17 (1.08 to 1.28) < .001 1.15 (1.08 to 1.23) < .001
Daily alcohol consumption, high 1.12 (1.02 to 1.22) 0.017 1.21 (1.07 to 1.37) 0.002 1.27 (1.08 to 1.50) 0.004
(2021) 19:1
Ever smoker, yes 1.18 (1.08 to 1.28) < .001 1.18 (1.02 to 1.35) 0.024 1.14 (1.02 to 1.28) 0.018 1.32 (1.17 to 1.49) < .001 1.44 (1.19 to 1.74) < .001
Physically active, yes 0.88 (0.80 to 0.98) 0.025 0.84 (0.72 to 0.99) 0.035
Vegetables, per 100 g/day 0.91 (0.89 to 0.94) < .001 0.90 (0.85 to 0.94) < .001 0.93 (0.89 to 0.97) 0.001 0.92 (0.88 to 0.96) < .001 0.88 (0.82 to 0.93) < .001
Fruits, per 100 g/day
Dark bread, per 50 g/day 0.96 (0.93 to 0.99) 0.017 0.94 (0.90 to 0.98) 0.008
Dairy products, per 100 g/day 0.98 (0.96 to 0.99) 0.007 0.96 (0.93 to 0.98) 0.001
Red meat, per 50 g/day
Poultry per, 50 g/day
Processed meat, per 50 g/day 1.20 (1.10 to 1.31) < .001 1.27 (1.09 to 1.47) 0.002
Fish, per 50 g/day
Sugar and confectionary, per
50 g/day
Soft drinks, per 100 g/day 1.03 (1.00 to 1.06) 0.025 1.06 (1.02 to 1.10) 0.006
Survival functionm (10 years)* 0.9966 0.9953 0.9970 0.9979 0.9968 0.9982
Risk Scorem† 7.156 5.802 7.137 6.8764 3.9117 3.2985
Absolute Riskm (10 years)‡ 0.48% 0.62% 0.41% 0.28% 0.42% 0.21%
*Survival functionm (10 years): 10-year survival function of average predictor values of the derivation cohort
†Risk Scorem: Mean risk score calculated based on the sum of beta coefficient products of average predictor values of the derivation cohort
‡Absolute Riskm: 10-year mean absolute risk of the derivation cohort
Page 11 of 19Aleksandrova et al. BMC Medicine (2021) 19:1 Page 12 of 19
Table 4 Model selection and discrimination in the derivation and validation cohorts
Colorectal cancer Colon cancer Rectal cancer
Selected predictors Both sexes Men Women Both sexes Men Women Both sexes Men Women
Age at recruitment, per 10 years ● ● ● ● ● ● ● ● ●
Waist circumference, per 10 cm ● ● ● ● ● ● ●
Height, per 10 cm ● ● ● ● ●
Daily alcohol consumption, high ● ● ● ● ●
Ever smoker, yes ● ● ● ● ● ● ● ●
Physically active, yes ● ● ●
Vegetables, per 100 g/day ● ● ● ● ● ● ● ●
Fruits, per 100 g/day
Dark bread, per 50 g/day ● ● ●
Dairy products, per 100 g/day ● ● ● ●
Red meat, per 50 g/day ●
Poultry, per 50 g/day
Processed meat, per 50 g/day ● ● ● ●
Fish, per 50 g/day
Sugar and confectionary, per 50 g/day ●
Soft drinks, per 100 g/day ● ●
Harrell’s C-index
Full model
Derivation cohort 0.710 0.700 0.702 0.718 0.708 0.718 0.705 0.705 0.677
Optimism corrected * 0.708 0.697 0.700 0.716 0.707 0.715 0.704 0.703 0.668
Validation cohort 0.715 0.707 0.700 0.708 0.727 0.700 0.730 0.689 0.693
Reduced model
Derivation cohort 0.710 0.699 0.700 0.717 0.705 0.717 0.703 0.700 0.668
Optimism corrected* 0.709 0.698 0.699 0.716 0.704 0.715 0.701 0.698 0.667
Validation cohort 0.714 0.708 0.699 0.708 0.727 0.698 0.728 0.687 0.696
*Harrell's C-index for the derivation cohort corrected for optimism by bootstrapping with 1000 replications. For each bootstrap sample a new model is fitted and
the C-index calculated for the bootstrap sample and the original derivation cohort. The difference between these two C-indices is then averaged over all
bootstrap replications and then subtracted from the original C-index
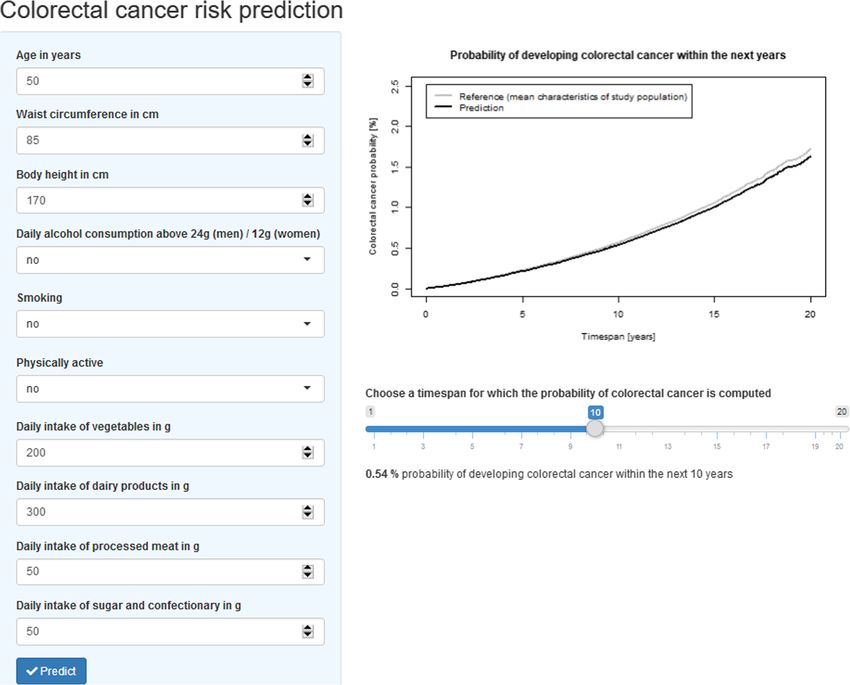
personalized colorectal cancer risk based on the vali- dairy products intake as additional important predictors,
dated LiFeCRC score. A graphical illustration of the ap- whereas the model for men showed smoking and sweets
plication layout with predicted and absolute risk values and confectionary consumption as additional important
for a modifiable time span is presented in Fig. 5. Of note, predictors. Overall, the discrimination (Supplementary
the results produced by the web-based calculator should Fig. 3, Additional File 2) and calibration (Supplementary
be interpreted considering that competing risk of mor- Fig. 4, Additional File 2) of the random survival forest
tality was not included in the absolute risk calculation. based colorectal cancer risk prediction model was com-
parable to the Cox regression model.
Random survival forest
Results of random survival forest-based relative variable Sensitivity analysis
importance for colorectal cancer risk prediction are pre- In a sensitivity analysis, we evaluated to what extent life-
sented in Supplementary Fig. 3, Additional File 2. The style data added predictive value to the colorectal cancer
main selected predictors remained similar as in the Cox risk model based on age only. The addition of the life-
regression model, confirming model robustness. The style variables resulted in a statistically significantly in-
highest relative importance was observed for age, creased goodness of fit (likelihood ratio test p < 0.001).
followed by waist circumference, red and processed meat The estimated NRI> 0 was 0.307 (95% confidence interval
intake, height and vegetable consumption. The model 0.264 to 0.352) indicating an improvement in model per-
for women showed, in addition, height, dark bread and formance. Supplementary Fig. 5, Additional File 2Aleksandrova et al. BMC Medicine (2021) 19:1 Page 13 of 19 Fig. 3 Calibration plots of 10-year colorectal cancer risk. Predicted risk is compared against observed risk in the derivation and validation cohorts, overall and by sex. Observed risk is based on the complement of the Kaplan-Meier survival curve displays the model calibration and net benefit curves for (Supplementary Table 5, Additional File 1). We further an aged-based model and the LiFeCRC model that add- estimated the predicted 10-year absolute risk of colorec- itionally included lifestyle factors for overall colorectal tal cancer for an arbitrary predefined “healthy” and “un- cancer. An improved calibration and higher net benefit healthy” lifestyle, across different age groups and a were observed for colorectal cancer risk thresholds be- constant body height (Supplementary Fig. 6, Additional tween 0.7 and 2.5% for the LiFeCRC model compared to File 2). For example, an individual aged 45 years with a the age-based model. In analyses stratified according to body height of 166 cm adopting a predefined “unhealthy age groups, model performance was higher in individuals lifestyle” (waist circumference of 100 cm, high daily alco- < 45 years and adding lifestyle data contributed to im- hol consumption, smoker, physically inactive, 80 g daily proved reclassification statistics, i.e. higher NRI> 0, sug- vegetable intake, 70 g daily dairy products intake, 60 g gesting relative importance of lifestyle data assessment daily processed meat intake and 90 g daily sugar and for risk prediction at younger ages (< 45 years), i.e. confectionary intake) has a 3.6 times higher absolute risk NRI> 0 = 0.364 (95% confidence interval 0.084 to 0.575) of colorectal cancer within the next 10 years compared Fig. 4 Nomogram of colorectal cancer absolute risk prediction over 10 years
Aleksandrova et al. BMC Medicine         (2021) 19:1                                                                              Page 14 of 19

 Fig. 5 Application for the colorectal cancer risk model. Example for a hypothetical individual data entry and risk calculation

to a person of the same age and body height, adopting a                       Fine-Gray model taking competing risk of death into ac-
predefined “healthy lifestyle” (waist circumference of 70                     count could be observed (C-index = 0.710).
cm, low daily alcohol consumption, non-smoker, physic-
ally active, 430 g daily vegetable intake, 630 g daily dairy                  Discussion
products intake, 0 g daily processed meat intake and 5 g                      In this large European prospective cohort study, we de-
daily sugar and confectionary intake). In a subsample                         veloped and validated the LiFeCRC score, as a lifestyle-
with available information, addition of information on                        based prediction model for the prevention of colorectal
NSAID use or family history of colorectal cancer to the                       cancer in asymptomatic populations across Europe. Be-
list of predictors did not further improve model per-                         yond age, the variables retained in the model were waist
formance beyond main lifestyle variables (Supplementary                       circumference, height, daily alcohol consumption, smok-
Fig. 7, Additional File 2). The results did not reveal                        ing status, physical activity and dietary intakes of vegeta-
marked differences in model discrimination among sub-                         bles, dairy products, processed meat and sugar and
groups by waist circumference, education, smoking sta-                        confectionary. Separate models were also developed for
tus and levels of alcohol consumption (Supplementary                          men and women and for colon and rectal cancer sub-
Table 6, Additional File 1). Furthermore, no substantial                      types. The model showed good calibration and discrim-
differences could be seen between the Kaplan-Meier sur-                       ination properties to identify individuals at all levels of
vival function and the cumulative incidence function                          colorectal cancer risk. Modifiable lifestyle factors con-
taking competing risk into account (data not shown).                          tributed to model performance and accuracy beyond age
Also, no differences in the discrimination ability of the                     alone and could improve reclassification statistics
Aleksandrova et al. BMC Medicine   (2021) 19:1                                                                       Page 15 of 19

especially in younger age groups (< 45 years). A user-            whether lifestyle information is important for absolute risk
friendly colorectal cancer risk nomogram and a web cal-           assessment beyond age, we evaluated the model perform-
culator      were     developed      to    facilitate   model     ance across different age groups. These results showed that
communication.                                                    the model performance was highest in the group of partici-
   Currently, the target population for colorectal cancer         pants < 45 years old and suggested this age period as a rele-
screening is mainly selected based on age alone (i.e. 50 years    vant time window for early cancer prevention. We further
or above). Although age is undoubtedly an important pre-          calculated the 10-year absolute risk of colorectal cancer
dictor of colorectal cancer as shown in our data, informa-        across different ages comparing predefined “healthy” versus
tion on modifiable lifestyle factors allows provision of          “unhealthy” lifestyle pattern based on selected model pre-
preventive health recommendations for individuals at risk         dictors. These analyses suggested that at a given age and
[40]. Lifestyle-based models have been suggested in medical       height, i.e. for an individual aged 45 years with a body
practice as important tools that could be used to identify        height of 166 cm, following the unhealthy lifestyle pattern
those most likely to benefit from lifestyle interventions and     would lead to 3.6 times higher absolute risk of colorectal
to contribute to behaviour change interventions [41]. A           cancer within the next 10 years compared to a person of
number of intervention studies focusing on changing life-         the same age and body height, adopting a healthy lifestyle.
style for colorectal cancer prevention reported significant       These results highlight the importance of adherence to
effects on the target behaviours [42–46]. In those studies,       healthy lifestyle for the long-term reduction of colorectal
tailored approaches that enable personalized feedback re-         cancer risk. In support of these data, recent analysis based
garding individual lifestyle patterns were suggested as more      on a large German population sample showed that healthy
successful compared to generic approaches [42–47]. Des-           lifestyle could improve prospects for avoiding colorectal
pite lifestyle interventions representing a powerful cost-        cancer in the long term even beyond individual genetic risk
effective strategy for colorectal cancer prevention, there has    [52].
been little incentive on the side of health professionals to         The elaborated phenotyping and detailed assessment of
advocate lifestyle-based recommendations [48]. Risk assess-       nutritional data in the EPIC cohort allowed selection of
ment tools such as the LifeCRC score could facilitate im-         several factors not commonly depicted in previous colo-
proved advocacy on the side of health professionals and           rectal cancer risk prediction models. Compared to previ-
motivate or empower individuals to implement behaviour            ous models that used data on self-reported BMI, in the
changes [47, 49]. Targeting lifestyle factors in those at high-   EPIC cohort data was available on waist circumference
est risk may be particularly relevant for younger age groups      measurements and these were among the main predictors
that may profit most from early preventive interventions          [53, 54]. Unlike BMI which does not take body fat distri-
aimed at encouraging behavioural changes [47].                    bution into account, waist circumference provides a proxy
   A number of previous models incorporated lifestyle             for the centrally located visceral fat shown especially rele-
data with common covariates including self-reported               vant for colorectal cancer development [53, 55]. Only a
BMI (body mass index), alcohol consumption and smok-              few previous models included data on height which was
ing [18–21]. Recently, a model based on BMI, smoking,             selected as another important predictor by our model [56,
alcohol, red and processed meat, fruits, vegetables and           57]. Greater height could provide reflection of an in-
physical activity demonstrated C-statistics of 0.66 and           creased standard of living characterized by greater avail-
0.68 in men and women, respectively [41]. Compared                ability of energy and protein-rich foods, lower physical
with this and other published models that also include            activity and a reduced incidence of childhood infections
family history and more complex variables [18, 19, 50,            that follow different patterns across Europe [58]. Physical
51], the EPIC lifestyle-based model showed a compar-              activity was also selected as a predictor of colorectal can-
able and even improved performance based on Harrell’s             cer risk, particularly in the model for women. These data
C-index of 0.710 in both derivation and validation cohort.        support recent findings from the Women’s Health Initia-
As previously reported, the highest C-statistic for colorectal    tive [59] and the overall notion of the importance of phys-
cancer risk prediction model ranged from 0.67 in UK Bio-          ical activity for the prevention of colorectal cancer [60].
bank to 0.69 EPIC validation samples [20]. Compared to            Beyond red meat [56, 57, 61] and vegetable intake [56,
our model, that model included 13 variables: age, ethnicity,      62–64], additional dietary predictors selected by our
education, BMI, family history, diabetes, oestrogen expos-        model included low dairy intake and high intakes of sug-
ure, non-steroidal anti-inflammatory use, physical activity,      ary products, including soft drinks. Guiding individuals to-
smoking, alcohol, red meat intake and multivitamin use.           wards      healthy      dietary     and     lifestyle    choices
Having the strong discrimination statistics for models based      could complement colorectal cancer screening as means
on age alone, additional predictors were shown to add little      for colorectal cancer prevention.
improvement to model C-statistics in previous studies as             The selected model performed similarly well as the model
well as in our data [18, 20, 51]. To address the question         with the full list of predictors, suggesting that it can be used
Aleksandrova et al. BMC Medicine    (2021) 19:1                                                                                  Page 16 of 19

as a simpler approach for determining high-risk individuals.       model application and suggested a nomogram and a web-
Thus, individuals and health professionals would need to           tool to enable risk communication. Several potential limi-
inquire about fewer lifestyle factors, avoiding the use of         tations of our study warrant discussion. First, we derived
long questionnaires and minimizing the burden of data col-         the risk equations based on a study population comprising
lection on both the patient and clinician side. However, for       of volunteers. Volunteer-based studies are prone to in-
a comprehensive lifestyle recommendation, all healthy be-          clude individuals who are often more likely to have
haviours could be considered in additional counselling. The        favourable exposure and health profiles compared to those
model performance among women was modest, and better               who do not. Thus, higher prevalence of healthy behaviours
in men, likely because some risk factors were more strongly        in our sample as compared to the general population
associated with risk among men. The general distribution           could have resulted in overestimated absolute risk esti-
and influence of risk factors may differ geographically            mates. Second, with the exception of age and the an-
across populations and additional model elaboration and            thropometric measures, we relied on data of self-reported
adaptation of country-specific risk models should be further       predictors and routinely collected cancer outcomes.
considered. Ultimately, research is needed to assess the           Though any risk prediction tool made publicly available
feasibility and effectiveness of the current lifestyle-based       online would also rely on self-reported data, more accur-
risk assessment tool on health behaviour modification,             ate risk factor ascertainment would possibly improve over-
colorectal cancer risk factor improvement, and overall po-         all model discrimination and calibration. Nevertheless, our
tential for colorectal cancer prevention when incorporated         model has shown a good discrimination and excellent cali-
into the primary care setting, particularly as a pre-screening     bration. Third, dietary data was collected using food fre-
instrument of high-risk patients. More work is also war-           quency questionnaires as a commonly applied dietary
ranted for the refinement of the risk communication tool           assessment method in epidemiology, however future
before its general integration into practice. Finally, in future   model application should consider further adaptation and
research, additional predictors, including relevant bio-           feasibility assessment to facilitate model communication
marker and genetic variables, should be further explored on        in practice. Fourth, we based analyses on lifestyle informa-
the way towards improved precision prevention of colorec-          tion collected at study baseline and, therefore, could not
tal cancer. For example, in a systematic review of 29 studies,     account for potential behavioural changes during study
addition of common single nucleotide polymorphisms                 follow-up. Finally, the model was developed based on data
(SNPs) to other risk factors in models developed in asymp-         available in the EPIC cohort and did not include some po-
tomatic individuals in the general population increased            tentially important predictors, such as NSAID use or fam-
model discrimination by 0.01 to 0.06 [19]. Overall, the re-        ily history of colorectal cancer. However, we have
ported C-statistic ranged from 0.56 to 0.63 for SNPs alone         conducted a sensitivity analysis using data from study cen-
and in combination with other risk factors, respectively           tres that collected these data and the model performance
[19]. Further studies are warranted to evaluate whether            was not altered.
employing genetic risk profiling beyond established risk fac-
tors can be useful to identify individuals at high colorectal      Conclusions
cancer risk.                                                       Despite being one of the leading causes of cancer mor-
   Our work has several strengths. The EPIC study pro-             bidity and mortality, colorectal cancer is largely prevent-
vided an ideal setting to develop a lifestyle-based colo-          able. LiFeCRC score based on age and lifestyle data
rectal cancer risk prediction model, given its large               accurately identifies individuals at risk for incident colo-
sample size, various population backgrounds and a long             rectal cancer in European populations and could con-
follow-up time of over 20 years. Furthermore, the study            tribute to improved prevention through motivating
provided a variety of objectively measured anthropomet-            lifestyle change at the individual level.
ric data along with dietary and lifestyle information.
Therefore, the current model is the first developed on a           Supplementary information
European-wide study population sample, allowing as-                Supplementary information accompanies this paper at https://doi.org/10.
sessment of risk across a broad range of diet and lifestyle        1186/s12916-020-01826-0.

behaviours. Given the large sample size, we were also
                                                                    Additional file 1: Supplementary Table 1. Baseline characteristics of
able to validate the risk scores in an independent subset           participants with available information on NSAID use and colorectal
of the EPIC populations. Additionally, we derived the               cancer family history. Supplementary Table 2. TRIPOD Checklist -
colorectal cancer risk estimates empirically following              Prediction Model Development and Validation. Supplementary
                                                                    Table 3. Factors considered for inclusion in the LiFeCRC score.
state-of-the-art and novel machine learning approaches,             Supplementary Table 4. LifeCRC model selection characteristics across
i.e. random survival forest, considering various predic-            pre-defined risk categories in the derivation and validation samples. Sup-
tors simultaneously and the gradient in risk across the             plementary Table 5. Added predictive performance for age and
                                                                    lifestyle-based (LiFeCRC) colorectal cancer risk prediction models. Results
full distribution of risk levels. Finally, we considered
You can also read