Development of Star-Schema Model for Lecturer Performance in Research Activities
←
→
Page content transcription
If your browser does not render page correctly, please read the page content below
(IJACSA) International Journal of Advanced Computer Science and Applications,
                                                                                                                       Vol. 12, No. 9, 2021

      Development of Star-Schema Model for Lecturer
            Performance in Research Activities
                                      M. Miftakul Amin1, Adi Sutrisman2, Yevi Dwitayanti3
                    Department of Computer Engineering, Politeknik Negeri Sriwijaya, Palembang, Indonesia 1, 2
                         Department of Accounting, Politeknik Negeri Sriwijaya, Palembang, Indonesia 3

    Abstract—In this study, the researchers developed a                      Currently, universities have quite large data and are spread
multidimensional data model to investigate the activities of             across several sub-units within it. These data will continue to
lecturers in universities in carrying out research activities as part    grow over time. Upper management needs tools to generate
of the Three Pillars of Higher Education. Information about              information and to assist the decision-making process [1]. Data
lecturers' research activities has been managed using spreadsheet        Warehouse (DW) technology can be used to extract important
(excel) documents. Thus, access and analysis of the information          information from data scattered across information system
were limited. Data warehouse development was carried out                 management units into centralized integrated storage, to
through several stages, namely requirement analysis, data source         provide management information needs, view data from
analysis, multidimensional modeling, ETL process, and
                                                                         various perspectives, detailed information, and historical data.
reporting. The information generated in this data warehouse
(DW) can be used as one of the business intelligence (BI) models              A Data Warehouse is an integrated repository of
in universities. In this study, the star-schema model was used in        information, making it possible to query and analyze the data.
designing dimension tables and fact tables to facilitate and speed       The basic idea is to carry out the process of extracting,
up the query process. The information generated in this study            filtering, and integrating relevant data. The development of
can be used by management in universities to make decisions and          data warehouses in universities is still rarely carried out, even
strategic planning. The results of this study can also be used as        though universities are very rich in the information contained
one of the important information in the preparation of
                                                                         in them. One of the factors is that business transactions in
institutional accreditation data and study program accreditation.
                                                                         universities are non-commercial [2]. This is also reinforced by
   Keywords—Data         warehouse        (DW);        star-schema;      Yu [3] which states that the implementation of a data
multidimensional data; business intelligence (BI)                        warehouse is underestimated in a university environment.
                                                                         Because many people think that universities are non-profits
                         I.   INTRODUCTION                               organizations. Whereas with the increasing number of study
                                                                         programs, lecturers, employees, and students in the future, a
    Lecturers as one of the intellectual assets in higher
                                                                         university must consider the integration of a data warehouse-
education have one of the activities that are part of the Three
                                                                         based decision support system to make better decisions.
Pillars of Higher Education, namely carrying out research and
community service. Every year there is a lot of funding to carry             In this study, the researchers developed a multidimensional
out research and community service activities. This funding              data model to investigate various perspectives and points of
source comes from the ministries of education, culture,                  view related to research activities carried out by lecturers in
research, and technology, as well as from local governments,             universities. This research is important to do in order to
and internal universities.                                               provide relevant information for top management at the
                                                                         Politeknik Negeri Sriwijaya in decision making and strategic
   This research and community service information is used as
                                                                         management.
one of the assessment criteria in the preparation of study
program accreditation instruments and university accreditation.              This research is organized as follows. Section 2 describes
Currently, at Politeknik Negeri Sriwijaya, research data and             some of the theoretical concepts that underlie this research,
community service are documented at the Research and                     such as the concept of a data warehouse and multidimensional
Community Service Center (Pusat Penelitian dan Pengabdian                data modeling. Section 3 describes the methodology and stages
kepada Masyarakat abbreviated as P3M) Politeknik Negeri                  in model development. Section 4 describes the experimental
Sriwijaya, in the form of spreadsheet (excel) file data, without         setup, research results, and discussion. Section 5 contains
being further managed into useful information for upper                  conclusions.
management in the decision-making process.
                                                                                              II. LITERATURE REVIEW
    Referring to the research and community service handbook
published by the Ministry of Education, Culture, Research, and           A. Implementation of Data Warehouse in Higher Education
Technology in 2020, there are 13 types of research funding                   Based on research conducted by Bassil [4] it is mentioned
schemes, and 10 community service funding schemes [8]. With              that data warehouse development in universities can be
this large funding opportunity, it is appropriate for universities       implemented by transforming operational databases into data
to carry out adequate data management in managing research               warehouses that can be used in the decision-making process
information and community service.                                       and perform data analysis, prediction, and forecasting. The

                                                                                                                              74 | P a g e
                                                           www.ijacsa.thesai.org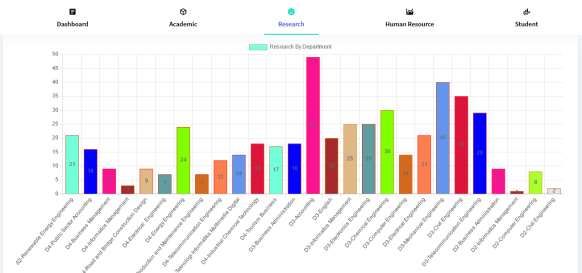
(IJACSA) International Journal of Advanced Computer Science and Applications,
Vol. 12, No. 9, 2021
development of this data warehouse can be done through C. Multidimensional Data Modeling
several stages, namely data extraction, data cleansing, data A multidimensional data can be implemented into a star-
transforming, and data indexing and loading. An operational schema model and can use join operations to relate the tables
database is a regular database that is intended to run a business that exist in it during the query process. The star-schema model
on a database and support daily transactions [5]. consists of a fact table in the middle, then surrounded by a
Bogdanova [6] developed a model known as CaMeLOT as dimension table [11]. A good multidimensional data in data
an Educational Framework for Conceptual Data Modelling. By warehouse development should have a simple database
using Bloom’s taxonomy modeling is carried out as a part of structure. It aims to speed up the query process which will be
software engineering. This study proposes that the model can carried out in the analytical stage. The fact table contains facts
be used in the preparation of a curriculum that can adapt the or measures that are used as business parameters, while the
use of technology in the implementation of learning in dimension table contains descriptions for query processing.
universities. Several advantages are obtained when implementing a star-
A previous study conducted by Santoso [1] mentions that schema in data warehouse development, including simplifying
the development of data warehouses in universities can be query, simplifying reporting logic, improving query,
categorized into 2 groups, namely traditional and modern. A performance, and accelerating data aggregation [17].
modern data warehouse is characterized by the use of big data In the star-schema model, the fact table and dimension
technology in its implementation. This data can be taken from table are connected by a key known as a surrogate key which
various information spreads on the internet such as social acts as the primary key of the dimension table and becomes a
media, sensors, blogs, videos, and audio as data sources. foreign key in the fact table [18]. This relation occurs logically
Meanwhile, the traditional data warehouse sources are only and can be used to perform the JOIN process in the Query
limited to the transaction and operational data that exist in the command.
university environment.
Yulianto [7] has developed a multidimensional data III. METHOD
warehouse model for the Integrated Academic Fee (IAF) in This study involved data on the activities of lecturers in
universities. This research follows 4 stages in the development research at the Politeknik Negeri Sriwijaya within a span of 3
of Business Intelligence (BI), namely preparation, integration, years, from 2018 to 2020. The activity data comes from
analysis, and visualization. The results of the study can be used research activities organized by the Ministry of Education,
as part of the admission DSS. Culture, Research, and Technology, and activities organized by
the university internally.
Asroni et.al [16] investigated the implementation of data
warehouses in universities to manage alumni data through data Meanwhile, the software used in building the system in this
tracer studies. The output of this research is to produce a research is the framework Codeigniter, with MariaDB/MySQL
reporting system using the SQL Server Analysis Service as the database engine, PHP as the scripting engine, and
(SSAS) tool to view various dimensions such as alumni profile, Apache as the webserver.
department, faculties, and salaries. This information is
Fig. 1 is a stage in the development of a multidimensional
presented in the form of graphs, tables, and diagrams.
database. The stages of system development in this study refer
B. Data Warehouse Concept to what was conveyed by Zea [12] who built a data warehouse
A data warehouse is a collection of integrated databases system in several stages as follows:
which is subject-oriented and designed to support decision- Requirement analysis, in this stage some information is
making functions [9]. The data flow in the data warehouse formulated which will later be presented in the data
comes from the operational level which is transformed into the warehouse.
data warehouse [10]. According to Thakur [13] mentions that
data warehouses have data needs that change from time to Data source analysis, the data source is taken from the
time. Thus, this will cause dynamic changes in data storage. A existing database in the university's internal
data warehouse is a database designed to perform analysis of environment.
decision making, where data and information are generated Multidimensional modeling, this stage is carried out to
from the ETL (Extract, transform, Load) [14]. formulate a data warehouse design to describe the
Seen from the infrastructure aspect, the data warehouse relationship between fact table data and dimension
consists of several technical components that can be grouped tables.
into two categories, namely operation infrastructure and
ETL process, this stage is used to carry out the data
physical infrastructure, such as server hardware, operating
retrieval process, transformation process, and data
system, network software, database software, LAN, WAN,
storage into the data warehouse.
vendor resources, persons, procedure and training [15].
Reporting, this stage presents data in the form of
summary information and other important information
that acts as output in system design.
75 | P a g e
www.ijacsa.thesai.org(IJACSA) International Journal of Advanced Computer Science and Applications,
Vol. 12, No. 9, 2021
Requirement
In Fig. 3, there is surrogate_key (SK) in each table, both
Analysis fact table, and dimension table as a unique record marker in the
table and facilitates the data query process. Based on the need
for data source analysis that has been defined in the previous
Data Source stage, there are several dimension tables and fact tables as
Analysis follows:
1) lecturer_dim: The lecturer_dim table is used to store
Multidimensional information on the lecturer who acts as a researcher in research
Modelling activities.
2) department_dim: The department_dim table is used to
store information on departments that are part of research
ETL Process activities and the home base of lecturers or researchers.
3) contract_dim: The contract_dim table is used to store
research contract information in every research activity carried
Reporting out by lecturers.
4) schema_dim: The schema_dim table is used to store
Fig. 1. Step of Design System. research scheme data that can be followed by a lecturer in
conducting research activities.
IV. RESULT AND ANALYSIS 5) date_dim: The date_dim table is used in the system to
A. Requirement Analysis store date information and hierarchical information such as
month name, month number, quarter, and year.
This study aims to determine for the availability of data and
6) funding_fact: The funding_fact table is used to store
information as shown in Table I. The information presented in
the dashboard as an application on the end-user side can be information on research conducted by lecturers. This table is a
displayed in the form of tables and graphs. A data table is used fact table that contains the research history.
to display data in tabular form in which there are facilities for In each table, both dimension table and fact table, there are
sorting, searching, and paging. Meanwhile, the information in effective_date and expiry_date columns to indicate whether a
the form of graphs is presented to display a summary of the record is active or not used in the system for query and data
research data that makes it easier to understand the retrieval processes.
information.
Data Source Dahsboard
B. Data Source Analysis
Data Warehouse Reporting
Fig. 2 is an architectural model developed in this study. The SISAK
Extrract
data source comes from data sources originating from the Clean Query
Staging DW
academic information system (Sistem Informasi Akademik, Transform
Load
Output
abbreviated as SISAK) to retrieve lecturer and department data SIMP3M
Refresh Visualization
information. Meanwhile, data on lecturers' research activities
come from research information system data (SIMP3M) to Analysis
obtain data on research schemes, research contracts, and
research funding.
Fig. 2. Architecture of System.
Furthermore, at the data warehouse stage, the staging
process is carried out to store the extracted data from the data TABLE I. INFORMATION REQUIREMENT
source which has been modified successively to finally be
loaded into the multidimensional database in the data Requirement
No.
warehouse (DW). Then, through the web browser application, Information Format Timeframe
there is a dashboard to process reporting, query, visualization, 1 All Lecturer/ Researcher Table All Period
and analysis of the previously formed multidimensional data. 2 All Research Funding Table All Period
Data derived from the data source can be taken from tables, 3 All Research Contract Table All Period
or with data in the form of csv files. This csv file type is used 4 All Research Scheme Table All Period
to facilitate the ETL process which will later be implemented 5 All Departement Table All Period
in the system. 6 Top 5 Lecturer/ Researcher Chart All Period
7 Top 5 Department Research Chart All Period
C. Multidimensional Modeling
8 Top 5 Research Scheme Chart All Period
Researchers logically designed a multidimensional data 9 Research By All Department Chart All Period
model using a star schema as can be seen in Fig. 3. This star-
10 Research By Department and Year Chart Custome Filter
schema model is used logically to facilitate the query process
later. This star-schema consists of a number of dimension 11 Trend Research Funding Chart Custome Filter
tables and fact tables. 12 Funding Amount Chart Custome Filter
76 | P a g e
www.ijacsa.thesai.org(IJACSA) International Journal of Advanced Computer Science and Applications,
Vol. 12, No. 9, 2021
lecturer_dim
lecturer_sk
lecturer_id
lecturer_name
sex
pob
dob
religion
Address
email
telephone
handphone
front_title
back_title
effective_date
expiry_date
funding_fact
funding_sk schema_dim
contract_sk schema_sk
contract_dim
schema_id
contract_sk lecturer_sk
schema_abbreviation
contract_number schema_sk
schema_name
contract_date department_sk
schema_category
effective_date date_sk
schema_management
expiry_date funding_title
funding_person effective_date
funding_amount expiry_date
department_dim date_dim
department_sk date_sk
department_id date
department_name month
department_eng month_no
department_level quarter
effective_date year
expiry_date effective_date
expiry_date
Fig. 3. Star-Schema Model.
D. ETL Process whole part and change data capture (CDC). The whole part is a
In the development of this data warehouse, the activity that process to retrieve overall data from data sources when filling
is quite time-consuming is the ETL (Extraction, out the data warehouse. These data are master data or reference
Transformation, and Loading). This activity includes the data, such as lecturer data, department data, and schemas
source extraction and performing data population. This activity which in the timeline review rarely add or update data.
is to ensure that the data taken from the data source Table I is Meanwhile, data on contract and funding is processed by the
guaranteed its integrity and validity. Table I is a matrix that CDC because they are transaction data and there is often be a
describes the ETL (Extract, Transform, Load) process process of adding and updating data. Pulling data with pull
mechanism in the system design. The extract is a step to get mode is done with the last data change made from the previous
data from a data source which is then stored in the data pull mode stage.
warehouse, while the transform process is a process to prepare
TABLE II. SOURCE EXTRACTION MATRIX
data, and load is a process to store data into the data
warehouse. In practice, this ETL stage is not a separate stage, Source Extraction
but sometimes it is a stage that is an integrated series of Data Source Data Warehouse Extraction
processes. Table Mode
Loading Type
Referring to Table II, there are two mechanisms for the data lecturer lecturer_dim Whole, Pull SCD
extraction process from a data source, namely, push and pull. department department_dim Whole, Pull SCD
Pull mode is a process to pull data from the data source which
is carried out by the data warehouse system. In the design of schema schema_dim Whole, Pull SCD
this system, all data retrieval processes use pull mode. contract contract_dim CDC, Pull
unique contract
Meanwhile, push mode is a data extraction process carried out number
by the data source to send data to the data warehouse. unique contract
funding funding_fact CDC, Pull
number
Judging from the data, whether to be sent or withdrawn into
the data warehouse, there are two approaches [11], namely, n/a date_dim n/a pre-population
77 | P a g e
www.ijacsa.thesai.org(IJACSA) International Journal of Advanced Computer Science and Applications,
Vol. 12, No. 9, 2021
The process of loading data for the lecturer_dim, elect `b`.`lecturer_name` AS
department_dim, and schema_dim tables is carried out with `lecturer_name`,`c`.`department_level` AS
SCD (Slowly Changing Dimension) type 1 by replacing the `department_level`,`c`.`department_eng` AS
data in certain columns where the data is updated. Meanwhile, `department_eng`,count(0) AS `qtyresearch` from
the contract_dim and funding_fact tables are carried out with
(((((`funding_fact` `a` join `lecturer_dim` `b`) join
the CDC when the data update process occurs based on the
`department_dim` `c`) join `schema_dim` `d`) join
unique contract number. Meanwhile, the date_dim table is not
contained in the data source but is generated in the data `contract_dim` `e`) join `date_dim` `f`) where `a`.`lecturer_sk`
warehouse system with pre-loading population mode by = `b`.`lecturer_sk` and `a`.`department_sk` =
retrieving and extracting the date parameters during the ETL `c`.`department_sk` and `a`.`schema_sk` = `d`.`schema_sk`
process. and `a`.`contract_sk` = `e`.`contract_sk` and `a`.`date_sk` =
`f`.`date_sk` group by `b`.`lecturer_name` order by count(0)
As an additional feature in the development of this project, desc limit 5
part of the data is taken from data sources that come from
RESTful web services. This allows two heterogeneous data Meanwhile, in Fig. 5 there is information in the form of
sources to communicate through a web services interface. The graphs that describe the distribution of research activities of
data taken from these web services is used to display summary lecturers spread across several departments within Politeknik
information in the form of graphic visualizations, making it Negeri Sriwijaya. This information is generated in the all-
easier to understand the information presented. period time range according to the number of data records in
the database. Information is presented in a bar chart where the
E. Reporting
x-axis is the department's data, while the y-axis is the number
At this reporting stage, a dashboard is provided in the form of studies conducted by lecturers as researchers in the
of a web application that can present data in the form of tables department.
and graphs. The information presented in the dashboard is
generated from the existing SQL commands in the system. The F. Performance Evaluation
use of star-schema was chosen in this study to facilitate and To see the extent of the performance generated from the
speed up the query process. developed model, a performance evaluation is carried out by
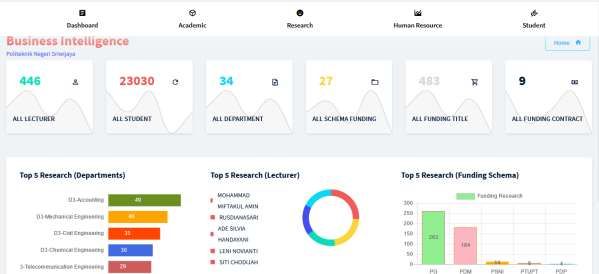
Fig. 4 provides information on the dashboard display that is looking at the payloads (bytes) and response time (milli
run on the end-user, side, at the top, there are main menu second) of the system. By using network monitoring, a snippet
options consisting of the dashboard, academic, research, of data is obtained from a web page which is displayed as
human resource, and student. Meanwhile, at the bottom, there shown in Table III. It can be seen in Table III that regardless of
the number of payloads or data transferred from the server to
is summary information about the number of lecturers, the
the client, judging from the response time, the execution time is
number of students, the number of departments, the number of
not much different. As discussed in the ETL Process section,
research schemes, the number of research funding, and the
the data source used in this model comes from an internal
number of contract funding. In the next section, there is
domain and a RESTful Web Services from a different web
ranking information in the form of top 5 for department,
domain (cross domain).
researcher, and funding scheme from lecturer research
activities carried out. The following is an example of a query
command that is used to produce output in the form of a top 5
research (lecturer) graph as shown in Fig. 4.
Fig. 4. Dashboard of System.
78 | P a g e
www.ijacsa.thesai.org(IJACSA) International Journal of Advanced Computer Science and Applications,
Vol. 12, No. 9, 2021
Fig. 5. Information of Research by all Departments.
TABLE III. PERFORMANCE OF APPLICATION MODEL Request/Response Performance
Services Evaluation Performance 2000
Number Domain Payload (Bytes) Time (ms)
1500
1. Cross Domain 1670 62
1000
2. Cross Domain 972 46
500
3. Internal Domain 983 61
0
4. Internal Domain 814 73
1 2 3 4 5 6 7 8 9 10 11 12 13 14 15 16 17 18
5. Internal Domain 645 71
Payload (Bytes) Time (ms)
6. Internal Domain 710 61
7. Internal Domain 743 65 Fig. 6. Payloads and Response Time of System.
8. Cross Domain 652 61 V. CONCLUSION
9. Cross Domain 654 60 Through this research, a multidimensional data model has
10. Cross Domain 651 63
been built that contains information about the research
activities of lecturers in the Politeknik Negeri Sriwijaya. This
11. Internal Domain 527 63 study includes 446 lecturer data records, 34 department data
12. Internal Domain 528 64
records, 483 record research data records spread over the
period of the study 2018, 2019, and 2020. The information
13. Internal Domain 526 62 generated from the developed model can help higher education
14. Internal Domain 573 60
management carry out strategic planning. and decision-making.
In addition, the resulting information can be used in the
15. Cross Domain 748 54 preparation of data in accreditation instruments, both for
16. Cross Domain 719 63
university or institutional accreditation and study program
accreditation. The star-schema model was chosen in this study
17. Cross Domain 711 63 to facilitate the multidimensional database modeling process
18. Cross Domain 1060 62
and to speed up the query process carried out in the reporting
and presentation stages of data in a graphical form that can be
By looking at Fig. 6 provides an overview of the displayed in a web browser application. Further research from
distribution of payloads and response times executed by web this research is optimizing the data analysis process, and
browsers. By looking at the fast and relatively stable response developing data mining applications from data that has been
time for any amount of payloads, the model of this system successfully processed.
development can be utilized in developing business REFERENCES
intelligence applications by using star schemes and RESTful [1] L. W. Santoso and Yulia, “Data Warehouse with Big Data Technology
web services in the application architecture. for Higher Education”, Procedia Computer Science, vol. 124, pp. 93-99,
2017.
79 | P a g e
www.ijacsa.thesai.org(IJACSA) International Journal of Advanced Computer Science and Applications,
Vol. 12, No. 9, 2021
[2] M. Baranovic, M. Madunic, I. Mekterovic, "Data warehouse as a part of [11] D. Darmawikarta, “Dimensional Data Warehousing with MySQL: A
the higher education information system in Croatia", in Proceedings of Tutorial”, Brainy Software Corp. 2007.
the 25th International Conference on Information Technology Interfaces [12] O.M. Zea, J.P. Gualtor, S.L. Mora, "A Holistic View of Data
(ITI), 2003, pp. 121 - 126. Warehousing in Education", IEEE Access, vo. 6, p. 64659-64673, Okt
[3] X. Yu, “The Application of Data Warehouse in Teaching Management 2018, DOI:10.1109/ACCESS.2018.2876753.
in Colleges and Universities”, J. Phys.: Conf. Ser. 1738 012090, 2021. [13] G. Thakur, A. Gosain, “A Comprehensive Analysis of Materialized
[4] Y. Bassil, “A Data Warehouse Design for A Typical University Views in a Data Warehouse Environment”, (IJACSA) International
Information System”, Journal of Computer Science & Research Journal of Advanced Computer Science and Applications, Vol. 2, No. 5,
(JCSCR), vo. 1, no. 6, 2012, pp. 12 – 17. 2011, pp. 76-82.
[5] W. Inmon, “Building the Operational Data Store”, 2nd ed. John Wiley & [14] A. Chakir, H. Medromi, A. Sayouti, “Actioins for Data Warehouse
Sons, 1999. Success”, (IJACSA) International Journal of Advanced Computer
[6] D. Bogdanova and M. Snoeck , "CaMeLOT: An Educational Science and Applications, Vol. 4, No. 8, 2013, pp. 130-133.
Framework For Conceptual Data Modelling", Information and Software [15] A.F. Neamah, “Adoption of Data Warehouse in University
Technology (2019), doi: https://doi.org/10.1016/j.infsof.2019.02.006. Management: Wasit University Case Study”, 2021 J. Phys.: Conf. Ser.
[7] A. A. Yulianto, Y. Kasahara, “Data Warehouse System for 1860 012027.
Multidimensional Analysis of Tuition Fee Level in Higher Education [16] Asroni, T. B. Arimbi, S. Riyadi, “Implementing of Data Warehouse
Institutions in Indonesia”, (IJACSA) International Journal of Advanced Data Alumni using the Single Dimensional Data Store Method”, J.
Computer Science and Applications, Vol. 11, No. 6, 2020, pp. 541-550. Phys.: Conf. Ser. 1471 012021.
[8] DRPM, “Panduan Peneltian dan Pengabdian Kepada Masyarakat Edisi [17] K.A. Shobirin, A.P.S. Ikandar, I.B.A. Swamardika, "Data Warehouse
XIII”, Kementrian Pendidikan, Kebudayaan, Riset, dan Teknologi, Schemas using Multidimensional Data Model for Retail", International
2020. Journal of Engineering and Emerging Technology, vol. 2, no. 1,
[9] Rudy, E. Miranda, E. Suryani, “Implementation of Data Warehouse, January-June 2017, pp.84-86.
Datamining and Dashboard for Higher Education”, Journal of [18] Y. Peng, "Metadata Based Visualization System for Multidimensional
Theoretical and Applied Information Technology, vo. 64, no. 3, 214, pp. Data", Advances in Intelligent Systems Research, vol. 134, 2017,
710-717. pp.564-567.
[10] W. H. Inmon, “Building the Data Warehouse 4 th “, Wiley Publishing inc,
2005.
80 | P a g e
www.ijacsa.thesai.orgYou can also read