DIFFERENTIAL RESPONSE TO NACL OSMOTIC STRESS IN SEQUENTIALLY HARVESTED HYDROPONIC RED AND GREEN BASIL AND THE ROLE OF CALCIUM
←
→
Page content transcription
If your browser does not render page correctly, please read the page content below
ORIGINAL RESEARCH
                                                                                                                                               published: 09 March 2022
                                                                                                                                          doi: 10.3389/fpls.2022.799213

                                             Differential Response to NaCl
                                             Osmotic Stress in Sequentially
                                             Harvested Hydroponic Red and
                                             Green Basil and the Role of Calcium
                                             Michele Ciriello 1† , Luigi Formisano 1† , Georgios A. Soteriou 2 , Angelos Kyratzis 2 ,
                                             Stefania De Pascale 1 , Marios C. Kyriacou 2 and Youssef Rouphael 1*
                                             1
                                              Department of Agricultural Sciences, University of Naples Federico II, Naples, Italy, 2 Department of Vegetable Crops,
                                             Agricultural Research Institute, Nicosia, Cyprus
                             Edited by:
                           Rita Maggini,
                 University of Pisa, Italy   Basil (Ocimum basilicum L.) is a heterogeneous reservoir of bioactive compounds
                         Reviewed by:        that provide recognized benefits to human health, rendering it a model aromatic
                  Libia Iris Trejo-Téllez,
                                             herb. Notwithstanding the application of nutritional stress, such as sodium chloride
          Colegio de Postgraduados
                    (COLPOS), Mexico         (NaCl) salinity, which mainly affects the primary metabolism, it also triggers adaptive
                      Mustapha Gorai,        mechanisms that involve the production of bioactive secondary metabolites. Genotype
          University of Gabes, Tunisia
                           Cristina Cruz,
                                             selection and the exogenous application of calcium chloride (CaCl2 ) help minimize
        University of Lisbon, Portugal       salinity’s suppressive effects on growth. In the present study, we hypothesize that
                        Biljana Bojovic,
                                             the ratio of different salt types may induce differential responses in the function of
      University of Kragujevac, Serbia
          Mohhammad Moghaddam,               preharvest factors in hydroponic basil culture. In this perspective, the stock nutrient
 Ferdowsi University of Mashhad, Iran        solution (Control) was supplemented with 12.5 mm NaCl + 8.33 mm CaCl2 (Moderate
                  *Correspondence:           Mix), 25 mm NaCl (Moderate NaCl), 25 mm NaCl + 16.66 of CaCl2 (High Mix), or
                     Youssef Rouphael
             youssef.rouphael@unina.it
                                             50 mM of NaCl (High NaCl) with the objective of evaluating the different impact of salinity
     † These   authors have contributed
                                             on yield, sensory quality (color and aroma profile), and the accumulation of minerals
                    equally to this work     and bioactive compounds in two successive harvests of green and red basil cultivars.
                                             Although more productive (+39.0% fresh weight) than the red one, the green cultivar
                   Specialty section:
         This article was submitted to       exhibited higher susceptibility to salinity, especially under the High Mix and High NaCl
        Crop and Product Physiology,         treatments. The addition of CaCl2 to the High Mix solution reduced the sodium by 70.4%
               a section of the journal
                                             and increased the total polyphenols by 21.5% compared to the equivalent isomolar
            Frontiers in Plant Science
                                             solution (High NaCl). The crop performance in terms of fresh and dry yield improved for
         Received: 21 October 2021
        Accepted: 10 February 2022           both cultivars at the second cut. Regardless of cultivar and salt treatment, successive
          Published: 09 March 2022           harvests also increased the concentration of phenols and vitamin C (29.7 and 61.5%,
                              Citation:      respectively) while reducing (−6.9%) eucalyptol, the most abundant aromatic compound
               Ciriello M, Formisano L,
              Soteriou GA, Kyratzis A,       in both cultivars. Salinity, as well as the mechanical stress induced by cutting, improved
      De Pascale S, Kyriacou MC and          the functional quality of basil. However, the productive responses to the conditions
        Rouphael Y (2022) Differential
                                             imposed in our work once again highlighted the importance of genetic background.
    Response to NaCl Osmotic Stress
in Sequentially Harvested Hydroponic         Specifically, CaCl2 in the Moderate Mix solution preserved fresh leaf weight in the most
    Red and Green Basil and the Role         stress-sensitive green cultivar.
                            of Calcium.
          Front. Plant Sci. 13:799213.       Keywords: Ocimum basilicum L., nutritional stress, successive harvests, isomolar concentrations, volatile
       doi: 10.3389/fpls.2022.799213         compounds, calcium chloride

Frontiers in Plant Science | www.frontiersin.org                                    1                                            March 2022 | Volume 13 | Article 799213
Ciriello et al.                                                                                                    Basil Response to NaCl Stress

INTRODUCTION                                                             anionic proportions or single ions, may boost the bioactive
                                                                         phytochemical content of vegetables within the optimal range
Basil (Ocimum basilicum L.) is a native herbaceous plant of              (Rouphael and Kyriacou, 2018).
southern Asia, also known as the “king of herbs” for its fragrant,           A prerequisite to achieving these targets is to identify
delightful, and colorful leaves (Ciriello et al., 2020; Formisano        the optimal balance between exposure time and phenological
et al., 2021b). As a culinary herb, it is preferably used fresh to       stage of stress application, as there is strong crop intraspecific
improve the aroma and appearance of salads, pizza, meat, and             and interspecific genetic variability toward stress tolerance
fish dishes (Corrado et al., 2020a,b). According to vernacular           (Rouphael et al., 2018). Moderate salt concentrations in the
knowledge, basil has wound-healing properties and its leaves and         soil solution effectively trigger metabolic pathways involved in
flowering tops are used for preparing infusions claimed to have          the production of secondary metabolites in the context of a
sedative, antispasmodic, stomachic, diuretic, and antimicrobial          concerted adaptive mechanism against oxidative damage induced
effects (Ahmed et al., 2019; Amor et al., 2021). Furthermore, it         by salinity (Tarchoune et al., 2013). However, salinity levels
is also used to treat indigestion and as a vermifuge due to its          exceeding the crop’s tolerance threshold can induce morpho-
bioactive content and high nutraceutical value (Ch et al., 2015).        physiological and metabolic changes capable of retarding
These secondary metabolites of aromatic herbs are a precious             and/or inhibiting plant growth (Ntatsi et al., 2017). Salinity
reservoir of bioactive molecules that the pharmaceutical industry        damage is primarily co-induced by excess NaCl, which jointly
could use to develop new drugs and improve their natural                 triggers osmotic (low water potential) and ion stress (toxicity
chemical diversity (David et al., 2015). In this respect, recent         and ion-specific imbalance) (Munns and Tester, 2008; Colla
scientific research has highlighted how genotype and agronomic           et al., 2013b). The combination of both stressors leads to
practices, such as successive harvests, can be a valuable tool           chlorophyll and carotenoids pigment degradation, stomatal
toward increasing the levels of desired secondary metabolites            closure, and photosystem II (PSII) blockage, with a consequent
(Nicoletto et al., 2013; Ciriello et al., 2021a,b).                      reduction in carbon organization and impaired translocation
    In the previous three decades, research efforts were focused         and uptake of critical nutrients (das Neves et al., 2008;
mainly on boosting the desirable phytochemicals (e.g., ascorbate,        Liu et al., 2012).
carotenoids, glucosinolates, polyamines, and polyphenols) in                 Calcium, due to its role as a structural component of
fruits and vegetables through plant breeding and biotechnology,          membranes and cell walls, is crucial for plant survival under
but have yet achieved limited commercial success because                 suboptimal environmental conditions (Colla et al., 2013b;
of safety issues (Poiroux-Gonord et al., 2010). For instance,            Cheruth et al., 2016). Its regulatory role in nutrient uptake
the disproportional increase in some secondary metabolites               processes, implicated in ensuring the proper integrity and
generated through breeding and biotechnology (e.g., a 36-                permeability of cell membranes, mitigates the ionic effect of
fold increase in kaempferol-rutinoside, a 20-fold increase in            NaCl (Borgognone et al., 2014a). Several authors have suggested
carotenoids, and glucosinolates) has been found genotoxic                that the exogenous application of calcium may alleviate the
(Rouphael and Kyriacou, 2018). Moreover, the improvement                 harmful effects induced by excess NaCl in model crops such as
of plant phytochemicals through breeding constitutes a costlier          wheat (Triticum aestivum L.), tomatoes (Solanum lycopersicum
approach than crop management practices. Therefore, the                  L.), peas (Pisum sativum L. cv. Argona), and sunflowers
manipulation of phytochemicals through controlled agro-                  (Helianthus annuus L.) (Bonilla et al., 2004; Zhou and Xiao,
environmental conditions (air and root zone temperature,                 2010; Borgognone et al., 2014a). Specifically, calcium drives
light quality and intensity, carbon dioxide enrichment, and              ion-selective transport and maintains the key K/Na and Ca/Na
vapor pressure deficit), as well as innovative crop management           ratios at optimal levels by reducing the cytosolic Na uptake
practices (nutritional eustress, nutrient solution management,           (Nedjimi and Daoud, 2009).
and biofortification) constitutes an approach balancing                      Most studies on the salt stress tolerance of vegetable crop
safety, cost, and effectiveness (Poiroux-Gonord et al., 2010).           species have focused on the role of NaCl as the predominant
Unsurprisingly, this approach has attracted the interest of              salt (Bernstein et al., 2010; Zahedi et al., 2011; Barbieri et al.,
food technologists and extension specialists as it additionally          2012). Only a few of these studies have additionally evaluated
quells consumers’ concerns over genetic modification of food             the calcium-induced ameliorative effects on the growth and
products (Kyriacou and Rouphael, 2018). In this perspective,             physiology of crops, such as cucumber (Cucumis sativus L. cv.
nutrient solution management posits as a significant toolbox             Palmera) (Trajkova et al., 2006), basil (Ocimum basilicum L.
for improving the functional quality of vegetal food (Rouphael           cv. Thai Siam Queen) (Scagel et al., 2017), marjoram (Satureja
and Kyriacou, 2018). As demonstrated in the current work,                montana) (Hegazy et al., 2019), chicory (Cichorium spinosum)
soilless culture may facilitate the effective and precise control        (Ntatsi et al., 2017), lettuce (Lactuca sativa L. cv. Lollo Rossa)
of the plant-nutrient interface to achieve target concentrations         (Borghesi et al., 2013; Cheruth et al., 2016), sorghum (Sorghum
in key secondary metabolites (Fallovo et al., 2009a,b; Colla             bicolor L. Monench, cv. ICI-5521) (Dashti et al., 2009), and
et al., 2013a; Borgognone et al., 2016). Moreover, accurate              wheat (Nemat Alla et al., 2014). However, these authors mainly
application of chemical eustress without soil interaction, such          used variable NaCl molar concentrations without distinguishing
as the controlled deprivation of macronutrients, exposure                the osmotic from the ionic effect and without assessing the
to mild or moderate salinity [Sodium Chloride (NaCl)],                   natural sensitivity of the cultures to sodium (Na) and chlorine
and sustained exposure of the roots to variable cationic and             (Cl). To date, few studies have investigated the ameliorative

Frontiers in Plant Science | www.frontiersin.org                     2                                    March 2022 | Volume 13 | Article 799213
Ciriello et al. Basil Response to NaCl Stress
effects of CaCl2 on NaCl-induced salt stress using isomolar Growth, Yield, and CIELab Colorimetric
concentrations of the two salts (Colla et al., 2013b; Borgognone Index Measurements
et al., 2014a,b).
At 42 and 65 days after transplanting (DAT) (June 9-Cut1 and
In the present study, we hypothesize that not only different
July 2-Cut2), and just before flowering, the plants were harvested.
kinds of salt but also their ratio may induce differentiated
At each cut, 10 plants per experimental unit were sampled,
responses in basil crops. Understanding these responses could
immediately weighed, and the leaves were separated. The fresh
help growers pursue appropriate agricultural practices to
weight (FW), number, and total leaf area were determined using
improve plant tolerance to salinity, enhance the plant secondary
the LI-COR 3100C area meter (LI-COR Biosciences, Lincoln, NE,
metabolome and enable efficient production under prevailing
United States). The plant tissues were dried in a ventilated oven at
suboptimal conditions. Based on this hypothesis, the objective
65◦ C for 72 h for total and leaf dry weight (DW) determination;
of the present work was to evaluate the effect of two salts
the latter was used to determine leaf dry matter (DM) percentage
(NaCl and CaCl2 ), added at isomolar concentrations to the
(%) as follows: DM = 100 × leaf DW/leaf FW. Samples were
stock nutrient solution (Control) in a hydroponic greenhouse
finely ground and sieved with a cutting-grinding head mill (IKA , R
system, with respect to the growth, quality, and volatile aromatic
Staufen im Breisgau, BW, Germany). An aliquot of fresh ground
components of green (cv. Mammolo) and red (cv. Red Rubin)
leaves was immediately placed in liquid nitrogen and stored at
basil (O. basilicum L.), harvested twice during the crop cycle (first
−80◦ C for future qualitative analysis.
and second cut).
On the same dates (42 and 65 DAT), colorimetric
measurements of the CIELab color space were made on the
MATERIALS AND METHODS adaxial surface of 30 healthy and fully expanded leaves for
treatment using a portable Minolta CR-300 Chroma Meter
Experimental Site and Design and (Minolta Camera Co., Ltd., Tokyo, Kantō, Japan), calibrated
according to the manufacturer’s instructions. As defined by
Management of the Nutrient Solution the Commission Internationale de l’Éclairage (CIE), color was
The experimental trial was carried out at the “Torre Lama”
expressed according to the three components L∗ (lightness), a∗
experimental farm of the University of Naples Federico II –
(greenness), and b∗ (yellowness) by which the Chroma (C∗ ) and
Department of Agriculture (DIA) located in Bellizzi (SA, Italy;
Hue angle (h◦ ) values were determined.
lat. 43◦ 310 N, long. 14◦ 580 E; alt. 60 m above sea level). The
trial was conducted in a glass greenhouse 10 m wide, 30 m
long, and 3 and 4.5 m high at the eaves and ridge, respectively, Total Nitrogen, Nitrate, and
from April 29, 2015, to July 2, 2015. Twenty days after sowing Macronutrient Determination
(April 29, 2015; DAT 1), two basil (O. basilicum L.) cultivars Finely ground dry leaf samples were analyzed by the
with different pigmentation “Mammolo” (hereafter “Green”; Kjeldahl method for total nitrogen determination and by
L’ortolano, Cesena, FC, Italy) and “Red Rubin” (hereafter “Red”; ion chromatography for macronutrients [phosphorus (P), sulfur
Ortomio, Forlì, FC, Italy) were transplanted into square anti- (S), potassium (K), calcium, magnesium (Mg), sodium, and
spiral pots (0.1 m × 0.1 m × 0.15 m) filled with 1.3 L volume of chlorine] and nitrate, following the protocols described by
a mixture (v/v) consisting of 1/3 perlite (Vigorplant, Fombio, LO, Bremner (1965) and Formisano et al. (2021a), respectively.
Italy) and 2/3 peat (Vigorplant, Fombio, LO, Italy). The seedlings Briefly, for the total nitrogen determination, 0.25 g of sample
were arranged in rows with a spacing of 0.30 m × 0.15 m yielding was mixed with 7 mL of 96% H2 SO4 (Carlo Erba Reagents Srl.,
a density of 22 plants m−2 . Milan, MI, Italy), a catalyst (Velp Scientifica, Usmate Velate,
R
The plants were arranged according to a factorial design MB, Italy), and 10 mL of 30% H2 O2 (Carlo Erba Reagents Srl.,
with three replicates in which a non-saline control (Control) vs. Milan, MI, Italy). The obtained mixture was heated at 420◦ C
four saline nutrient solutions (Moderate Mix, Moderate NaCl, with a DK 20 Heating Digester (Velp Scientifica, Usmate Velate,
R
High Mix, High NaCl), two basil cultivars (Green and Red), MB, Italy) until mineralization (30 min). Mineralized samples
and two successive harvests (Cut1 and Cut2) were considered as were distilled with a UDK 140 distiller (Velp Scientifica, Usmate
R
factors. Each experimental unit (i.e., replicate) included 15 plants.
The standard nutrient solution (NS; Control) was a Hoagland
modified as follows: 13.0 mM NO3 -N, 1.0 mM NH4 -N, 1.75 mM
TABLE 1 | Total ion concentration and sodium chloride (NaCl) and calcium
S, 1.5 mM P, 5.0 mM K, 4.5 mM Ca, 2 mM Mg, 20 µM Fe, 9 µM chloride (CaCl2 ) concentration in saline nutrient solutions.
Mn, 0.3 µM Cu, 1.6 µM Zn, 20 µM B, and 0.3 µM Mo. Saline
NS were prepared by adding isomolar concentrations of NaCl Treatment NaCl CaCl2 Total ion concentration
and CaCl2 to the standard NS (Table 1). The NS was prepared
mM mM mM
using osmotized water and distributed through a drip irrigation
system (1 dripper/plant with a flow rate of 2 L/h). To avoid Control 0 0 0
large fluctuations in EC, pH, and the accumulation of salts in the Moderate Mix 12.5 8.33 50
substrates, for each pot, additional irrigations with water were Moderate NaCl 25 0 50
provided to drain the excess salts, keeping the variation of EC High Mix 25 16.66 100
within a value never higher or lower than 5% of the initial value. High NaCl 50 0 100
Frontiers in Plant Science | www.frontiersin.org 3 March 2022 | Volume 13 | Article 799213Ciriello et al. Basil Response to NaCl Stress
Velate, MB, Italy) and subsequently titrated with H2 SO4 0.1 N UV-vis spectrophotometry (Hach DR 4000; Hach Co.,
with a methyl red and bromocresol green indicator (Carlo Erba Loveland, CO, United States) was used to read the absorbances
Reagents Srl., Milan, MI, Italy) until the solution reached reddish of antioxidant activities, total phenols, and AsA. Each treatment
color. The total nitrogen concentration values were expressed was analyzed in triplicate.
as g kg−1 of dry weight (DW). Each treatment was analyzed in
triplicate. The results obtained on the quantification of minerals, Volatile Compounds Determination
antioxidant activity, total phenols, and ascorbic acid (AsA) were In order to quantify volatile compounds (VOCs) via the solid-
expressed in terms of concentration according to the definition phase microextraction (SPME) method, 0.5 g of basil leaves
proposed by Bauer et al. (1997). stored at −80◦ C were manually crushed and placed in a 20 ml
For the determination of macronutrient and nitrate glass vial that was shaken and heated for 10 min to promote
concentrations, 0.25 g of sample was extracted in ultrapure the migration of VOCs into the headspace. The VOCs were
water (Arium Advance EDI pure water system, Sartorius,
R
absorbed by a divinylbenzene/carboxen/polydimethylsiloxane
Göttingen, NI, Germany) and analyzed using an ICS-3000 fiber (1 cm long, 50/30 µm thick; Supelco , Bellefonte, PA,
R
ion chromatographic system (Thermo ScientificTM DionexTM , United States). VOCs were determined by GC 6890N gas
Sunnyvale, CA, United States), coupled with an electrical chromatograph (Agilent, Santa Clara, CA, United States) coupled
conductivity detector. The determination of anions (nitrate, with MS 5973N mass spectrometer (Agilent, Santa Clara, CA,
sulfate, P, and Cl) and cations (K, calcium, Mg, and sodium) United States) equipped with a split-splitless injector and a
was performed by isocratic and gradient mode separation, capillary column (30 m × 0.250 mm) coated with a 5%
respectively. The concentration of anions and cations in leaves phenyl/95% dimethylpolysiloxane film (0.25 µm; Supelco , R
were expressed as g kg−1 of DW, except for nitrate expressed as Bellefonte, PA, United States).
µg g−1 of FW. Each treatment was analyzed in triplicate. Following a desorption phase of 10 min at 230◦ C, the oven
temperature was kept at 50◦ C for 2 min and then ramped to
150◦ C at 10◦ C/min and from 150 to 280 at 15◦ C/min. The
Antioxidant Activity Determination, Total ion and injection source temperatures were 230 and 250◦ C,
Phenols, and Total Ascorbic Acid respectively. Helium was used as the carrier gas at a flow rate
The determination of the antioxidant 2,20 -azino-bis(3- of 1 ml min−1 . The mass spectrometer was set at 70 eV.
ethylbenzothiazoline-6-sulfonic acid) (ABTS) fraction was The identification of VOCs was facilitated through the use
determined according to the method described by Pellegrini of the Atomic Spectra Database version 1.6 of the National
et al. (1998). This method is based on chromogen 2,20 -azino- Institute of Standards and Technology (NIST; U.S. Department
bis(3-ethylbenzothiazoline-6-sulfonic acid), which registers in of Commerce, Gaithersburg, MD, United States). Samples were
its radical form an absorption maximum at 734 nm. The ABTS analyzed in triplicates and the results were expressed as a
antioxidant activity was expressed as g Trolox eq kg−1 of DW. percentage relative abundance (%).
The quantification of the total phenolic compounds was
determined according to Folin-Ciocalteu’s method described Statistics
by Singleton et al. (1999). Briefly, 0.25 g of freeze-dried and The experiment was set up in a randomized design (Completely
ground leaves were added to 10 ml of 60% methanol, placed Randomized Design) with three replicate plots per treatment.
on a tilting plate for 15 min, and centrifuged. Subsequently, Thirty (2 cultivars × 5 salinity levels × 3 replications) fully
125 µl of the supernatant was taken, and 125 µl of a mixture of randomized experimental plots were used for each cut (Cut 1
phosphotungstic acid (H3 PW12 O40 ) and phosphomolybdic acid and Cut 2). Each experimental plot accommodated 15 plants.
(H3 Mo12 PO40 ) (Folin-Ciocalteu reagent) was added to 0.5 mL of During each cut, all the 15 plants of each experimental plot
distilled water. In the presence of phenolic compounds, the Folin- were harvested. Following sampling, aggregates of 15 plants
Ciocalteu reagent is reduced to a mixture of tungsten (W8 O23 ) were made for each treatment replication. Therefore 450 plants
and molybdenum (Mo8 O23 ) oxides that has an absorption peak (30 experimental plots × 15 plants) were used during each
at 760 nm. The total phenolic concentration was expressed as mg cut and 900 plants for the whole study (Cut1 and Cut2).
gallic acid equivalents 100 g−1 DW. ANOVA was performed to assess the significance of the main
The total AsA concentration was determined by an assay effects [Cultivar (V), Salinity (S), Cut (C)] and their pair-wise
based on the reduction of Fe3+ to Fe2+ by reduced AsA and interactions. During the statistical analysis, we ensured that all
the spectrophotometric detection of Fe2+ with 2,20 -dipyridyl the assumptions of ANOVA were met. That is, the treatment
(Kampfenkel et al., 1995). An aliquot of 0.4 g of frozen sample replications samples were independent of each other, sample
was weighed and then crushed in a mortar with 0.8 mL of 6% populations were normally distributed (normality), and the
trichloroacetic acid (TCA). After incubation for 15 min at −20◦ C, sample populations had the same variance (homoscedasticity).
1.2 mL of 6% TCA was added to the extract, after which it was Three-way interactions were either non-significant or had a
centrifuged at 4,000 rpm for 10 min. The obtained supernatant very low contribution to the total variance of the examined
was taken to determine total AsA (AsA + dehydroascorbate). variables. Means for V and C were compared by the Student’s
The absorbance was then read at a wavelength of 525 nm, t-test, whereas the means for S and all two-way interactions were
which corresponds to the maximum absorption peak of the compared using the Tukey–Kramer HSD test at the p < 0.05
Fe/2,2-dipyridyl. level. Data represent mean ± SE of three replicates (n = 3). All
Frontiers in Plant Science | www.frontiersin.org 4 March 2022 | Volume 13 | Article 799213Ciriello et al. Basil Response to NaCl Stress
statistical analyses were performed using IBM SPSS 20 (Armonk, Leaf Mineral Concentration
NY, United States) package for Microsoft Windows 10. The choice of cultivar had a significant effect on the leaf
concentration for all minerals analyzed. The cultivar was the
only factor with a significant effect on leaf N concentration,
which was found higher in Green than in Red (Table 4). P
RESULTS
concentration was also higher in Green than Red, however, in
the former cultivar, it decreased at Cut2 whereas in the latter it
Morphometric and Yield Parameters did not, as manifested in significant cultivar × cut interaction.
With respect to the main experimental factors, significant
Salinity also had a significant effect on P concentration, which
differences were observed between cultivars for leaf number,
decreased in response to the High Mix and High NaCl treatments.
leaf area, and leaf FW (Table 2). Superior leaf number but
For P, the interaction between the factors under consideration
smaller leaf area and leaf FW were observed in Red, reflecting
(salinity × cultivar × cut) was significant (p ≤ 0.01). In general,
the smaller leaves of this cultivar compared to Green, whereas
the lowest phosphorus concentration was obtained from the
leaf DM percentage and DW were not influenced by cultivar
High NaCl × Green × Cut2 interaction (data not shown). For
type. Salinity treatments had no effect on the leaf number and
the same cultivar in the High Mix and Low Mix treatments,
leaf DM percentage; however, the High Mix treatment and the
from the first to the second cut, phosphorus decreased by
High NaCl treatment suppressed the leaf area, leaf FW, and
40.7 and 37.1%, respectively (data not shown). S concentration
DW, which signals a deleterious effect on plant growth under
incurred a significant effect with respect to the cultivar, as it
both high-salt treatments. Cut order affected significantly all the
was higher in Red than Green, however, it was not significantly
morphometric variables examined, with leaf number, area and
affected by salinity or cut. K concentration was affected by
FW, and DW being higher at Cut2, at the expense, however, of
cultivar and cut but not by salinity; it was found higher in
leaf DM percentage. Significant salinity × cultivar interaction was
Green and increased at Cut2. Calcium, Mg, sodium, and chlorine
observed for leaf area, leaf FW, and DW as the mean values of Red
concentrations were the ones most affected by salinity treatments.
for these variables under the High Mix and High NaCl treatments
Calcium concentration was lowest in the Control and highest in
did not differ significantly to the Control (non-salt) treatment.
the High-Mix treatment, with the mix treatments resulting in
The rest of the interactions observed derived from changes in the
higher Ca concentration than the corresponding isomolar NaCl
scale of the observed effects but not in the ranking of treatments.
treatments. The Ca concentration was higher in Red while in both
cultivars it increased at Cut2. A salinity × cultivar interaction
Leaf Colorimetric Components was observed mainly due to a change in scale between the two
Significant differences were observed between cultivars for the cultivars. Mg concentration was mostly affected by salinity and
leaf colorimetric attributes examined, which largely reflects their to a lesser extent by cultivar. The salinity effect was reflected
apparent genotypic differences in color (Table 3). Lightness (L∗ ) solely on the High NaCl treatment which resulted in the highest
was overall higher in Green than Red and in Cut2 than Cut1, Mg concentration, whereas no other salinity treatment differed
while slightly higher L∗ was also observed with salinity treatments from the Control. The effect of cut on Mg concentration was
compared to Control. Cultivar ranking did not change for L∗ non-significant although it was implicated in a cultivar × cut
across salinity treatments as the salinity × cultivar interaction interaction since Mg concentration in Green increased at Cut2
observed was due to change in scale rather than treatment rank. whereas in Red it was unaltered. Leaf sodium concentration was
Similarly, cut ranking was invariable across salinity treatments significantly affected by all the experimental factors examined.
despite salinity × cut interaction. However, the significant It was higher in Green and increased in response to all salinity
cultivar × cut interaction observed highlighted that leaf L∗ of treatments, except for the Moderate Mix treatment, which did
Green remained unaltered between Cut1 and Cut2, as opposed not differ significantly from the non-salt Control treatment. The
to the sharp increase observed in Red. Significant variation in highest Na concentration was attained in response to the High
response to salinity treatments was only observed for Red as NaCl treatment. The mean cultivar Na concentration doubled
the red color intensity (+a∗ ) decreased significantly with all at Cut2 relative to Cut1, however, a cultivar × cut interaction
salinity treatments, except for Moderate Mix when compared to revealed that the Na increase in Red was non-significant,
the Control. Moreover, under both moderate and high salinity whereas in Green a significant increase by 152.6% was noted.
conditions, the NaCl treatment tended to suppress red color Chlorine concentration was significantly affected by salinity and
intensity more than the combined NaCl + CaCl2 treatment. cultivar but unlike sodium concentration, it demonstrated no
Significant cultivar × cut interaction was also observed as the significant change in response to the order of cuts. Chlorine
green color intensity (−a∗ ) of green basil was not dependent on concentration was higher in Red rather than Green and also
the cut, whereas the red color intensity (+a∗ ) of Red decreased at incurred a significant increase with salinity treatments relative
Cut2. With respect to the overall leaf color saturation or chroma to the Control. The high salinity treatments induced higher Cl
(C∗ ), Green demonstrated higher C∗ than Red irrespective of concentration than the moderate treatments while no significant
salinity and cut. The cut order was not significant for leaf differences were observed between the isomolar mix and plain
chroma in Green; however, Red demonstrated an increase in NaCl treatments. None of the factors examined except salinity
leaf chroma at Cut2. had a significant effect on the basil leaf nitrate concentration,
Frontiers in Plant Science | www.frontiersin.org 5 March 2022 | Volume 13 | Article 799213Ciriello et al. Basil Response to NaCl Stress
TABLE 2 | Analysis of variance (ANOVA) and mean comparisons for leaf number, leaf area, leaf fresh weight, leaf dry matter percentage, and dry weight of the Green and
Red cultivars grown hydroponically under iso-osmotic salinity treatments and harvested in two sequential cuts.
Source of variance Leaf number Leaf area Leaf FW Leaf DM Dry weight
n◦ plant−1 (cm2 plant−1 ) (g plant−1 ) (%) (g plant−1 )
Cultivar (V) *** * *** ns ns
Salinity (S) ns *** *** ns ***
Cut (C) *** *** *** * ***
S×V ns *** *** ns *
S×C ns ns ns ns *
V×C *** ** * * **
Means ± standard error
Cultivar
Green 122 ± 8b 1639 ± 89a 60.72 ± 3.39a 9.00 ± 0.20 7.96 ± 0.42
Red 197 ± 14a 1482 ± 79b 43.40 ± 2.48b 9.18 ± 0.14 7.27 ± 0.48
Salinity
Control 159 ± 17 1862 ± 127a 64.05 ± 6.56a 8.58 ± 0.16 8.73 ± 0.83a
Moderate Mix 185 ± 22 1893 ± 73a 63.44 ± 3.72a 8.88 ± 0.21 9.15 ± 0.54a
Moderate NaCl 159 ± 23 1657 ± 130a 54.16 ± 4.08ab 9.22 ± 0.28 8.07 ± 0.75ab
High Mix 148 ± 21 1291 ± 97b 43.38 ± 3.64bc 8.94 ± 0.29 6.36 ± 0.47bc
High NaCl 138 ± 18 1042 ± 109b 34.15 ± 2.96c 9.88 ± 0.32 5.51 ± 0.47c
Cut
Cut1 101 ± 5b 1287 ± 69b 42.96 ± 2.69b 9.21 ± 0.14a 5.89 ± 0.29b
Cut2 219 ± 11a 1853 ± 76a 62.09 ± 3.16a 8.96 ± 0.20b 9.44 ± 0.41a
S×V
Control × Green 136 ± 20 2229 ± 126a 85.90 ± 5.70a 8.25 ± 0.18 10.66 ± 1.12a
Moderate Mix × Green 130 ± 19 1951 ± 93ab 73.02 ± 3.98ab 8.38 ± 0.20 9.09 ± 0.69abc
Moderate NaCl × Green 118 ± 18 1783 ± 142abcd 60.38 ± 3.63bc 8.90 ± 0.38 7.83 ± 0.69abc
High Mix × Green 113 ± 15 1286 ± 91def 48.40 ± 4.53cde 9.01 ± 0.47 6.57 ± 0.42bc
High NaCl × Green 111 ± 16 947 ± 130f 35.89 ± 3.93e 10.45 ± 0.48 5.64 ± 0.49c
Control × Red 182 ± 27 1494 ± 119bcde 42.20 ± 3.97de 8.91 ± 0.22 6.81 ± 0.78bc
Moderate Mix × Red 239 ± 29 1835 ± 115abc 53.86 ± 4.14cd 9.38 ± 0.28 9.21 ± 0.87ab
Moderate NaCl × Red 200 ± 38 1532 ± 219bcde 47.94 ± 6.87cde 9.54 ± 0.41 8.31 ± 1.39abc
High Mix × Red 191 ± 35 1336 ± 176cdef 38.90 ± 5.29de 8.81 ± 0.30 6.29 ± 0.91bc
High NaCl × Red 170 ± 31 1151 ± 181ef 32.15 ± 4.70e 9.23 ± 0.25 5.37 ± 0.88c
S×C
Control × Cut1 101 ± 9 1616 ± 174 54.12 ± 8.50 8.62 ± 0.20 6.81 ± 0.79bc
Moderate Mix × Cut1 126 ± 18 1683 ± 82 54.88 ± 4.35 9.14 ± 0.26 7.65 ± 0.53b
Moderate NaCl × Cut1 91 ± 11 1251 ± 122 41.75 ± 4.59 9.36 ± 0.33 5.77 ± 0.54bcd
High Mix × Cut1 98 ± 9 1056 ± 57 35.44 ± 3.08 9.15 ± 0.35 5.05 ± 0.23cd
High NaCl × Cut1 91 ± 8 828 ± 34 28.62 ± 1.84 9.76 ± 0.28 4.20 ± 0.19d
Control × Cut2 218 ± 15 2107 ± 145 73.98 ± 9.18 8.53 ± 0.27 10.66 ± 1.11a
Moderate Mix × Cut2 244 ± 27 2103 ± 58 72.00 ± 4.40 8.61 ± 0.32 10.64 ± 0.56a
Moderate NaCl × Cut2 227 ± 28 2064 ± 102 66.57 ± 2.51 9.09 ± 0.48 10.38 ± 0.79a
High Mix × Cut2 208 ± 30 1599 ± 107 53.70 ± 4.58 8.64 ± 0.45 8.03 ± 0.45ab
High NaCl × Cut2 192 ± 25 1288 ± 197 40.45 ± 5.19 10.02 ± 0.62 7.01 ± 0.59bc
V×C
Green × Cut1 77 ± 3d 1442 ± 110b 53.28 ± 3.80b 8.97 ± 0.20ab 6.49 ± 0.42b
Green × Cut2 166 ± 5b 1837 ± 129a 68.15 ± 5.18a 9.03 ± 0.35ab 9.42 ± 0.57a
Red × Cut1 126 ± 7c 1132 ± 70c 32.64 ± 1.98c 9.45 ± 0.17a 5.30 ± 0.37b
Red × Cut2 277 ± 13a 1870 ± 76a 55.36 ± 2.73b 8.89 ± 0.20b 9.47 ± 0.59a
Salinity treatments: Control = non-salt; Moderate Mix = (12.5 mM NaCl + 8.3 mM CaCl2 ); Moderate NaCl = 25 mM NaCl; High Mix = (25 mM NaCl + 16.6 mM CaCl2 );
High NaCl = 50 mM NaCl. * Significant effect at the 0.05 level, **0.01 level, *** 0.001 level, ns = non-significant effect. Data represent means ± standard error of 3
replicates (n = 3) consisting of 10 plants each. Treatment means within each column followed by different letters denote significant differences (p < 0.05) according to
Tukey–Kramer HSD test. Three-way interactions were either non-significant or had a very low contribution to the total variance of the examined variables.
Frontiers in Plant Science | www.frontiersin.org 6 March 2022 | Volume 13 | Article 799213Ciriello et al. Basil Response to NaCl Stress
TABLE 3 | Analysis of variance (ANOVA) and mean comparisons for leaf colorimetric components L*, a*, b*, Chroma (C*), and hue Angle (h◦ ) of the Green and Red
cultivars grown hydroponically under iso-osmotic salinity treatments and harvested in two sequential cuts.
Source of variance L* a* b* C* h◦
√
(0–100) (−60/+60) (−60/+60) (a2 + b2 ) (0–360◦ )
Cultivar (V) *** *** *** *** ***
Salinity (S) *** * ns ns *
Cut (C) *** *** * ns ***
S×V *** *** *** * *
S×C *** ns ns ns *
V×C *** *** *** *** ***
Means ± standard error
Cultivar
Green 46.37 ± 0.19a −6.17 ± 0.11b 13.28 ± 0.36a 14.67 ± 0.37a 115.43 ± 0.28b
Red 40.68 ± 0.58b 2.12 ± 0.33a 3.64 ± 0.48b 5.71 ± 0.35b 186.54 ± 5.70a
Salinity
Control 42.38 ± 1.25b −1.26 ± 1.40a 7.35 ± 1.91 10.60 ± 1.47 148.75 ± 9.29a
Moderate Mix 43.43 ± 1.11ab −1.75 ± 1.18ab 8.20 ± 1.45 9.90 ± 1.38 159.87 ± 12.34a
Moderate NaCl 44.18 ± 0.90a −2.34 ± 1.10ab 9.03 ± 1.29 10.23 ± 1.35 156.41 ± 12.77a
High Nix 43.95 ± 0.96a −2.27 ± 1.09ab 9.03 ± 1.20 10.59 ± 1.10 143.11 ± 10.28a
High NaCl 43.68 ± 0.68a −2.47 ± 0.83b 8.52 ± 1.00 9.45 ± 1.07 146.91 ± 10.59a
Cut
Cut1 41.84 ± 0.71b −1.59 ± 0.78a 7.97 ± 0.95b 9.77 ± 0.88a 159.47 ± 7.86a
Cut2 45.21 ± 0.37a −2.46 ± 0.63b 8.94 ± 0.80a 10.61 ± 0.71a 142.49 ± 5.65b
S×V
Control × Green 46.84 ± 0.49a −6.61 ± 0.30d 14.48 ± 1.02a 15.93 ± 1.05a 114.95 ± 0.72c
Moderate Mix × Green 47.17 ± 0.25a −6.23 ± 0.29d 13.48 ± 0.96a 14.87 ± 0.98a 115.20 ± 0.70c
Moderate NaCl × Green 46.11 ± 0.25a −6.45 ± 0.17d 13.72 ± 0.63a 15.18 ± 0.64a 115.41 ± 0.55c
High Mix × Green 46.30 ± 0.35a −6.01 ± 0.17d 12.82 ± 0.54a 14.18 ± 0.55a 115.38 ± 0.45c
High NaCl × Green 45.42 ± 0.49a −5.54 ± 0.12d 11.89 ± 0.67a 13.18 ± 0.64a 116.19 ± 0.73c
Control × Red 37.92 ± 0.86c 4.09 ± 0.34a 0.23 ± 0.22c 5.27 ± 0.31b 182.56 ± 6.52ab
Moderate Mix × Red 39.70 ± 1.12c 2.74 ± 0.42ab 2.91 ± 0.33bc 4.93 ± 0.30b 204.54 ± 9.08ab
Moderate NaCl × Red 42.26 ± 1.52b 1.77 ± 0.57bc 4.34 ± 0.71b 5.29 ± 0.64b 197.41 ± 14.79a
High Mix × Red 41.58 ± 1.50b 1.40 ± 1.11bc 5.55 ± 1.57b 7.32 ± 1.38b 170.58 ± 15.40b
High NaCl × Red 41.94 ± 0.94b 0.60 ± 0.46c 5.14 ± 0.74b 5.72 ± 0.69b 177.62 ± 14.50ab
S×C
Control × Cut1 41.33 ± 2.13e −1.09 ± 2.11 7.50 ± 2.80 10.57 ± 2.19a 152.31 ± 14.71abc
Moderate Mix × Cut1 42.15 ± 2.04de −1.38 ± 1.85 8.03 ± 2.07 9.77 ± 1.94a 166.97 ± 19.83a
Moderate NaCl × Cut1 42.04 ± 1.42de −1.79 ± 1.85 8.71 ± 2.27 10.08 ± 2.32a 157.18 ± 20.44a
High Mix × Cut1 41.69 ± 1.50e −1.51 ± 1.85 7.92 ± 2.26 9.67 ± 2.12a 161.57 ± 17.94ab
High NaCl-Cut1 41.97 ± 0.97de −2.19 ± 1.39 7.69 ± 1.61 8.75 ± 1.72a 159.35 ± 18.87a
Control × Cut2 43.42 ± 1.34cd −1.43 ± 1.98 7.21 ± 2.78 10.63 ± 2.13a 145.2 ± 12.23abc
Moderate Mix × Cut2 44.71 ± 0.82bc −2.12 ± 1.60 8.37 ± 2.17 10.04 ± 2.09a 152.77 ± 15.66abc
Moderate NaCl × Cut2 46.33 ± 0.37a −2.89 ± 1.29 9.35 ± 1.41 10.39 ± 1.56a 155.64 ± 16.78ab
High Mix × Cut2 46.19 ± 0.51ab −3.11 ± 1.26 10.45 ± 0.98 11.83 ± 0.86a 124.39 ± 5.88c
High NaCl-Cut2 45.40 ± 0.45ab −2.74 ± 0.99 9.34 ± 1.21 10.15 ± 1.34a 134.47 ± 8.95bc
V×C
Green × Cut1 46.03 ± 0.30a −6.35 ± 0.09c 13.73 ± 0.31a 15.14 ± 0.32a 114.90 ± 0.22c
Green × Cut2 46.70 ± 0.21a −5.99 ± 0.20c 12.82 ± 0.64a 14.02 ± 0.66a 115.95 ± 0.49c
Red × Cut1 37.64 ± 0.34c 3.17 ± 0.27a 2.20 ± 0.33c 4.39 ± 0.20c 204.05 ± 6.68a
Red × Cut2 43.72 ± 0.54b 1.07 ± 0.51b 5.07 ± 0.78b 7.02 ± 0.54b 169.03 ± 7.51b
Salinity treatments: Control = non-salt; Moderate Mix = (12.5 mM NaCl + 8.3 mM CaCl2 ); Moderate NaCl = 25 mM NaCl; High Mix = (25 mM NaCl + 16.6 mM CaCl2 );
High NaCl = 50 mM NaCl. * Significant effect at the 0.05 level, *** 0.001 level, ns = non-significant effect. Data represent means ± standard error of 3 replicates (n = 3)
consisting of 10 plants each. Treatment means within each column followed by different letters denote significant differences (p < 0.05) according to the Tukey–Kramer
HSD test. Three-way interactions were either non-significant or had a very low contribution to the total variance of the examined variables.
Frontiers in Plant Science | www.frontiersin.org 7 March 2022 | Volume 13 | Article 799213Ciriello et al. Basil Response to NaCl Stress
TABLE 4 | Analysis of variance (ANOVA) and mean comparisons for mineral [nitrogen (N), phosphorus (P), sulfur (S), potassium (K), calcium (Ca), magnesium (Mg),
sodium (Na), and chlorine (Cl)] concentration of Green and Red cultivars cultivated under iso-osmotic salinity treatments and harvested in two sequential cuts.
Source of variance N P S K Ca Mg Na Cl
(g kg−1 DW) (g kg−1 DW) (g kg−1 DW) (g kg−1 DW) (g kg−1 DW) (g kg−1 DW) (g kg−1 DW) (g kg−1 DW)
Cultivar (V) *** * *** *** *** * *** **
Salinity (S) ns ** ns ns *** *** *** ***
Cut (C) ns *** ns ** *** ns *** ns
S×V ns ns ns ns ** ns ns ns
S×C ns ns ns ns ns ns *** ns
V×C ns *** ns ns ns ** ** ns
S×V×C ns ** ns ns ns ns ns ns
Means ± standard error
Cultivar
Green 45.99 ± 0.34a 10.45 ± 0.65a 1.06 ± 0.04b 53.84 ± 1.13a 7.61 ± 0.50b 2.77 ± 0.15b 3.46 ± 0.64a 20.24 ± 2.19b
Red 43.00 ± 0.43b 8.58 ± 0.44b 1.61 ± 0.07a 45.48 ± 1.65b 10.66 ± 0.77a 3.17 ± 0.18a 2.17 ± 0.47b 24.22 ± 2.81a
Salinity
Control 45.09 ± 0.33 11.49 ± 0.39a 1.49 ± 0.12 48.73 ± 2.17 6.82 ± 0.39c 2.41 ± 0.14b 0.86 ± 0.13d 1.15 ± 0.10c
Moderate Mix 44.89 ± 0.75 11.19 ± 1.04a 1.41 ± 0.11 47.79 ± 2.96 10.03 ± 0.76b 2.42 ± 0.15b 1.15 ± 0.18cd 21.06 ± 1.10b
Moderate NaCl 44.66 ± 0.80 10.05 ± 0.71ab 1.38 ± 0.12 50.07 ± 2.25 7.18 ± 0.55c 3.06 ± 0.21b 2.77 ± 0.50b 19.29 ± 1.20b
High Mix 42.55 ± 0.88 7.24 ± 0.91b 1.20 ± 0.12 48.15 ± 2.81 14.16 ± 1.44a 2.86 ± 0.17b 2.23 ± 0.61bc 36.09 ± 2.29a
High NaCl 45.38 ± 0.80 7.44 ± 0.75b 1.15 ± 0.11 54.02 ± 2.36 8.09 ± 0.80bc 4.03 ± 0.27a 7.05 ± 1.17a 33.60 ± 2.25a
Cut
Cut1 44.17 ± 0.47 10.20 ± 0.58a 1.40 ± 0.08 46.52 ± 1.56b 8.24 ± 0.61b 2.86 ± 0.17 1.93 ± 0.26b 22.44 ± 2.64
Cut2 45.10 ± 0.47 8.79 ± 0.56b 1.25 ± 0.07 53.33 ± 1.36a 9.99 ± 0.75a 3.06 ± 0.16 3.80 ± 0.76a 21.80 ± 2.39
S×V
Control × Green 45.87 ± 0.40 11.66 ± 0.63 1.24 ± 0.08 52.58 ± 2.11 6.21 ± 0.46c 2.14 ± 0.17 0.98 ± 0.18 0.98 ± 0.10
Moderate Mix × Green 46.69 ± 0.72 13.67 ± 1.52 1.22 ± 0.09 51.21 ± 3.14 9.07 ± 0.97bc 2.38 ± 0.22 1.30 ± 0.29 19.43 ± 0.70
Moderate NaCl × Green 46.64 ± 0.65 11.66 ± 0.80 1.03 ± 0.06 54.44 ± 2.56 6.42 ± 0.84c 2.77 ± 0.15 3.72 ± 0.85 17.74 ± 1.22
High Mix × Green 44.26 ± 0.68 8.13 ± 1.64 0.94 ± 0.09 53.65 ± 2.30 10.65 ± 1.53b 2.77 ± 0.33 2.70 ± 1.06 33.39 ± 2.66
High NaCl × Green 46.17 ± 0.94 7.73 ± 1.20 0.89 ± 0.08 56.80 ± 2.51 6.43 ± 0.77c 3.63 ± 0.34 7.74 ± 1.67 30.19 ± 1.98
Control × Red 44.30 ± 0.28 11.31 ± 0.50 1.74 ± 0.18 44.87 ± 3.20 7.42 ± 0.57bc 2.67 ± 0.18 0.75 ± 0.20 1.36 ± 0.13
Moderate Mix × Red 43.08 ± 0.79 9.12 ± 0.75 1.60 ± 0.19 44.38 ± 4.90 10.99 ± 1.11b 2.46 ± 0.21 1.00 ± 0.22 22.69 ± 1.95
Moderate NaCl × Red 42.69 ± 0.92 8.45 ± 0.74 1.72 ± 0.11 45.70 ± 2.84 7.93 ± 0.64bc 3.35 ± 0.37 1.83 ± 0.10 20.84 ± 1.96
High Mix × Red 40.42 ± 1.04 6.35 ± 0.78 1.46 ± 0.14 42.64 ± 3.88 17.67 ± 0.90a 2.95 ± 0.14 1.76 ± 0.65 38.79 ± 3.58
High NaCl × Red 44.00 ± 1.35 7.03 ± 0.77 1.51 ± 0.12 50.13 ± 4.13 10.4 ± 0.84b 4.60 ± 0.31 6.08 ± 1.66 38.38 ± 3.93
S×C
Control × Cut1 44.76 ± 0.41 11.29 ± 0.54 1.68 ± 0.21 45.94 ± 3.23 6.46 ± 0.57 2.26 ± 0.23 0.98 ± 0.21d 1.08 ± 0.17
Moderate Mix × Cut1 44.04 ± 0.97 12.41 ± 1.71 1.50 ± 0.13 43.66 ± 4.38 8.14 ± 0.56 2.37 ± 0.24 0.87 ± 0.15d 18.92 ± 0.50
Moderate NaCl × Cut1 44.75 ± 0.98 10.71 ± 1.00 1.33 ± 0.17 47.03 ± 2.65 6.65 ± 0.51 2.84 ± 0.16 2.20 ± 0.16bcd 16.67 ± 1.24
High Mix × Cut1 42.21 ± 1.24 8.23 ± 1.34 1.21 ± 0.15 45.38 ± 4.04 12.56 ± 1.97 2.64 ± 0.21 1.48 ± 0.57cd 35.67 ± 3.56
High NaCl × Cut1 45.10 ± 1.33 8.34 ± 1.02 1.29 ± 0.17 50.59 ± 3.51 7.38 ± 1.01 4.21 ± 0.37 4.09 ± 0.43b 36.29 ± 3.91
Control × Cut2 45.41 ± 0.52 11.69 ± 0.60 1.30 ± 0.07 51.51 ± 2.67 7.17 ± 0.56 2.55 ± 0.17 0.74 ± 0.17d 1.21 ± 0.12
Moderate Mix × Cut2 45.73 ± 1.11 9.72 ± 0.77 1.32 ± 0.19 51.93 ± 3.54 11.92 ± 0.90 2.47 ± 0.19 1.43 ± 0.29cd 23.21 ± 1.81
Moderate NaCl × Cut2 44.58 ± 1.36 9.40 ± 1.03 1.42 ± 0.19 53.11 ± 3.40 7.70 ± 0.99 3.29 ± 0.38 3.34 ± 0.96bc 21.91 ± 1.42
High Mix × Cut2 43.23 ± 1.09 5.76 ± 0.67 1.19 ± 0.22 52.31 ± 2.95 16.56 ± 1.63 3.19 ± 0.21 3.35 ± 1.11bcd 36.71 ± 2.70
High NaCl × Cut2 45.73 ± 0.91 6.53 ± 1.05 1.01 ± 0.15 57.45 ± 2.73 8.79 ± 1.27 3.86 ± 0.40 10.01 ± 1.53a 30.90 ± 2.04
V×C
Green × Cut1 45.61 ± 0.47 11.90 ± 0.80a 1.12 ± 0.07 50.38 ± 1.23 6.41 ± 0.34 2.42 ± 0.18b 1.96 ± 0.40b 19.45 ± 3.15
Green × Cut2 46.37 ± 0.49 8.90 ± 0.88b 1.00 ± 0.06 57.30 ± 1.44 8.82 ± 0.84 3.11 ± 0.20a 4.95 ± 1.11a 21.03 ± 3.16
Red × Cut1 42.73 ± 0.64 8.49 ± 0.58b 1.68 ± 0.09 42.66 ± 2.54 10.07 ± 0.98 3.30 ± 0.24a 1.89 ± 0.36b 25.65 ± 4.26
Red × Cut2 43.38 ± 0.56 8.67 ± 0.70b 1.54 ± 0.09 48.75 ± 1.71 11.34 ± 1.22 3.01 ± 0.27a 2.48 ± 0.93b 22.68 ± 3.76
Salinity treatments: Control = non-salt; Moderate Mix = (12.5 mM NaCl + 8.3 mM CaCl2 ); Moderate NaCl = 25 mM NaCl; High Mix = (25 mM NaCl + 16.6 mM CaCl2 );
High NaCl = 50 mM NaCl. * Significant effect at the 0.05 level, ** 0.01 level, *** 0.001 level, ns = non-significant effect. Data represent means ± SE of 3 replicates (n = 3)
consisting of 10 plants each. Treatment means within each column followed by different letters denote significant differences (P < 0.05) according to the Tukey–Kramer
HSD test.
Frontiers in Plant Science | www.frontiersin.org 8 March 2022 | Volume 13 | Article 799213Ciriello et al. Basil Response to NaCl Stress
TABLE 5 | Analysis of variance (ANOVA) and mean comparisons for nitrate concentration, ABTS antioxidant activity, total concentration of phenolic compounds, and
ascorbic acid concentration of Green and Red cultivars grown hydroponically under iso-osmotic salinity treatments and harvested in two sequential cuts.
Source of variance Nitrate (µg g−1 FW) ABTS (g Trolox eq kg−1 DM) Phenolics (mg gallic acid 100 g−1 DW) Ascorbic acid (mg 100 g−1 FW)
Cultivar (V) ns ns *** ***
Salinity (S) * *** *** *
Cut (C) ns *** *** ***
S×V ns ns ns ns
S×C ns ns ns ns
V×C ns ns ns ***
Means ± standard error
Cultivar
Green 2669 ± 136 9.03 ± 0.39 52.60 ± 3.30b 25.70 ± 1.70b
Red 2599 ± 147 12.81 ± 0.51 97.50 ± 2.90a 52.60 ± 4.60a
Salinity
Control 3311 ± 150a 9.18 ± 1.02b 61.40 ± 7.20c 31.30 ± 5.10b
Moderate Mix 2891 ± 164b 11.51 ± 0.61a 75.80 ± 8.30ab 44.60 ± 9.00a
Moderate NaCl 2803 ± 174b 11.63 ± 1.05a 78.70 ± 8.90ab 41.70 ± 8.50a
High Mix 2093 ± 133c 11.99 ± 0.91a 87.50 ± 8.60a 44.80 ± 4.20a
High NaCl 1978 ± 220c 10.23 ± 0.71ab 72.00 ± 7.00bc 31.70 ± 4.50b
Cut
Cut1 2753 ± 126 9.72 ± 0.47b 65.30 ± 4.80b 30.00 ± 2.30b
Cut2 2509 ± 153 12.03 ± 0.59a 84.80 ± 4.90a 48.20 ± 5.10a
S×V
Control × Green 3133 ± 182 6.28 ± 0.26 39.40 ± 2.60 16.90 ± 1.80
Moderate Mix × Green 2841 ± 295 10.03 ± 0.70 50.40 ± 3.00 22.20 ± 2.80
Moderate NaCl × Green 3052 ± 246 9.65 ± 0.90 52.90 ± 7.60 32.90 ± 2.70
High Mix × Green 2170 ± 195 10.76 ± 0.63 65.00 ± 10.90 34.70 ± 3.90
High NaCl × Green 2150 ± 368 8.46 ± 0.42 55.20 ± 7.10 21.80 ± 1.70
Control × Red 3489 ± 231 12.09 ± 1.06 83.40 ± 5.30 45.70 ± 5.30
Moderate Mix × Red 2941 ± 174 12.99 ± 0.50 101.10 ± 6.20 67.10 ± 12.10
Moderate NaCl × Red 2553 ± 218 13.61 ± 1.58 104.40 ± 5.30 50.40 ± 16.70
High Mix × Red 2002 ± 190 13.48 ± 1.72 110.00 ± 2.00 54.90 ± 4.70
High NaCl × Red 1772 ± 212 12.00 ± 0.88 88.80 ± 7.20 43.50 ± 6.60
S×C
Control × Cut1 3347 ± 213 8.66 ± 1.44 53.90 ± 9.00 25.30 ± 5.10
Moderate Mix × Cut1 3105 ± 185 11.37 ± 1.19 69.80 ± 11.10 29.10 ± 6.30
Moderate NaCl × Cut1 2850 ± 179 9.43 ± 0.70 66.00 ± 12.60 27.90 ± 3.40
High Mix × Cut1 2169 ± 206 10.04 ± 1.05 77.50 ± 13.30 39.90 ± 5.10
High NaCl × Cut1 2295 ± 319 9.14 ± 0.55 59.50 ± 8.50 27.70 ± 4.60
Control × Cut2 3276 ± 231 9.71 ± 1.55 68.90 ± 11.10 37.30 ± 8.60
Moderate Mix × Cut2 2677 ± 256 11.64 ± 0.43 81.70 ± 12.90 60.20 ± 14.80
Moderate NaCl × Cut2 2755 ± 316 13.84 ± 1.56 91.30 ± 11.30 55.50 ± 15.10
High Mix × Cut2 2003 ± 172 13.62 ± 1.07 97.50 ± 10.40 49.60 ± 6.60
High NaCl × Cut2 1597 ± 220 11.32 ± 1.19 84.40 ± 9.00 36.50 ± 8.40
V×C
Green × Cut1 2894 ± 158 8.29 ± 0.47 41.90 ± 1.90 23.60 ± 2.90c
Green × Cut2 2445 ± 211 9.78 ± 0.58 63.20 ± 5.00 27.80 ± 1.80bc
Red × Cut1 2613 ± 196 11.24 ± 0.61 88.80 ± 3.90 36.40 ± 2.70bc
Red × Cut2 2583 ± 228 14.28 ± 0.61 106.30 ± 3.10 70.00 ± 6.40a
Salinity treatments: Control = non-salt; Moderate Mix = (12.5 mM NaCl + 8.3 mM CaCl2 ); Moderate NaCl = 25 mM NaCl; High Mix = (25 mM NaCl + 16.6 mM CaCl2 );
High NaCl = 50 mM NaCl. * Significant effect at the 0.05 level, *** 0.001 level, ns = non-significant effect. Data represent means ± standard error of 3 replicates (n = 3)
consisting of 10 plants each. Treatment means within each column followed by different letters denote significant differences (p < 0.05) according to the Tukey–Kramer
HSD test. Three-way interactions were either non-significant or had a very low contribution to the total variance of the examined variables.
Frontiers in Plant Science | www.frontiersin.org 9 March 2022 | Volume 13 | Article 799213Ciriello et al. Basil Response to NaCl Stress
where a tendency for reduced NO3 concentration was apparent High Mix and High NaCl treatments. β-linalool was relatively
with increasing salinity treatments (Table 5). more abundant in Red in which also increased at Cut2, whereas
in Green it did not change in response to cut order. In both
Quality and Functional Attributes cultivars, the presence of β-linalool decreased in the High Mix
The ABTS antioxidant activity (ABTS) was significantly affected and High NaCl treatments. Trans-α-bergamotene incurred a
by salinity and cut. The ABTS was invariably increased by all significant effect from the cultivar as it was overall more abundant
salinity treatments compared to the control, except for the High in Green than Red; however, its relative abundance in Green
NaCl treatment which was not significantly different from the increased significantly from Cut1 to Cut2, whereas in Red, no
Control. The ABTS was also significantly higher at Cut2 than change was observed.
Cut1. The total phenolic concentration was significantly affected
by salinity, cultivar, and cut. Phenolics were higher in Red by Principal Component Analysis
85.3% relative to Green and in both cultivars, the phenolic A PCA was performed on all basil-analyzed data in relation
concentration increased at Cut2 by 29.9%. Moreover, all salinity to the three experimental factors: cultivars, iso-osmotic salinity
treatments increased the leaf phenolic concentration except for concentrations, and sequential harvests. The loading plot and
the High NaCl treatment which did not differ significantly from scores are reported in Figures 1, 2. PC1 was positively
the Control. The total AsA concentration was marginally affected correlated with leaf FW, color components L∗ and C∗ , N, P,
by salinity (p ≤ 0.05) and more affected by cultivar and cut K, and beta-Linalool while it was negatively correlated with
(p ≤ 0.05). Higher ascorbate concentration was found in Red, S, Ca, ABTS, phenolics, AsA concentrations but also with
and though it increased at Cut2 in both cultivars, this increase the relative percentage of beta-Ocimene, (Z)-, 2-Hexenal, (E)-,
was also more pronounced in Red. and trans-alfa-Bergamotene (Figure 1). Moreover, PC2 was
positively correlated with leaf dry matter, K, Mg, Na, and
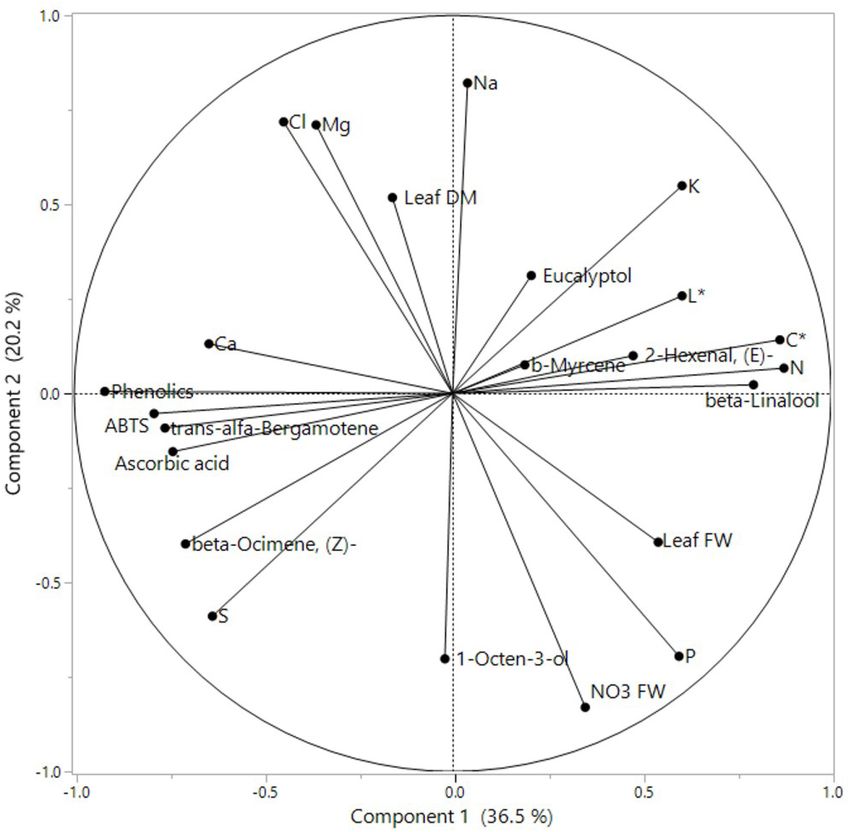
Volatile Aromatic Compounds Profile Cl concentration while it was negatively correlated with P, S,
A total of 84 VOCs were identified in the basil aromatic profile, and NO3 FW. The two basil cultivars were well separated
accounting for 16 monoterpene hydrocarbons, 10 oxygenated but not uniformly clustered with respect to PC1 and PC2
monoterpenes, 18 sesquiterpene hydrocarbons, 11 aliphatic (Figure 2). The green basil treatments from cuts 1 and 2
alcohols, 8 aliphatic aldehydes, 11 aliphatic esters, 2 aliphatic were distributed on the positive side of PC1 between upper
ketones, and 8 aromatic compounds (Supplementary Table 1). and lower right quadrants, while the red basil cuts 1 and
Among these, seven major VOCs were identified in the two 2 treatments were distributed on the negative side of PC1,
cultivars, which contributed individually ≥2% and collectively in the upper and lower left quadrants. The successive red
near 90% to the total VOCs relative abundance (Table 6). basil cuts grown under the same salinity level were detected
These included two monoterpene hydrocarbons: β-Myrcene in the same quadrant, apart from the red basil cuts grown
(woody, vegetative, citrus fruity, and minty nuance) and under high mix salinity. Similar behavior was observed for
(Z)-β-Ocimene (sweet herbal); two oxygenated monoterpenes: the two cuts of green basil except for green basil cuts
eucalyptol (fresh mint, spicy, cooling) and β-Linalool (floral, grown under the moderate mix and moderate NaCl salinity
woody, sweet, spicy, tropical); one aliphatic aldehyde: (E)- treatments. Furthermore, the control treatments were in the
2-hexenal (green, fruity, fresh, herbal, citrus); one aliphatic negative quadrant of PC2 irrespective of cultivar type or cut.
alcohol: 1-octen-3-ol (mushroom, earthy, fungal, green, oily, Quadrant 1 of the score plot included treatments that were
vegetative, umami sensation, and savory-brothy); and one characterized by a higher concentration of Na, K, or N while
sesquiterpene hydrocarbon: trans-α-bergamotene (citrusy, fresh, the treatments in quadrant 2 had the highest concentration
earthy green odor). of Cl, Mg, and phenolics. The lower negative side of PC1
The relative abundance of β-Myrcene was affected only by a (quadrant 3) included treatment combinations that produced
cultivar, being higher in red basil. Eucalyptol was only affected by plants characterized by high S and AsA concentration, increased
the cut sequence, and it was subject to significant cultivar × cut antioxidant activity but also by a higher relative abundance (%) of
interaction as in Green, it increased at Cut2 whereas in Red it the major aroma volatile components like trans-α-bergamotene,
did not change significantly. Salinity did not have a significant (Z)-β-ocimene, and 1-Octen-3-ol. Treatments in the lower right
effect on (E)-2-hexenal as opposed to cultivar and cut, being more quadrant (quadrant 4) produced leaves with the highest FW
abundant in Red rather than Green, and in Cut1 compared to but they were also characterized by a higher concentration of P
Cut2. The relative abundance of (Z)-β-ocimene was subject to and nitrates.
significant interactions involving the three main factors of the
model examined. (Z)-β-ocimene was more abundant in Green
irrespective of salinity treatment and in this cultivar, it nearly
DISCUSSION
doubled from Cut1 to Cut2, as opposed to Red wherein no
difference was observed between cuts. Salinity had no effect on
the relative abundance of this component in Red, however, in
Salinity Affects Morphometric and Yields
Green, it increased significantly in the High NaCl treatment Parameters in a Cultivar-Dependent
compared to the Control and Moderate Mix treatments. The Manner
relative abundance of 1-octen-3-ol was higher in Green than Red; In the present work, the Red and Green basil cultivars showed
however, this difference was apparent only in response to the different responses to moderate and high salt stress induced
Frontiers in Plant Science | www.frontiersin.org 10 March 2022 | Volume 13 | Article 799213You can also read