DISPERSAL TIMING, DISTANCES, AND RATES OF PENNSYLVANIA BLACK BEAR
←
→
Page content transcription
If your browser does not render page correctly, please read the page content below
The Pennsylvania State University
The Graduate School
Ecosystem Science and Management
DISPERSAL TIMING, DISTANCES, AND RATES OF
PENNSYLVANIA BLACK BEAR
A Thesis in
Wildlife and Fisheries Science
by
Wendy C. Vreeland
2015 Wendy C. Vreeland
Submitted in Partial Fulfillment
of the Requirements
for the Degree of
Master of Science
May 2015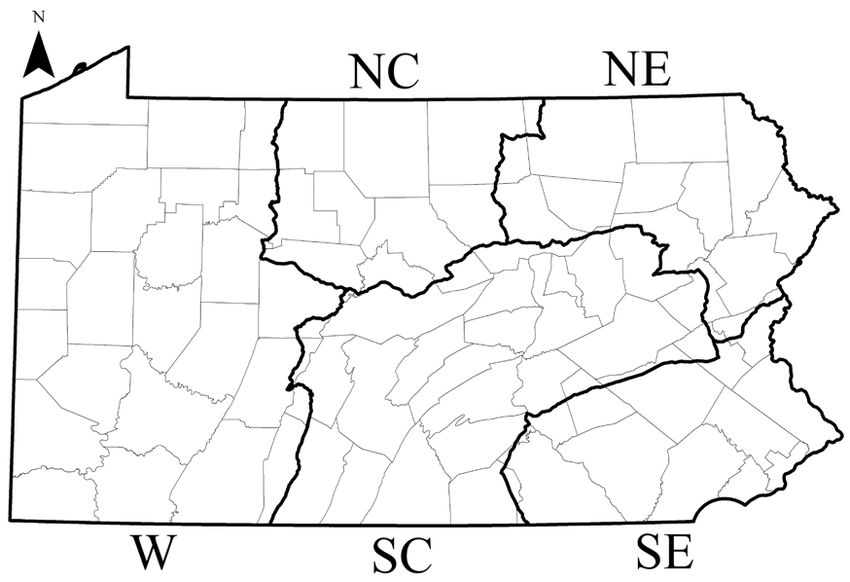
The thesis of Wendy C. Vreeland was reviewed and approved* by the following:

        Duane Diefenbach
        Adjunct Professor of Wildlife Ecology
        Leader, PA Cooperative Fish & Wildlife Research Unit
        Thesis Advisor

        Mark Ternent
        Wildlife Biologist, Pennsylvania Game Commission
        Special Signatory

        Matt Marshall
        Adjunct Assistant Professor of Wildlife Conservation
        National Park Service Program Manager

        Walter Tzilkowski
        Associate Professor Emeritus of Wildlife Science

        Michael Messina
        Professor
        Head of the Department of Ecosystem Science and Management

*Signatures are on file in the Graduate School
iii
ABSTRACT
In Pennsylvania, the black bear (Ursus americanus) population has expanded its range
since the early 1980s. I investigated if dispersal timing, distance, and rates changed compared to
previous research, and if those changes corresponded with range expansion and increasing
population density. I used records of bears captured and ear-taggediv
TABLE OF CONTENTS
LIST OF FIGURES ................................................................................................................. v
LIST OF TABLES ................................................................................................................... vii
ACKNOWLEDGMENTS ....................................................................................................... viii
Chapter 1 Introduction ............................................................................................................ 1
Research Justification ...................................................................................................... 6
Objectives and Hypotheses .............................................................................................. 8
Chapter 2 Methods .................................................................................................................. 11
Timing of Dispersal ......................................................................................................... 16
Dispersal Distances .......................................................................................................... 17
Rates of Dispersal ............................................................................................................ 17
Chapter 3 Results .................................................................................................................... 19
Timing .............................................................................................................................. 19
Distances .......................................................................................................................... 21
Rates ................................................................................................................................. 24
Core Area ......................................................................................................................... 29
Chapter 4 Discussion .............................................................................................................. 35
Management Implications ................................................................................................ 41
Literature Cited ........................................................................................................................ 43
Appendix A Documented movements or dispersal distances (km) across the United
States for both male and female black bears, ages ranging from cubs to subadults
less than 4 years of age. ................................................................................................... 49
Appendix B Capture and recovery form used by the Pennsylvania Game Commission
personnel for each bear handled within Pennsylvania. .................................................... 50
Appendix C Estimated black bear density (bears / 100km2) and 95% confidence
intervals, by region in Pennsylvania, 1980–2008 (see Methods). .................................... 51
Appendix D Estimated black bear density (bears / 100km2) and 95% confidence
intervals, for the core and non-core areas of Pennsylvania, 1980–2008 (see
Methods). ......................................................................................................................... 52v
LIST OF FIGURES
Figure 1-1: Density of black bears (bears/100km2) and 95% confidence limits based on
estimated population size and the area of counties where harvests occurred in
Pennsylvania, 1980–2008. ............................................................................................... 8
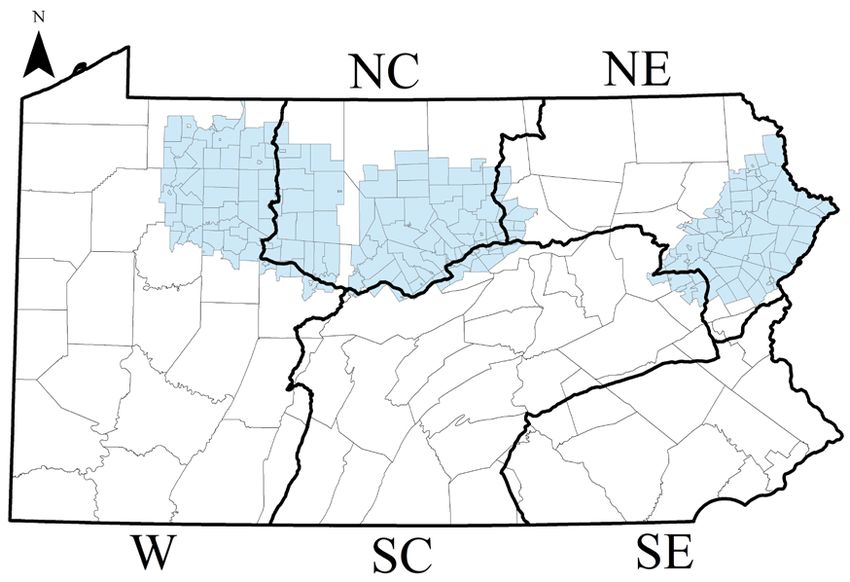
Figure 2-1: Five regions of Pennsylvania merged from Pennsylvania Game Commission
Wildlife Management Units to assess dispersal patterns of bears.................................... 14
Figure 2-2: Three groups of townships representing the core population area of the
current bear range in Pennsylvania defined as areas where bear harvest and research
occurred in the 1970s. ...................................................................................................... 15
Figure 3-1: Estimated dispersal rate grouped by age in months over which dispersal could
have occurred (and 95% CI) for female black bears based on age at recapture or
dead recovery when ≥16 months of age in Pennsylvania, 1980–2008. ........................... 20
Figure 3-2: Estimated dispersal rate grouped by age in months over which dispersal could
have occurred (and 95% CI) for male black bears based on age at recapture or dead
recovery when ≥16 months of age in Pennsylvania, 1980–2008. .................................... 21
Figure 3-3: Dispersal distance function for female black bears ≥16 months of age based
on distance moved (km) from capture to final recapture or dead recovery in
Pennsylvania, 1980–2008. Movements of ≤12 km were combined in the initial
distance group as non-dispersing bears. ........................................................................... 23
Figure 3-4: Dispersal distance function for male black bears ≥16 months of age based on
distance moved (km) from capture to final recapture or dead recovery in
Pennsylvania, 1980–2008. Movements of ≤12 km were combined in the initial
distance group as non-dispersing bears. ........................................................................... 24
Figure 3-5: Estimated dispersal rate during 3 decades (and 95% CI) of female and male
black bears recaptured or dead recovered when ≥16 months of age in Pennsylvania,
1980–2008. Sample size for each decade included. ......................................................... 27
Figure 3-6: Estimated dispersal rate in 4 regions of Pennsylvania (and 95% CI) of female
and male black bears recaptured or dead recovered when ≥16 months of age, 1980–
2008. Sample size for each region included..................................................................... 28
Figure 3-7: Estimated dispersal rate (and 95% CI) of female black bears, for each decade
among regions within Pennsylvania, based on coefficients of a model-averaged
logistic regression model (Table 3-4), 1980–2008. Bears were recaptured or dead
recovered when ≥16 months of age. Sample size for each decade-region combination
included. The black horizontal line represents the overall dispersal rate ( D̂ = 0.28)
for female bears based on the same combined data. ........................................................ 29vi
Figure 3-8: Dispersal rates by decade (and SE bars), of female black bear recaptures or
dead recoveries ≥16 months of age, in the core and non-core areas of the bear range
in Pennsylvania, 1980–2008. Sample size for the decade included for each area. .......... 31
Figure 3-9: Dispersal rates by decade (and SE bars), of male black bear recaptures or
dead recoveries ≥16 months of age, in core and non-core areas of the bear range in
Pennsylvania, 1980–2008. Sample size for the decade included for each area. .............. 32
Figure 3-10: Dispersal rates (and SE bars) by region, of female black bear recaptures or
dead recoveries ≥16 months of age, in the core and non-core areas of the bear range
in Pennsylvania, 1980–2008. Sample size for the region included for each area. ........... 33
Figure 3-11: Dispersal rates (and SE bars) by region, of male black bear recaptures or
dead recoveries ≥16 months of age, in the core and non-core areas of the bear range
in Pennsylvania, 1980–2008. Sample size for the region included for each area. ........... 34vii
LIST OF TABLES
Table 2-1: Estimated mean annual black bear density (bears / 100km2) and standard
deviation for each decade, by region in Pennsylvania, 1980–2008. Density was the
estimated abundance divided by the total area of counties within a region where
harvests occurred (M. Ternent, PGC, unpublished data). ................................................ 14
Table 2-2: Estimated mean annual black bear density (bears / 100km2) and standard
deviation for each decade within the core and non-core areas of Pennsylvania, 1980–
2008. Density was the estimated abundance divided by the total area of counties
within a region where harvests occurred (M. Ternent, PGC, unpublished data). ............ 16
Table 3-1: Summary statistics of dispersal distances (km) by region for Pennsylvania
black bears ≥16 months of age at recapture or dead recovery, 1980–2008. .................... 22
Table 3-2: Summary statistics of dispersal distances (km) by decade for Pennsylvania
black bears ≥16 months of age at recapture or dead recovery, 1980–2008. .................... 22
Table 3-3: Logistic regression models estimating dispersal rate for female black bears
recovered ≥16 months of age in Pennsylvania, 1980–2008. ............................................ 25
Table 3-4: Logistic regression models estimating dispersal rate for male black bears
recovered ≥16 months of age in Pennsylvania, 1980–2008. ............................................ 25
Table 3-5: Coefficients from best logistic regression model for female and male black
bears recovered ≥16 months of age in Pennsylvania, 1980–2008. Parameter
estimates and SE were model averaged for females. The reference level was 1990s
for decade and NE for region. .......................................................................................... 26
Table 3-5: Summary statistics of dispersal distances (km) for Pennsylvania black bears
recaptured or dead recovered ≥16 months of age in the core and non-core areas of
the bear range in Pennsylvania, 1980–2008. .................................................................... 31viii
ACKNOWLEDGMENTS
There are never enough words to express the gratitude one has for the people that support
you through all the adventures, twists and turns, and hardships that life can bring in front of you.
From the high school boyfriend that started me bird watching; Mr. Arthur Cooley, my high
school ornithology teacher, for the wonderful award my senior year; to the companions during
my undergraduate college years that assisted with class projects; and colleagues I worked closely
with across the country. To my committee members and especially my advisor, I greatly
appreciate the patience you have afforded me to complete this project. Your guidance through all
the requirements has been useful in advancing my understanding and career. Mostly the gratitude
goes to my immediate family. Firstly to my parents, with your help I grew up and found a
profession that you knew I would blossom in and would help me make the most out of my life.
All the adventures we had, and all those that we encounter, have created a strong bond of
friendship and love. Secondly to my sister, through everything growing up together we have
grown into greater friends and always supported each other in everything we do. Thank you for
being a confidant and companion, and know that I am always by your side. Lastly to Justin, my
husband, lifelong companion, and best friend I thank you from the bottom of my heart for always
being by my side and making me a whole person. Every chapter in our lives yet to come will be
the best while we stand by each other.Chapter 1
Introduction
The black bear (Ursus americanus) is one of the most studied animals in North America.
In Pennsylvania, research has been ongoing since the 1970s and the ensuing decades of research
have provided a wealth of information. A literature review revealed >100 articles published that
focused on some aspect of Pennsylvania black bear ecology (Ternent 2007). Since the hunting
season was re-opened following closure for two years in the late 1970s, the Pennsylvania Game
Commission (PGC) has collected harvest and life-history information on black bears.
Through the use of population models, the PGC has been monitoring the size of the
population over time, but not bear dispersal. However, dispersal data are important for predicting
the spread of genes, pattern of species invasions, success of reintroductions, and species
persistence and evolution (Clobert et al. 2001, Kenward et al. 2002).
Dispersal has been defined as the permanent departure of an animal from its natal range
to its adult range (Clobert et al. 2001, Bullock et al. 2002). Multiple other authors in Clobert et al.
(2001) define dispersal events differently depending on the questions being addressed but,
Andreassen et al. (2002) suggest one of the simplest descriptions of the process of dispersal being
emigration from the natal range, transfer through multiple areas searching for an adult range, and
immigration for establishment of an adult home range. The definition of dispersal that best fits the
data available for this study was that dispersal was movement from a natal site to settlement at a
new site.
Timing of departure of yearling bears from their mothers has been documented
throughout the range of black bear in North America (Jonkel and Cowan 1971, Alt 1977, Lindzey
and Meslow 1977, Alt 1978, 1980b, Reynolds et al. 1980, Garshelis and Pelton 1981, Rogers2
1987, Schwartz and Franzmann 1992, Lee and Vaughan 2003, 2004). All of these studies
documented separation of yearlings from the adult female from mid-May through early July. A
few of these studies documented departure of yearlings from natal ranges as late as October after
separation from their mother in early summer. In Pennsylvania, female bears typically are
receptive every other summer if they are successful at raising young to the yearling stage of life.
Females that lose cubs shortly after birth are capable of breeding in two consecutive summers.
Strong philopatry by one sex increases relatedness among nearby individuals, and
dispersal theory predicts that such philopatry should result in greater dispersal rates in the other
sex as an inbreeding avoidance mechanism (Perrin and Goudet 2001). Also polygynous mating
systems are associated with female investment in raising young, and thus females are more likely
to benefit from the defense of an acquired territory (Perrin and Goudet 2001). Thus, rates of
dispersal for black bears, which have a polygynous mating system, should follow a similar pattern
of greater male dispersal and limited female dispersal.
Black bears in the western United States have similar timing of separation from mothers,
but complete departures from natal ranges vary, when compared to bears in eastern states. Family
breakup is more or less the permanent separation of a mother from the close company of her
offspring (Rogers 1987). Schwartz and Franzmann (1992) documented that timing of family
breakup in Alaska was similar to Minnesota, but dispersal occurred when most male bears were 2
years of age. In western Idaho, Reynolds et al. (1980) documented yearling bears remaining with
their mothers until early June. Following family breakup, mean distance between yearling bears
and their mother increased as the season progressed. Reynolds et al. (1980) also documented most
bears never recaptured (56%) were dispersing bears3
after family breakup. After 1–2 years, the males dispersed, but females remained and expanded
their ranges as they grew to maturity. Lindzey and Meslow (1977) documented dispersal by 4-
year-old males on Long Island in southwestern Washington. Although males did not leave Long
Island until this age, the distance between females and their cubs began increasing during the first
week of June, coinciding with the beginning of the breeding season. In Montana, Jonkel and
Cowen (1971) documented family breakup at the beginning of the breeding season that began in
late June. Most young bears left their mother’s home range, but typically female cubs remained
and were tolerated.
Garshelis and Pelton (1981) documented home range use in Great Smoky Mountains
National Park (GSMNP) in North Carolina and Tennessee. While following a mother-daughter
pair, mutual avoidance was documented after family breakup in the spring of the daughter’s
second year. Most yearling-adult avoidance in the GSMNP was documented as temporal
avoidance compared to departures creating exclusive spatial avoidance documented in other
studies. Lee and Vaughan (2004) reported family breakup and departures in Virginia occurred
from mid-May to mid-June, and no yearlings remained in their natal range or with siblings after
breakup occurred. A previous study by Lee and Vaughan (2003) documented males departing
their mother’s home ranges from June through September. Two male bears remained in their
mother’s home range which the authors attributed to finding suitable habitat left vacant by the
death of an adult male.
In Pennsylvania, Alt (1977) first documented the departure of yearlings from the adult
females during late June or July, and no yearlings remained with the females after the breeding
season. Following that research, Alt (1978) documented a change in the separation of yearlings
and adult females. He documented the departure began in early May through late May, instead of
June and July. Several female yearlings remained in part of their natal range while male yearlings
dispersed from May through October. Dispersal was primarily by males as yearlings and 2-year-4
olds, with one reported as having dispersed as a 3-year-old. Annual progress reports by Alt
(1979b, 1980b) continued to monitor dispersal and recoveries of yearlings. No male yearlings
were recovered in their natal ranges after 18 months of age, and few dispersed prior to 17 months
of age. Most female yearlings did not depart, and either remained completely within or continued
to use a portion of their natal range. Only one female was recovered away from her natal range
after 18 months of age. These results suggest a rapid departure of the male yearlings, but little to
no departure of females, in Pennsylvania.
Wolff (1994) compared dispersal distances across multiple taxonomic groups and
suggested distances moved by juveniles may be due to an opposite sex adult in the natal range or
overlapping ranges. Individuals of several species have been documented to remain in a natal
range if the opposite sex parent or nearby adult were eliminated and no longer present in their
former home range, and no examples of parental aggression as the cause of juvenile dispersal
were located (Wolff 1993). Bowman et al. (2002) calculated that distances moved by juveniles
could be based on the linear dimension of a home range when body size was ignored; they
inferred that median distance moved was 7 times the linear dimension of a home range.
In other areas of North America, Garshelis and Pelton (1981), Clevenger and Pelton
(1989), Elowe and Dodge (1989), Wooding et al. (1992), Lee and Vaughan (2003, 2004) and
Dobey et al. (2005) reported distance information for cubs, yearlings or subadult black bears as
short as 0.2 km into habitat adjoining the mother’s home range, but unoccupied by another adult
(Appendix A). Both sexes were reported to make maximum dispersal movements 100–200 km
(Rogers 1987, Elowe and Dodge 1989). After family breakup average separation distances from
mothers for females ranged from 0.5 – 3.5 km and males ranged from 0.8 – 15.7 km. Clevenger
and Pelton (1989) and Lee and Vaughan (2004) documented increasing distances through the
summer with greatest distances recorded in early fall. During extensive research with black bears
in New Mexico, through radio telemetry and genetic analysis, Costello (2008, 2010) and Costello5
et al. (2008) were able to document emigration distances of both sexes of yearlings. Female
yearlings were found overlapping annual ranges with natal ranges although distances between
natal and adult ranges varied from 0–5 km. Male bear emigration distances were 22–62 km,
which were 2–6 average home-range diameters.
In north-central Pennsylvania, Wakefield (1969) was the first to record movements of
wild captured and nuisance bears in Pennsylvania. Wakefield (1969) documented a 42 km
movement by a non-nuisance bear. Eveland (1973), Kordek (1973), and Alt (1977, 1978)
provided insight into bear dispersal in northeastern Pennsylvania when population abundance was
lower than today. Eveland (1973) documented males averaging 11.7–13.4 km (depending on age)
while average movement by females was 6.3 km. Kordek (1973) reported similar distances to
Eveland (1973) for females (x̄ = 5 km) and males (x̄ = 13.7 km). Alt (1978) found yearling males
dispersed up to 53 km from their mother’s home range, whereas females established adult home
ranges near their natal range (≤ 6.5 km). Based on concurrent information on breeding status of
adult females (Alt 1983), dispersal movements in these studies overlapped with the peak of the
breeding season from mid-June to mid-July. Recording movement distances continued in
Pennsylvania while relocating female black bear to southwestern counties of Pennsylvania (Alt
1979a, 1980a, Ternent 2007). The longest movement recorded during research in Pennsylvania
was a female over 2 years of age that moved 172.8 km (Alt 1995).
In Virginia, Lee and Vaughn (2003) reported dispersal movements similar to
Pennsylvania but surmised that their definition of a dispersal event was too strict to identify all
dispersal movements. They defined dispersal as a movement of a male bear (>18 km) or female
(>8 km) from their natal home range when the two home range areas did not overlap. They
recorded female movements ranging from 0.3 – 13.9 km, but did not consider any of their
females as dispersed. The male movements were 0.9 – 80.0 km and dispersal was limited due to
early loss of transmitters before most males may have finished dispersing. More recently,6
Costello (2010), working in New Mexico, documented female yearlings overlapping their natal
and adult ranges that averaged 3 km between central points. She also documented yearling male
dispersal distances of 22–61 km. She surmised that the >20 km male dispersal distances typically
observed would serve to minimize encounters between males and closely related females.
Research Justification
Currently in Pennsylvania, 300–700 bears are ear-tagged annually and approximately
20% of these tagged bears are recovered during the hunting season (Diefenbach et al. 2004,
Ternent 2010). Because thousands of bears have been tagged and recovered in Pennsylvania since
the 1980s, sufficient data exist to assess dispersal movements (Kenward et al. 2002). Although
radio-collaring allows near 100% tracking of dispersal movements, generally only adult females
have been radio-collared in Pennsylvania and this age class has dispersed prior to radio-collaring
(Ternent and Sittler 2007). In Pennsylvania, data were available on more than 65,000 individual
bears handled since the mid-1970s, with approximately 9,600 having been marked with ear tags.
Most early data were collected through intensive live-animal research conducted in the
northeastern and north-central regions of Pennsylvania. The recent data contain captures across
the range of bears in Pennsylvania.
Knowing when and how dispersal occurs and its role in the maintenance and expansion
of a bear population is important for maintaining a viable population, and has implications for
estimating abundance for models assuming population closure (Diefenbach et al. 2004).
Characteristics of dispersal in male and female black bears are poorly understood in
Pennsylvania. Limited research following individual bears, some wearing radio-collars, was
performed before the bear population reached the higher population level currently in7
Pennsylvania. When Pennsylvania bear numbers were at historic lows, two areas in the north-
central and northeastern regions were the primary range of black bears in the state. From these
two areas, population density has increased and distribution has expanded across two-thirds of the
state (Ternent 2007). Overall bear density increased from 8.24 bears/100km2 in 1980 to 18.8
bears/100km2 in 2008 (Figure 1-1; M. Ternent, PGC, unpublished data). The average annual
increase in density from 1980–2008 averaged 0.38 bears/100km2 but annual change by year
varied. Average annual increase in density was 0.23 bears/100km2 during the 1980s, 0.35
bears/100km2 during the 1990s, and 0.56 bears/100km2 during the 2000s. The overall increase in
bear density occurred in both the core and non-core areas and in all regions of Pennsylvania
(Appendices C and D).
My research questions addressed implications of how dispersal patterns vary spatially
and temporally in Pennsylvania. Understanding changes in dispersal, as the bear population
increased in Pennsylvania, may help managers identify successful strategies for reducing bear-
human conflicts and understanding effects of the population on re-colonization and continued
expansion. I used decade as a surrogate for population density because the abundance of bears
had been increasing with regulated management of the Pennsylvania population (Figure 1-1).
Increasing densities and the range expansion of bears has resulted in more bear-human conflicts.
The number of bears being captured and moved due to nuisance complaints has been increasing
each year (Ternent 2007). Understanding dispersal rates and distances, and the factors that
influence dispersal, will help identify the scale at which bear populations need to be managed to
minimize bear-human conflicts.8
25
20
Statewide density (bears /100 sq. km)
15
10
5 density
LCL
UCL
0
1980
1982
1984
1986
1988
1990
1992
1994
1996
1998
2000
2002
2004
2006
2008
Year
2
Figure 1-1: Density of black bears (bears/100km ) and 95% confidence limits based on estimated
population size and the area of counties where harvests occurred in Pennsylvania, 1980–2008.
Objectives and Hypotheses
My objectives were to (1) describe timing of dispersal of yearling bears by calculating dispersal
probabilities by age of bears, (2) quantify dispersal distances of yearling bears and assess whether
the distance of dispersal was greater in the historic core bear population area compared to newly
established area of the bear range, and (3) estimate dispersal rates for yearling bears across
Pennsylvania and estimate dispersal rates in the core bear population area compared to the newly
established area of the bear range. I analyzed recapture and dead recovery data obtained when9
bears were ≥16 months of age from bears tagged before dispersal is known to occur (≤15 months
of age).
Timing of departure of yearling bears from natal ranges is known to occur as breeding
season begins and continues through fall. I hypothesized timing of dispersal in Pennsylvania
overlapped the onset of breeding season and yearling departures from their mother peaked in May
and June. I predicted dispersal was completed by the time male and female bears reached 24
months of age. Male bears are known to disperse before females; therefore, timing in
Pennsylvania should indicate that yearling males depart before yearling females.
Dispersal theory predicts that strong philopatry by one sex should result in greater
dispersal rates in the other sex as an inbreeding avoidance mechanism (Perrin and Goudet 2001).
Previous research has found a greater proportion of males than females dispersed and males
disperse farther distances. However, documented increasing population densities since the 1980s
suggest more suitable habitat has become occupied, and dispersing juveniles may have to travel
greater distances to find unoccupied suitable habitat. Bear densities are greater in the north-
central and northeastern regions of Pennsylvania, which contain the historic bear range, and more
intraspecific competition for resources may be occurring (Appendices C and D). I hypothesized
female bears dispersed shorter distances about 0.5 – 1 times the greatest linear distance across an
average female home range in Pennsylvania (approx. 6–15 km), and male black bears dispersed
over 20 km, or the equivalent of 1.5 – 15 times the greatest linear distance across an average
female home range in Pennsylvania (approx. 20–200 km). I expected dispersal distance increased
for both sexes across the decades as bear density increased. I predicted dispersal distance was
greater in the north-central and northeastern regions of the state compared to the regions of lower
densities (western, south-central and southeastern). For distances moved by bears in the historic
core area, I predicted both sex moved greater distances in the core area than the non-core area due
to already existing higher densities of bears.10
Dispersal in black bears is male dominated but limited female dispersal has been
observed. Home ranges of female offspring tend to overlap the mother’s range via short-distance
dispersals, which over time will create a slowly expanding central population. Newly established
populations exist at lower densities resulting in less competition for resources and mates. Higher
population densities create increased competition for available space and mating opportunities. I
hypothesized that dispersal rate increased since the 1980s as a result of increasing population
densities and increased competition for unoccupied suitable habitat. Previous Pennsylvania
research documented dispersal rates for male were 0.85 – 1.00 and female rates were 0.0 – 0.20;
therefore, I expected male black bear dispersal rate was near 1.00 whereas the dispersal rate for
females wasChapter 2
Methods
The data I used for analysis were obtained from the PGC and contained all bears handled
within the state from 1969–2008. Handling events occurred throughout the year related to hunting
seasons, research efforts, collection of roadkills, response to nuisance complaints, or tagging
efforts by agency personnel. Pennsylvania Game Commission employees and researchers
captured bears using culvert traps, foot snares, dart guns, and locating cubs in dens associated
with radio-collared females (Wakefield 1969, Kordek 1973, Alt 1977, 1990, Ternent and Sittler
2007). Annually, 300–700 bears were ear-tagged throughout the state where uniquely numbered
metal ear tags were attached to each ear (National Band and Tag Company, Newport, Kentucky,
USA or Hasco Tag Company, Dayton, Kentucky, USA). Also, some bears received a unique
tattoo to ensure recovery information was documented if ear tags were lost.
The PGC database of bear captures, recaptures and dead recoveries included date of
capture, age at capture (or recapture), capture location, and recovery location (Appendix B). I
selected bears initially tagged at12
For all bears, I assumed a birth month of January and the age of a bear handled that
month was labeled as 0 (cub) or 12 months (yearling) of age. I used the bear age at date of initial
tagging for determining the age at subsequent recoveries. If comments or weight information
suggested that bear age at initial tagging was unlikely to be ≤15 months old, the data were not
used. Ages estimated from extracted teeth were performed by Matson’s Laboratories (Missoula,
Montana) via counting cementum annuli. Compared to estimated ages calculated from initial
captures, there were several estimated ages from extracted teeth showing discrepancies. For
consistency in situations when the known age and the tooth age differed, I aged the bears based
on the initial capture information instead of the tooth data.
To evaluate the effects of population increase on changes in dispersal patterns, I assigned
each bear to a decade of dispersal based on the year the bear became 12 months old. Previous
research in Pennsylvania reported most dispersal occurred by 24 months of age (Alt 1978,
1980b). I labeled all dispersal years from 1980–1989 as being the decade 1980s, 1990–1999 as
the decade 1990s, and 2000–2008 as the decade 2000s.
I estimated dispersal distance by calculating the distance between initial capture and the
final recapture or dead recovery location. In northeastern Pennsylvania, Alt (1977) estimated
average home range was 41 km2 for females and 173 km2 for males. A study of female home
range size in north-central Pennsylvania showed an average of 24.8 km2 (McLaughlin 1981). Alt
et al. (1980: 133) noted “…another parameter occasionally used for home range comparisons is
the greatest linear distance across the home range”. In northeastern Pennsylvania, the greatest
distance across home ranges of male was ≤26 km and female bears was ≤13 km (Alt et al. 1980,
Ternent 2007). Although my data did not track specific bears using telemetry and did not
determine if initial capture was within a mother’s home range, I assumed the initial capture
locations to be within the natal range because most bears were captured with their mothers. I
assumed calculated distances ≥13 kilometers represented dispersal events based on the research13
from Alt (1977). I investigated whether dispersal occurred for bears recaptured ≤15 months of
age. If distance moved by a cub indicated the bear had dispersed, I reviewed the database
comments to determine if the cubs were with their mother and siblings. Recaptures with mothers
were identified as non-dispersers even though the calculated distance suggested otherwise for
several cubs (n = 23).
I delineated 5 regions of Pennsylvania representing differing landscape and bear
population characteristics (Figure 2-1). These regions were based on combinations of WMUs
containing similar bear habitat and densities (Table 2-1). The western (W) region consisted of
counties in northwestern and southwestern Pennsylvania, and combined WMUs that historically
had low bear densities. The north-central (NC) region encompassed the Allegheny Plateau,
merging WMUs that have consistently maintained high bear densities. The south-central (SC)
region contained the state’s ridge-and-valley topography, and combined areas of high and low
bear densities although the high densities occurred in the most recent decade. The northeastern
(NE) region included the northeastern counties of the state where bear densities varied from
medium to high and were part of the historic range continually occupied by bears. Few bears
occurred and no data were available in the southeastern (SE) region. The SE region was not
included in further analysis.14
Figure 2-1: Five regions of Pennsylvania merged from Pennsylvania Game Commission Wildlife
Management Units to assess dispersal patterns of bears.
Table 2-1: Estimated mean annual black bear density (bears / 100km2) and standard deviation for
each decade, by region in Pennsylvania, 1980–2008. Density was the estimated abundance
divided by the total area of counties within a region where harvests occurred (M. Ternent, PGC,
unpublished data).
Western North-central South-central Northeastern
Decade x SD x SD x SD x SD
1980s 1.93 0.46 3.64 0.51 1.52 0.30 2.60 0.39
1990s 2.82 0.69 3.18 0.47 2.09 0.30 2.56 0.38
2000s 3.98 0.51 4.74 0.58 3.55 0.34 4.40 0.4615
I assigned areas similar to the historic core areas in the north-central and northeastern
regions (Ternent 2007) to represent the core area of the newly expanded population. I defined the
core population area as townships where bears were harvested and research was conducted in the
1970s. To determine the townships associated with the core population area, I created 3 polygons
in ArcGIS (ESRI Inc., Redlands, CA) around locations where harvest occurred and designated the
townships within or intersected by these polygons as the core population area. Each bear was
assigned to the core or non-core area of the current range based on the township of capture
(Figure 2-2). The average annual bear densities in the core area and the non-core area increased
each decade (Table 2-2).
Figure 2-2: Three groups of townships representing the core population area of the current bear
range in Pennsylvania defined as areas where bear harvest and research occurred in the 1970s.16
Table 2-2: Estimated mean annual black bear density (bears / 100km2) and standard deviation for
each decade within the core and non-core areas of Pennsylvania, 1980–2008. Density was the
estimated abundance divided by the total area of counties within a region where harvests occurred
(M. Ternent, PGC, unpublished data).
Core Area Non-Core Area
Decade x SD x SD
1980s 25.60 4.42 1.38 0.47
1990s 31.40 4.35 3.17 0.95
2000s 47.96 4.51 7.11 1.16
I used topographic maps of each county and descriptions of captures, recaptures, and
dead recovery locations for each bear to assign x–y coordinates to locations. I projected all maps
in Pennsylvania Albers projection and obtained coordinates in meters using the geographic
coordinate system of North American Datum 1927. I calculated distances in kilometers between
initial capture location and the final recapture or dead recovery for each bear. A dispersal event
was determined based on the distance moved, and I classified both sexes as a disperser if distance
was ≥13km or a non-disperser if distance was17
recaptured or dead recovered at 20–23 months of age could have dispersed at any age prior to or
at the age at recovery. Therefore, the age groups provide estimates of cumulative dispersal rate by
age. When dispersal rates between ages at recovery no longer increased then I assumed dispersal
to be completed by the first age class where dispersal rates became constant. For example, if
dispersal rates for the ≤15, 16–19, and 16–23 month of age groups increased but older age groups
did not change, then I assumed dispersal was completed by 23 months of age.
Dispersal Distances
I developed a state-wide dispersal-distance function (Wiens 2001) separately for males
and females using all distances. I binned calculated distances into 5 kilometer intervals for bears
≥16 months of age, only for the dispersal-distance functions due to reduced numbers of bears
located at the longer distances. I used analysis of variance (ANOVA) to test for differences in
dispersal distances for each sex between the regions, decades, and between the core area and the
non-core area.
Rates of Dispersal
I defined dispersal rate as the proportion of bears that moved ≥13 km between their
capture and final recapture or dead recovery location. To estimate dispersal rate (D), I developed
a sex-specific set of candidate logistic regression models (SAS 9.3, SAS Inc. Cary, NC)
examining all possible combinations and interactions of the variables region and decade. I
modeled dispersal rate (1 = dispersed; 0 = non-dispersed) separately for males and females
because I expected dispersal rates to differ for each sex. For all models, the reference decade was18
the 1990s and the reference region was the northeastern (NE). I used an intercept-only (null)
model to estimate an overall dispersal rate (D) for each sex. I used Akaike’s Information
Criterion, adjusted for small sample size ((Burnham and Anderson 2002), to select the best model
of dispersal. I used model averaging if no single best model was evident.
To test differences in dispersal proportions for each sex between the core area and non-
core area, I performed a chi-square test of independence using contingency tables for statewide,
decade, and region data.Chapter 3
Results
Timing
Dispersal first became evident when yearling female bears were 16–19 months of age.
The estimated dispersal rate ( D̂ ) for females recovered at 16–19 months of age was 0.28 (SE =
0.06). All other female age groups indicated similar dispersal rates as bears recovered at 16–19
months of age (Figure 3-1). Similar to females, male dispersal was first evident when they were
16–19 months of age ( D̂ = 0.61 SE = 0.18; Figure 3-2). Male bears recovered when older than 19
months of age had similar dispersal rates as those recovered at 16–19 months of age, which
indicated that most dispersal occurred when they were 16–19 months of age.20
1
0.9
0.8
Dispersal rate 0.7
0.6 n = 14 n = 13
0.5 n = 117
0.4 n = 77 n=3
0.3
0.2
0.1
0
16-19 16-23 16-27 16-31 16-32+
Months over which dispersal could have occurred
Figure 3-1: Estimated dispersal rate grouped by age in months over which dispersal could have
occurred (and 95% CI) for female black bears based on age at recapture or dead recovery when
≥16 months of age in Pennsylvania, 1980–2008.21
1
0.9 n=3
n = 36 n = 116 n = 14
0.8 n = 68
Dispersal rate 0.7
0.6
0.5
0.4
0.3
0.2
0.1
0
16-19 16-23 16-27 16-31 16-32+
Months over which dispersal could have occurred
Figure 3-2: Estimated dispersal rate grouped by age in months over which dispersal could have
occurred (and 95% CI) for male black bears based on age at recapture or dead recovery when ≥16
months of age in Pennsylvania, 1980–2008.
Distances
Median distance dispersed was greater for males (47.03 km, n = 98) than females (25.84
km, n = 70). Female bears ≥16 months of age dispersed an average distance of 31.28 km (SE =
2.18 km), which was about 2 times the greatest linear distance across an average female home
range in Pennsylvania. The average dispersal distance moved by male bears ≥16 months of age
was 54.12 km (SE = 2.49 km), about 4 times the linear distance across an average female home
range.
All average male dispersal distances were greater than female dispersal distances for each
of the regions and decades (Table 3-1, 3-2). I failed to detect a difference for dispersal distances22
among regions for males (F3, 155 = 1.25, P = 0.29) and females (F3, 66 = 2.74, P = 0.11). Also, I
failed to detect differences for distance dispersed across decades for males (F2, 132 = 0.66, P =
0.52) or females (F2, 67 = 3.13, P = 0.39). For both sex, the dispersal distance functions indicated
that most bears did not move far beyond an average home range size (Figures 3-3 and 3-4).
Table 3-1: Summary statistics of dispersal distances (km) by region for Pennsylvania black bears
≥16 months of age at recapture or dead recovery, 1980–2008.
Males Females
Region n x SE 95%LCL 95%UCL n x SE 95%LCL 95%UCL
W 42 54.56 3.35 47.79 61.34 19 29.82 2.90 23.72 35.92
NC 14 55.50 9.22 35.59 75.42 17 40.42 6.01 27.67 53.16
SC 16 51.42 5.77 39.11 63.72 5 30.49 6.99 11.08 49.89
NE 26 54.31 4.96 44.10 64.52 29 27.02 3.00 20.88 33.15
Table 3-2: Summary statistics of dispersal distances (km) by decade for Pennsylvania black bears
≥16 months of age at recapture or dead recovery, 1980–2008.
Males Females
Decade n x SE 95%LCL 95%UCL n x SE 95%LCL 95%UCL
1980s 21 55.42 5.72 43.49 67.34 17 26.00 2.81 20.05 31.96
1990s 20 46.05 4.78 36.06 56.05 13 32.43 3.84 24.06 40.79
2000s 57 56.47 3.31 49.84 63.09 40 33.15 3.39 26.30 40.0023
70 68.75
60
50
Percentage
40
30
20
10.71
10 4.91 5.80
2.68
0.45 1.79 0.45 1.34 0.45 0.89 0.89 0.45 0.45
0
96-100
13-20
21-25
26-30
31-35
36-40
41-45
46-50
51-55
56-60
61-65
66-70
71-75
76-80
81-85
86-90
91-95
100+
0
Distance (km)
Figure 3-3: Dispersal distance function for female black bears ≥16 months of age based on
distance moved (km) from capture to final recapture or dead recovery in Pennsylvania, 1980–
2008. Movements of ≤12 km were combined in the initial distance group as non-dispersing bears.24
50
45
40
35 32.91
30
Percentage
25
20 16.46
15
10 7.17 6.75 7.59
5 3.38 3.80 2.95 3.38 3.38 2.53
1.27 1.27 1.69 1.27 1.27 0.42 1.27 1.27
0
96-100
13-20
21-25
26-30
31-35
36-40
41-45
46-50
51-55
56-60
61-65
66-70
71-75
76-80
81-85
86-90
91-95
100+
0
Distance (km)
Figure 3-4: Dispersal distance function for male black bears ≥16 months of age based on distance
moved (km) from capture to final recapture or dead recovery in Pennsylvania, 1980–2008.
Movements of ≤12 km were combined in the initial distance group as non-dispersing bears.
Rates
Bears recovered25 rates for males were lower than I had predicted near 1.0, and overall rates for females were higher than I predicted at
26

Table 3-5: Coefficients from best logistic regression model for female and male black bears

recovered ≥16 months of age in Pennsylvania, 1980–2008. Parameter estimates and SE were

model averaged for females. The reference level was 1990s for decade and NE for region.

                                               Female                           Male
       Model variables                   Estimate     SE                 Estimate     SE
       Intercept                          -1.1683    0.3129                1.0116    0.3371
       Decade(1980s)                      -0.3822    0.5552               -1.1488    0.4107
       Decade(2000s)                       0.2187    0.4932                0.2144    0.4019
       Region(W)                          -0.1978    0.2437
       Region(NC)                         -0.2699    0.4524
       Region(SC)                          0.1511    0.2817

        My results of dispersal rates for the decades and regions did not match predictions.

Dispersal rates for females ( D̂ = 0.16–0.38) were influenced by decade (Figure 3-5). I had

predicted similar female dispersal rates across the 1980s and 1990s with a possible increase

between the 1990s and 2000s. Dispersal rates for females ( D̂ = 0.22–0.43) were not strongly

influenced by region (Figure 3-6) even though I expected the NC and NE regions to have greater

rates. For female bears within all regions, the dispersal rate was similar in the 1980s and 1990s

and increased in the 2000s (Figure 3-7). Females in the NC region had greater dispersal rates ( D̂

= 0.24–0.36) than females in all other regions every decade. During the 2000s, dispersal rate was

similar among all regions ( D̂ = 0.32–0.36). Females in the NC region had the largest increase in

dispersal rate from the 1990s ( D̂ = 0.21) to the 2000s ( D̂ = 0.36).

        For males, dispersal rates across decades almost matched my predictions but dispersal

rates by regions were different than predicted. Dispersal rates for males ( D̂ = 0.47–0.77) were

influenced by decade (Figure 3-5) and it almost matched the increase I had predicted. I failed to

detect differences in dispersal rates for males ( D̂ = 0.56–0.79) by region (Figure 3-6) even

though I expected the NC and NE regions to have higher rates than the rest of Pennsylvania.
27
1.00
n = 104
0.90
n = 53
0.80
n = 80
0.70
Dispersal rate
0.60
0.50 n = 80
0.40
0.30 n = 83 n = 61
0.20
0.10
0.00
1980s 1990s 2000s 1980s 1990s 2000s
Females Males
Decade
Figure 3-5: Estimated dispersal rate during 3 decades (and 95% CI) of female and male black
bears recaptured or dead recovered when ≥16 months of age in Pennsylvania, 1980–2008. Sample
size for each decade included.28
1.0
n = 29
0.9 n = 36
0.8 n = 77
n = 95
Dispersal rate 0.7 n = 40 n = 13
0.6
0.5 n = 104
0.4
n = 67
0.3
0.2
0.1
0.0
W NC SC NE W NC SC NE
Females Males
Region
Figure 3-6: Estimated dispersal rate in 4 regions of Pennsylvania (and 95% CI) of female and
male black bears recaptured or dead recovered when ≥16 months of age, 1980–2008. Sample size
for each region included.29
0.80
n = 31
0.70 n=9 n = 16
n = 24
0.60 n=3 n=2
n = 19 n = 59
0.50 n=6
Dispersal rate
n=2 n = 29
0.40 n = 24
0.30
0.20
0.10
0.00
1980s 1990s 2000s 1980s 1990s 2000s 1980s 1990s 2000s 1980s 1990s 2000s
W NC SC NE
Decade and Region
Figure 3-7: Estimated dispersal rate (and 95% CI) of female black bears, for each decade among
regions within Pennsylvania, based on coefficients of a model-averaged logistic regression model
(Table 3-4), 1980–2008. Bears were recaptured or dead recovered when ≥16 months of age.
Sample size for each decade-region combination included. The black horizontal line represents
the overall dispersal rate ( D̂ = 0.28) for female bears based on the same combined data.
Core Area
Mean and median dispersal distances for both sexes were greater in the non-core area
(Table 3-5); however, I found no statistical difference for males (F1, 134 = 1.00, P = 0.31) or
females (F1, 58 = 0.30, P = 0.58). Overall dispersal rates did not differ between the core area and
non-core area for males ( χ1 = 0.83, 0.90 > P > 0.75) or females ( χ1 = 1.80, 0.25 > P > 0.10). I
2 230
predicted higher bear density in the core area would have resulted in bears dispersing greater
distances.
I detected a difference in dispersal rates between the core area and non-core area for
females during the 1980s ( χ1 = 3.96, P < 0.05; Figure 3-8). However, I failed to detect
2
differences of dispersal rates for females during the 1990s ( χ1 = 0.81, 0.50 > P > 0.30) and
2
2000s ( χ1 = 0.10, P = 0.75). My prediction of female dispersal rates being greater in the core
2
area during every decade was not supported. For males, I failed to detect a difference in dispersal
rates for any decade between the core and non-core areas (P > 0.05; Figure 3-9). These results did
not match my prediction for males in the core area having greater dispersal rates than bears in the
non-core area.
Within regions dispersal rates differ from what I predicted for both females and males
(Figures 3-10 and 3-11). For females, I detected a difference between the core and non-core areas
in the NC region ( χ1 = 6.93, P = 0.01) and NE region ( χ1 = 4.82, 0.01 < P < 0.05); and failed to
2 2
detect a difference in the W region ( χ1 = 0.07, P = 0.80) and SC region ( χ1 = 0.043, 0.90> P >
2 2
0.80). I had predicted that region would not influence female dispersal rates and all rates from the
core area would have been greater than the non-core area. For the males, I failed to detect a
difference for any of the regions between the core and non-core areas (P > 0.05). I had predicted
that dispersal rates would be greater for the core area males in the NC and NE regions.31
Table 3-5: Summary statistics of dispersal distances (km) for Pennsylvania black bears recaptured
or dead recovered ≥16 months of age in the core and non-core areas of the bear range in
Pennsylvania, 1980–2008.
n x SE Median Maximum
Females
Core Area 76 12.07 2.18 4.90 106.71
Non-Core Area 105 14.39 1.58 7.34 77.60
Males
Core Area 66 27.04 3.31 19.16 130.67
Non-Core Area 123 32.02 2.27 26.83 100.81
0.6
0.5
Dispersal rate
0.4
0.3 n= 25 n= 48
n= 44
0.2
n= 32
0.1 core
n= 19 n= 13 non-core
0
n= 191980s n= 25 n= 13
1990s n= 32 n= 44
2000s n= 48
Decade
Figure 3-8: Dispersal rates by decade (and SE bars), of female black bear recaptures or dead
recoveries ≥16 months of age, in the core and non-core areas of the bear range in Pennsylvania,
1980–2008. Sample size for the decade included for each area.32
1
0.9
n= 26
0.8
0.7 n= 10 n= 70
Dispersal rate
0.6 n= 28
0.5 n= 25
0.4 n= 30
0.3
0.2 core
0.1
non-core
0
n= 301980sn= 25 n= 101990sn= 28 n= 26 2000sn= 70
Decade
Figure 3-9: Dispersal rates by decade (and SE bars), of male black bear recaptures or dead
recoveries ≥16 months of age, in core and non-core areas of the bear range in Pennsylvania,
1980–2008. Sample size for the decade included for each area.33
1 core
n=5 non-core
Dispersal Rate 0.8
0.6
0.4
n = 41
n = 30
0.2 n=3 n = 49 n = 10
n=3
n = 40
0
n = 3W n = 49 n = 30NC n = 5 n = 3 SCn = 10 n = 40 NEn = 41
Region
Figure 3-10: Dispersal rates (and SE bars) by region, of female black bear recaptures or dead
recoveries ≥16 months of age, in the core and non-core areas of the bear range in Pennsylvania,
1980–2008. Sample size for the region included for each area.34
1 core
n= 3 n= 3 non-core
0.8
n= 59 n= 21
Dispersal Rate
n= 26
0.6
n= 9 n= 39
n= 32
0.4
0.2
0
n= 3 W n= 59 n= 21 NCn= 9 n= 3 SCn= 26 n= 39 NEn= 32
Region
Figure 3-11: Dispersal rates (and SE bars) by region, of male black bear recaptures or dead
recoveries ≥16 months of age, in the core and non-core areas of the bear range in Pennsylvania,
1980–2008. Sample size for the region included for each area.Chapter 4
Discussion
My analyses indicated timing of departures did not change over a 30–year period,
dispersal distances by females were greater than previous research reported, and dispersal rates
overall differed from previous Pennsylvania research. About 20% fewer male bears dispersed
compared to previous studies in Pennsylvania, but dispersal distances were similar (Alt 1978,
1979b, 1980b). Proportion of bears dispersing, depending on region, increased for females from
0.0–0.19 in the 1970s to 0.20–0.36 during 1980s – 2000s; and seemed to decrease for males from
0.85–1.00 in the 1970s to 0.48–0.79 depending on region and decade (Alt 1978, 1979b, 1980b).
However, more records of dispersal were available for my research compared to previously
published estimates of dispersal rates in Pennsylvania. Most previous Pennsylvania studies
monitored and followed36
season and related family break-up occurring in June and July (Alt 1977, 1978), yearlings would
be 17 or 18 months of age. My results indicated dispersal rates of bears recaptured or dead-
recovered when 16–19 months of age was not different from those recovered >20 months of age,
which indicated most dispersal occurs during 16–19 months of age. My data did not show timing
of departures from the natal home range to the week or month due to the lack of direct monitoring
of individuals. Thus, the best evidence I had for timing of departures of yearlings was that almost
no departures occurred before 14 months of age. The few yearling bears I identified as dispersed,
from 13–15 months of age, suggested that the definition of yearling departure starting at 16
months of age was reasonable. I found no evidence that density of the bear population in
Pennsylvania affected when yearlings dispersed. Increased bear densities do not affect the onset
of estrus in female bears, which means the timing of dispersal of yearling bears should not have
been affected.
My results of distances dispersed are important for explaining range expansion of bears
in Pennsylvania. Recent research has documented that across taxonomic groups, distances moved
by the sex that usually disperses is about 7 times the linear distance across the species home range
(Bowman et al. 2002). For bears in Pennsylvania, my results showed longer distances dispersed
by males compared to females, although distances I calculated did not suggest the male’s
movements are as extreme as Bowman et al. (2002) predicted. My results indicated that females
dispersed greater distances compared to earlier research in eastern North America (Appendix A).
Average female dispersal distances I calculated were about 3 times greater than expected from
previous literature in Pennsylvania (Eveland 1973, Kordek 1973, Alt 1978, 1980b, Alt 1995).
These distances indicated some females dispersed beyond their mother’s home range and related
females near or overlapping their mother’s home range. Male average dispersal distances were
different compared to previous Pennsylvania research (Eveland 1973, Kordek 1973, Alt 1978,
1980b). My results indicated males moved about 2 times greater than previously reported in37
Pennsylvania which is about 4 times the linear distance across an average female home range.
Males were moving well beyond any male or female relatives.
I predicted that dispersal distances would increase as population density increased, but I
failed to detect any change over a 30–year period (Table 3-2). Lutz et al. (2015) documented
dispersal distances of female white-tailed deer increased with increasing deer densities. If the
dispersal behavior of female deer is to avoid dominant females (Lutz et al. 2015), female yearling
bears in areas of higher bear densities may have to disperse farther to avoid dominant females.
Even though yearling female bears have been documented overlapping newly established home
ranges with a mother (Alt 1977; 1978; 1980, Rogers 1987, Costello 2008; 2010), multiple related
females already overlapping a mother’s home range could result in yearlings dispersing greater
distances.
I failed to detect a difference for male dispersal distances, across decades, or among
regions, suggesting that increased densities may not have affected distances moved by males.
Young males are known to be the most mobile cohort of a bear population (Alt 1978, Elowe
1989). Being that males already disperse at high rates may help explain why I did not detect a
change in a 30–year period. Therefore, males may disperse at similar rates and distances
regardless of population density because this behavior likely evolved to minimize inbreeding.
As I predicted, dispersal rates for females increased over the decades as the population
density increased in Pennsylvania. Even though dispersal in bears is male-biased, the greater
dispersal rate exhibited by females in Pennsylvania compared to other research findings explains
the expansion of the bear range in Pennsylvania that occurred over the past 30 years. The highest
female dispersal rates occurred in the NC region of Pennsylvania, which had some of the highest
densities every year. Rates in the NC region were higher each decade than all other regions that
same decade. The increase in dispersal rates within the SC region compared to previous research
may be related to the region’s connectivity with the historic bear populations in the NC region,You can also read