Diversity Dimensions of Freshwater Fish Species around the World
←
→
Page content transcription
If your browser does not render page correctly, please read the page content below
Journal of Geographic Information System, 2021, 13, 1-18
                                                                                                   https://www.scirp.org/journal/jgis
                                                                                                             ISSN Online: 2151-1969
                                                                                                               ISSN Print: 2151-1950

Diversity Dimensions of Freshwater Fish
Species around the World

Carlos Granado-Lorencio1, Cástor Guisande2, Patricia Pelayo-Villamil3,
Ana Manjarrés-Hernández4, Emilio García-Roselló5, Juergen Heine5, Elisa Pérez-Costas2,
Luis González-Vilas2, Jacinto González-Dacosta5, Jorge M. Lobo6*
1
 Departamento de Biología Vegetal y Ecología, Facultad de Biología, Universidad de Sevilla, Seville, Spain
2
 Facultad de Ciencias del Mar, Universidad de Vigo, Campus Lagoas-Marcosende, Vigo, Spain
3
 Grupo de Ictiología, Universidad de Antioquia, Medellín, Colombia
4
 Instituto Amazónico de Investigaciones (IMANI), Universidad Nacional de Colombia, Leticia, Colombia
5
 Department of Computer Science, Universidad de Vigo, Campus Lagoas-Marcosende, Vigo, Spain
6
 Departamento de Biogeografía y Cambio Global, Museo Nacional de Ciencias Naturales (CSIC), Madrid, Spain

How to cite this paper: Granado-Lorencio,        Abstract
C., Guisande, C., Pelayo-Villamil, P., Man-
jarrés-Hernández, A., García-Roselló, E.,        The quality and coverage of the available taxonomical and geographical in-
Heine, J., Pérez-Costas, E., González-Vilas,     formation and the recognition that diversity is multi-faceted are two main
L., González-Dacosta, J. and Lobo, J.M. (2021)
                                                 factors that hinder to understand the spatial and temporal variations of bio-
Diversity Dimensions of Freshwater Fish
Species around the World. Journal of Geo-
                                                 diversity. In this study, we aim to quantify the global distribution of five di-
graphic Information System, 13, 1-18.            versity components used to assess freshwater fish diversity in river basins
https://doi.org/10.4236/jgis.2021.131001         around the world. The multidimensional character of these diversity compo-
                                                 nents was estimated and the so obtained diversity dimensions mapped. This
Received: November 23, 2020
Accepted: January 1, 2021
                                                 was done taking into account those well-surveyed basins discriminated by
Published: January 4, 2021                       considering collector’s curves, and additionally by controlling for the effect of
                                                 survey effort on all considered diversity components. A total of 1,472,109 oc-
Copyright © 2021 by author(s) and
                                                 currence records were analysed, corresponding to 17,292 species of freshwa-
Scientific Research Publishing Inc.
This work is licensed under the Creative
                                                 ter fishes. Five diversity components were considered: functional richness,
Commons Attribution International                species richness, taxonomic diversity, and two rarity measures. Well-surveyed
License (CC BY 4.0).                             river basins were discriminated using accumulation curves. The effects of
http://creativecommons.org/licenses/by/4.0/
                                                 survey biases and knowledge gaps were minimized by determining the rela-
                 Open Access
                                                 tionship of each component with the completeness values calculated for each
                                                 river basin. The geographical pattern derived from raw data is skewed by the
                                                 unequal knowledge available, and all diversity components were positively
                                                 correlated with completeness values. The first dimension described the asso-
                                                 ciation between species richness and functional diversity. The second dimen-
                                                 sion represented rarity and taxonomic diversity. The congruence between
                                                 species richness and functional diversity suggests that ecosystem functions

DOI: 10.4236/jgis.2021.131001          Jan. 4, 2021                 1                      Journal of Geographic Information System
C. Granado-Lorencio et al.

                                  increase with the number of fish species present in river basins and that a de-
                                  crease in species richness may involve a loss of functionality. The levels of
                                  rarity and taxonomic diversity of many species-poor basins found in arid and
                                  cold regions suggest that the distinctiveness of their freshwater fishes is pri-
                                  marily a consequence of how isolated these basins are.

                                  Keywords
                                  Diversity Components, Functional Diversity, Species Richness, Rarity,
                                  Taxonomic Diversity

                                1. Introduction
                                One of the main goals of the Ecology and Biogeography is to understand the
                                spatial and temporal variations that underlie biodiversity [1] [2]. However, two
                                factors complicate this mission: 1) All the variables used to measure diversity
                                (diversity components) depend fundamentally on the quality and coverage of the
                                available taxonomical and geographical information [3] [4]; 2) Diversity is a
                                multi-faceted measure [5] [6] [7]. The evolutionary history, phenetic variability
                                and ecological functions of different species, among other dimensions of diver-
                                sity, interact and covary according to a syndromic pattern. The multidimension-
                                al nature of biodiversity means that many of the commonly recognized diversity
                                variables are associated and that some variables are better than others in ex-
                                plaining ecosystem functions [8] [9] [10].
                                  Large-scale distributional patterns in freshwater fishes have been assessed ac-
                                cording to species richness [11], endemicity [12] [13] and, more recently, beta
                                diversity [14] [15], and functional diversity [16]. These studies have primarily
                                focused on estimating the probable causal processes behind fish diversity [17]
                                [18]. Freshwater fish research has been influenced by the multidimensional ap-
                                proach towards understanding biodiversity [19] [20]. Functional diversity mea-
                                surements have begun to be incorporated into basic and applied studies [21]
                                [22]. Ecosystem functioning is linked with the functional diversity of the species
                                within ecosystems [23]; therefore selecting the right species traits and metrics to
                                estimate functional diversity has become a priority. A recent review [24] dem-
                                onstrated that a plurality of functional diversity studies have been of plants
                                (31%), while a far smaller proportion of studies have been of fishes (8%). Most
                                of the latter studies focus on marine species. There have been few functional
                                studies of freshwater fish [25]-[33]. Most large-scale functional diversity studies
                                of freshwater fishes have been based on ecomorphological traits (e.g. [34]) and
                                focus on the relationships between taxonomic and functional diversity in coral
                                fishes [35] [36].
                                  In the present study, we use comprehensive world information about the tax-
                                onomy and distribution of freshwater fishes to examine the multidimensional
                                character of several diversity components. We made a special effort to estimate

DOI: 10.4236/jgis.2021.131001                         2                      Journal of Geographic Information System
C. Granado-Lorencio et al.

                                the functional diversity by delineating different trait states for over 16,000 spe-
                                cies. Surveys carried out in the different world river basins may seriously affect
                                diversity measurements [37]. Therefore, diversity dimensions were estimated in
                                well-surveyed basins that had been discriminated using collector’s curves. Addi-
                                tionally, the effect of survey effort on all considered diversity components was
                                controlled. The aim of these analyses is to describe the geographic distribution of
                                the main diversity dimensions observed in freshwater fishes globally and to de-
                                termine the impact of each diversity component on this distribution.

                                2. Methods
                                2.1. Occurrence Records and River Basins
                                The data set of geographical records for freshwater fishes reported by Pe-
                                layo-Villamil et al. [38] was updated to reflect changes in taxonomy and to in-
                                clude the novel species described as of January 2020. Data sources include
                                GBIF, web pages, museum collections, and journal articles [38]. Records were
                                downloaded and filtered using the ModestR software package [39] [40] [41]
                                [42]. GBIF records were filtered as follows: 1) records with the same latitude
                                and longitude were excluded, 2) records with zero latitude or longitude were
                                excluded, and 3) occurrences in habitats other than those corresponding to
                                terrestrial freshwater ecosystems were eliminated [see 41 for details]. As of
                                January 2020, 17,292 species of freshwater fishes were recognized by taxonom-
                                ists as valid. Information about these species can be found on the website
                                IPez1.4 (http://www.ipez.es, [43]). Of these, 17,148 (99.2% of the total) had as-
                                sociated geographical information. In total, 11,472,109 occurrence records were
                                analysed.
                                  The geospatial data for river basins were downloaded from the WaterBase
                                project website (http://www.waterbase.org). This data was processed using
                                ModestR. WaterBase global river basin data were downloaded from the drainage
                                basin data set distributed through HYDRO1k, a hydrological database developed
                                by the EROS Data Center of the U.S. Geological Survey (USGS). This database
                                included a collection of global geo-referenced layers that had a 1 km resolution.
                                These layers had been derived from GTOPO30, a 30 arc-second digital elevation
                                model (DEM) of the World. Using the World Geodetic System 1984 standard
                                (WGS84), the drainage basins data were assigned latitude/longitude geographi-
                                cal coordinates. In order to generate the ESRI Shape files available via the Wa-
                                terBase website, vertices were smoothed out by applying a 500-meter threshold.
                                The river basin dataset was originally obtained by combining flow accumulation
                                and flow direction layers. These layers were derived from the DEM, which had
                                been hydrologically corrected according to GTOPO30 dataset. The basins were
                                organized using procedure of Pfafstetter [44], which had been adapted for use
                                with the HYDRO1k dataset [45]. River basins were divided into six levels. Each
                                sub-basin was assigned a unique Pfafstetter code, (i.e., a six-digit code with in-
                                formation regarding the interconnectedness of the basins). The second level of

DOI: 10.4236/jgis.2021.131001                         3                     Journal of Geographic Information System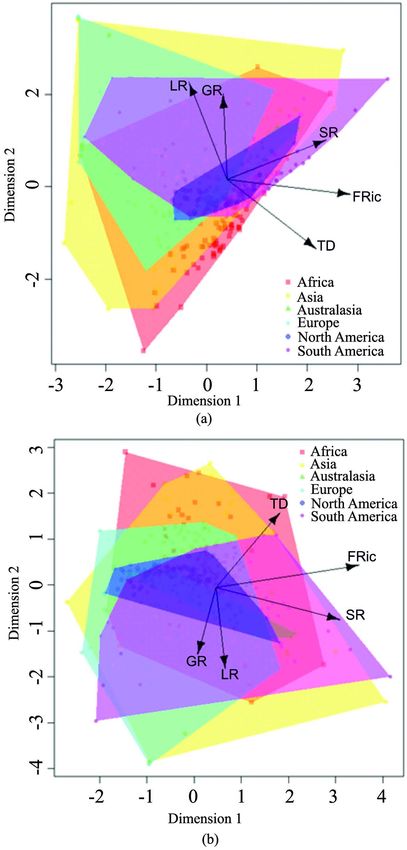
C. Granado-Lorencio et al.

                                each river basin [46] as used as the spatial unit for estimating diversity mea-
                                surements (n = 440). This is because the second level was the geographical extent
                                that best illustrated the effects of environmental parameters on the distribution
                                of freshwater fish species [47].

                                2.2. Biodiversity Metrics and Biological Traits
                                Using the DER function of the EcoIndR package [48] [49] of the R software
                                package [50], five diversity components representing different biodiversity me-
                                trics were estimated for each river basin: species richness (SR), geographic rarity
                                (GR), rarity index (LR), taxonomic diversity (TD), and functional richness
                                (FRic). GR reflected the average rarity of all species present in each river basin
                                and was calculated as the inverse of the relative frequency of occupied basins
                                [51]. LR weight the species according to their rarity (see [52] [53]). TD was used
                                to determine the taxonomic hierarchical Linnaean level of the species observed
                                in each river basin [54]. The FRic was defined as the volume of the functional
                                space occupied by the species [55].
                                   We modified the classification system described by Buisson et al. [56] in order
                                to apply it to the functional description of freshwater fish species. Six traits were
                                analysed. These traits represented three basic biological functions: Food acquisi-
                                tion traits, life habitat, and locomotion traits. Food acquisition traits were: 1)
                                feeding habitat (pelagic, benthopelagic and benthivorous); and 2) trophic guild
                                (primary consumer, secondary consumer, top-predator, omnivorous and detri-
                                tivorous). Life habitat was defined as either pelagic, benthopelagic, or demersal.
                                Locomotion traits were: 1) body length (in cm: small < 15, medium 15 - 50, large
                                50 - 150 and extra-large > 150), 2) rheophily (rheophilic, limnophilic and eury-
                                topic) and 3) migration type (potamodromous, anadromous, catadromous, am-
                                phidromous, oceanodromous and no migration). When not available through
                                FishBase, this information was collect either from https://www.fishbase.org/ or
                                from source articles.
                                   It was not possible to include reproduction traits such as life span, parental
                                care or reproduction habitat, because it was too difficult to assign these func-
                                tional traits to over 16,000 species.

                                2.3. Well-Surveyed River Basins and Data Treatment
                                According to Pelayo-Villamil [37], 71% of world countries had inventories of
                                freshwater fish species that were of poor quality. Differences in the quality of in-
                                ventories could be observed between countries. Furthermore, even those coun-
                                tries with relatively accurate and reliable national inventories had provincial and
                                regional inventories that varied highly in completeness [37]. Therefore, whenev-
                                er the available raw occurrences of the species had been used in the past, species
                                richness in some river basins had doubtlessly been underestimated. In order to
                                prevent this bias, potentially well-surveyed river basins (WSB) were discrimi-
                                nated using the RWizard [57] application KnowBR [58] (www.ipez.es/RWizard).
                                KnowBR was also available as an R package on CRAN [59]. KnowBr was used to

DOI: 10.4236/jgis.2021.131001                         4                      Journal of Geographic Information System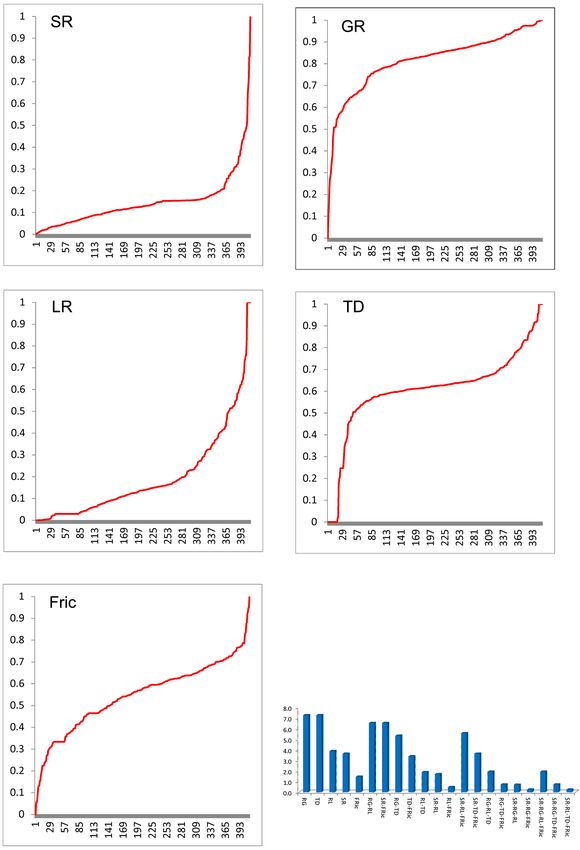
C. Granado-Lorencio et al.

                                build species accumulation curves from database records. As a surrogate for the
                                survey effort carried out in each river basin, these curves described the relation-
                                ship between the accumulated number of species and the increasing number of
                                database records taken. WSBs were therefore defined as those basins which si-
                                multaneously had a final accumulation curve slope of ≤0.02 (two new species
                                added every 100 records), a completeness value of ≥90% (the percentage of spe-
                                cies predicted by the accumulation function that were also observed), and a ratio
                                of number of records to number of observed species of ≥15. Fifty-two world riv-
                                er basins fulfilled these requirements (12.6% of the total). Most basins were lo-
                                cated in the Nearctic region (n = 42). A low completeness value of 5% was as-
                                signed to all the river basins in which completeness values could not be com-
                                puted (n = 70; a 17% of total) due to the low number of database records and/or
                                the lack of asymptotic tendencies.
                                   All the diversity components were influenced by bias and by the unequal
                                knowledge about different world basins. The diversity components significantly
                                correlated to a greater or lesser degree with the completeness values derived
                                from the accumulation functions (Pearson product-moment correlations oscil-
                                lating from r = -0.18 in the case of LR to 0.77 for FRic; p < 0.001 in all cases).
                                Thus, in addition to calculating WSBs, the dependence between diversity com-
                                ponents and the survey effort carried out in each river basin was solved by per-
                                forming a regression between the values of each diversity component and the
                                completeness values obtained for the river basins. All these diversity metrics
                                were firstly standardized to zero for means and one standard deviation to elimi-
                                nate the effect of measurement scales. These regressions were adjusted to linear
                                and quadratic functions in order to explore possible curvilinear relationships. A
                                quadratic function is considered statistically significant when both linear and
                                quadratic terms have a significance level of ≤1%. The residuals of these regres-
                                sions are thus un-correlated with the completeness values used as a surrogate for
                                survey effort (r values are zero in all cases). Subsequently, the relationships be-
                                tween the different diversity components were examined using a simplified ver-
                                sion of the procedure proposed by Stevens & Tello [5] [6]. This procedure con-
                                sisted of a principal component analysis (PCA) computed for the five diversity
                                components (with a varimax normalized rotation) using the so generated or-
                                thogonal variables with eigenvalues higher than one as the main diversity di-
                                mensions. Of course, the values of diversity components and dimensions can be
                                related with different types of explanatory variables (area, climate, historical,
                                etc.). The objective in this study is not to examine the comparative relevance of
                                different environmental variables on diversity differences, but to estimate the
                                relationships among diversity components and the global distribution of the di-
                                versity dimensions.

                                3. Results
                                The raw data showed that functional richness was generally higher in the tropi-
                                cal regions of South America, Central America, Africa and Asia, but also, to a

DOI: 10.4236/jgis.2021.131001                         5                     Journal of Geographic Information System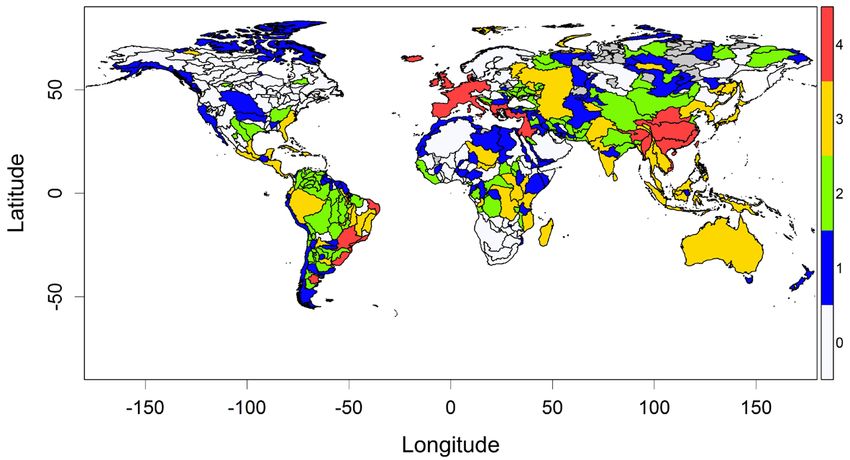
C. Granado-Lorencio et al.

                                       lesser extent, in North America and Europe (Figure 1). The functional richness
                                       of freshwater fish species had a geographical pattern partially similar to the pat-
                                       tern that had been observed for species richness ([38] Figure 1). Both variables
                                       were positively correlated both when the raw data was considered (r = 0.63; p <
                                       0.001), and when only WSBs were considered (r = 0.75; p < 0.001). The other
                                       diversity components had relatively more uniform geographical patterns (Figure
                                       1).

Figure 1. World patterns in the variation of the five considered diversity components emerging when the raw data is considered.
SR = species richness, GR = geographic rarity, LR = Leroy rarity index, TD = taxonomic diversity, FRic = functional richness.
Color bars represent the variations in the different components according to their own units of measure.

DOI: 10.4236/jgis.2021.131001                                 6                      Journal of Geographic Information System
C. Granado-Lorencio et al.
Two diversity dimensions appear when the information coming from the 52
WSBs is considered. The PCA analysis indicated that these two dimensions ac-
counted for 48.1% and 23.4% of the total variability in diversity components,
respectively. The first dimension was positively related with SR, LR and FRic.
These three components accounted for 88%, 77%, and 62% of the variance of
this factor, respectively (square of factor loadings). The second dimension is po-
sitively related with TD (67% of variance) and GR (37%). The results obtained
with the WSBs did not match those observed when complete set of data was
used in the analysis (Figure 2(a)). In this case, the two first PCA dimensions ex-
plained 40.8% and 27.3% of the total variability. The first dimension was posi-
tively related with SR, TD and FRic (60%, 51% and 88% of variance, respective-
ly), while the second dimension was positively related with the two rarity metrics
GR (47%) and LR (59%).
Figure 2. (a) Distribution of the raw diversity data regarding freshwater fishes in the
space delimited by the two main dimensions of a Principal Component Analysis; (b) Dis-
tribution of the same diversity data when the effect of survey completeness on each diver-
sity component was minimized by applying the residuals of a regression between the raw
data and completeness values derived from accumulation curves. SR = species richness,
GR = geographic rarity, LR = Leroy rarity index, TD = taxonomic diversity, FRic = func-
tional richness. Data are grouped by colour according to continent.
DOI: 10.4236/jgis.2021.131001 7 Journal of Geographic Information SystemC. Granado-Lorencio et al.
Geographical patterns derived from the raw data were influenced by the un-
equal knowledge since all diversity components are positively correlated with
completeness values and therefore, their variation could be explained by differ-
ences in the survey efforts carried out in each river basin (Table 1). The resi-
duals of these regressions were rescaled to values of between 0 and 1 (corrected
diversity components). A PCA analysis on these rescaled values again selected
two diversity dimensions that could account for 34.3% and 30.4% of total varia-
bility in the diversity components, respectively (Figure 2(b)). As in the case of
the WSB based analysis, the first dimension is positively correlated with SR and
FRic (63% and 80% of total variance) but was uncorrelated with the two rarity
components. The second dimension is negatively correlated with GR and LR
(40% and 58% of variance), and positively correlated with TD (44% of total va-
riance) (see Table 1). The geographical distribution of the so obtained dimensions
(Figure 3) demonstrated that, some of the South American and South-Eastern
Asian basins had the strongest species richness and functional diversity values
(positive values of the dimension 1).
Figure 3. Global patterns in the variation of the two main PCA dimensions that sum-
marize the data regarding the five diversity components. The raw data of each diversity
component describing each river basin was regressed against the completeness values de-
rived from the accumulation curves, and the resulting residuals managed in PCA analyses
in order to minimize the effect of survey bias. Color bars represent the factors scores of
each PCA dimension corresponding to each river basin.
DOI: 10.4236/jgis.2021.131001 8 Journal of Geographic Information SystemC. Granado-Lorencio et al.
Table 1. Linear regressions between each diversity component and the completeness val-
ues for all the world river basins of level 2 (predictor variable). Completeness was calcu-
lated using accumulation curves that described the relationship between the accumulated
number of species and the number of database records in each river basin. Regressions
were adjusted using both linear and quadratic functions. DIM1 and DIM2 represent the
factor loadings of the diversity components for the two first factors of a Principal Com-
ponent Analysis carried out on the residuals of the relationships between each diversity
component and completeness values. DIM1WSB and DIM2WSB were the factor loadings
of each diversity component in a PCA analysis of the 52 river basins that were considered
well-surveyed. SR = species richness, GR = geographic rarity, LR = Leroy rarity index, TD
= taxonomic diversity, FRic = functional richness.
R2 × 100 F(2, 409) p Relationship DIM1 DIM2 DIM1WSB DIM2WSB
SR 19.38 49.17C. Granado-Lorencio et al.
Figure 4. Frequency distributions of the corrected diversity components obtained after
rescaling (between 0 and 1) the residuals of a regression between the raw data and com-
pleteness values derived from accumulation curves. SR = species richness, GR = geo-
graphic rarity, LR = Leroy rarity index, TD = taxonomic diversity, FRic = functional
richness. Bottom right histogram represents the percentage of world river basins selected
by the different combinations of diversity components, when the continuous values
representing each diversity component are transformed in binary ones by using as thre-
shold those values equal or higher than upper quartiles.
the many limitations that stem from the biases and gaps in information about
different diversity components [4] [37]. These shortcomings are evident in our
analysis since only 13% of world river basins were defined as well-surveyed. Of
these, 80% are located in the Nearctic region. What be done shed light on global
DOI: 10.4236/jgis.2021.131001 10 Journal of Geographic Information SystemC. Granado-Lorencio et al.
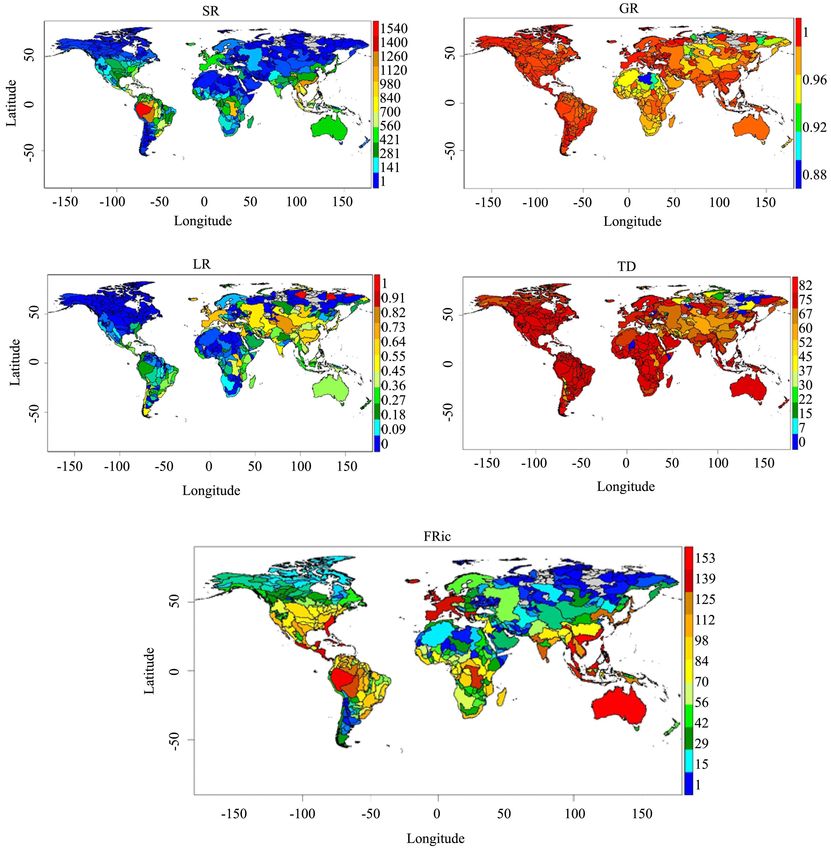
Figure 5. Global distribution of each diversity component. The raw data of each diversity
component was regressed against the completeness values derived from the accumulation
curves constructed for each river basin. Using as threshold those values equal or higher
than the upper quartile, the so resulting residuals were rescaled to fit values of either 0 or
1. These values were then used to construct binary maps reflecting the “most diverse ba-
sins”. SR = species richness, GR = geographic rarity, LR = Leroy rarity index, TD = tax-
onomic diversity, FRic = functional richness.
DOI: 10.4236/jgis.2021.131001 11 Journal of Geographic Information SystemC. Granado-Lorencio et al.
Figure 6. Level 2 global river basins that showed an increase in the diversity compo-
nent values, as determined by overlaying the binary maps from Figure 5. Color bars
represent the number diversity components qualified as “most diverse” for each river
basin.
diversity patterns under these circumstances? Our approach has been to minim-
ize the effects of these limitations by estimating the residuals of the relationship
between each one of the diversity components and the completeness values de-
rived from the accumulation functions. These corrected diversity components
provide a less biased image about the global distribution of diversity in freshwa-
ter fishes. The confidence in these corrected diversity dimensions is based on the
fact that they are fundamentally similar to those obtained from analysing
well-surveyed river basins.
Kuczynski et al. [30] found a weak congruence between different diversity
components in Europe. However, at a global scale our analyses show that the
different diversity components representing the distribution of freshwater fishes
in world river basins can adequately be summarized using only two main di-
mensions. The first diversity dimension reflects a gradient in species richness
and functional diversity: these diversity components are higher in regions with a
tropical or subtropical climate and lower in regions with arid, cold or cold-temperate
conditions (see [61]). This gradient can be explained by taking into account the
dominant effects of energy availability and habitat heterogeneity [17]. The
second diversity dimension summarizes rarity and taxonomic diversity values
that sometimes occur in some species rich basins such as in Easter South Amer-
ica, Europe or Eastern Asia. However, these basins are primarily located in spe-
cies poor areas under arid, cold and cold-temperate conditions. Northern areas
of the Holarctic region and southern South American basins covered by ice
sheets during the Last Glacial Maximum could have propitiated the isolation and
distinctiveness of the freshwater fishes found in these regions [62]. Similarly, the
singularity of the Sino-Oriental or the arid African basins can be explained as a
consequence of the isolation generated by the contraction of either ancient wa-
tercourses [63] or the uplift of the Tibetan plateau [64].
Studies on functional diversity have always shown a heterogeneous pattern
with respect taxonomic groups and ecosystems. However, fish were usually not
DOI: 10.4236/jgis.2021.131001 12 Journal of Geographic Information SystemC. Granado-Lorencio et al.
taken into account in these analyses. Freitas & Mantorani [24] reviewed the
works published from 1994 to 2014 and found that only 8% of the 621 functional
diversity studies are about fish. Likewise, only 8% of these studies were per-
formed on a global scale. Generally speaking, in these limited studies only small
biogeographic areas were investigated and only ecomorphological aspects were
considered [28] [65] [66] [67]. As far as we know, this is the first study in which
the functional diversity of all species of freshwater fish known to date have been
investigated in all their areas of geographic distribution. This analysis has shown
that functional diversity and species richness are closely linked on a global scale.
This relationship can vary depending on the chosen metrics [68], and the num-
ber of analysed traits [69]. However, the fact that this relationship between func-
tional diversity and species richness can be observed in natural systems would
indicate that a river basin with a higher number of species generally also has a
higher number of occupied niches. Functional diversity influences ecosystem
dynamics and stability [70]. Therefore, the association observed between these
two diversity components among world freshwater fish would suggest that eco-
system functions increase with the number of fish species found in river basins,
but also that a decrease in species richness might involve a loss of functionality.
5. Conclusion
In this study, we aim to surpass the biases and gaps in the distributional infor-
mation on world freshwater fishes taking into account the multidimensional
character of diversity. The provisional character of this faunistic data is evident
because just one world basin in seven would have a reliable inventory, most part
of them located in the Nearctic region. Considering completeness calculations,
we propose here to estimate corrected diversity components able to provide a
less biased image. This approach seems to generate reliable patterns when they
are compared with those coming from the analysis of well-surveyed basins. In
the light of this work, two diversity dimensions seem to be enough to offer a
consistent picture on the geographical patterns of world freshwater fishes. One
dimension is related with the tropical-temperate latitudinal gradient in species
richness and functional diversity, and another associated with the higher rarity
and taxonomic diversity that host some species poor areas located under arid,
cold and cold-temperate conditions.
Acknowledgements
We are indebted to all the organizations, institutions and people whose efforts
have made it possible to compile the valuable biological data that now are freely
available.
Conflicts of Interest
The authors declare no conflicts of interest regarding the publication of this
manuscript.
DOI: 10.4236/jgis.2021.131001 13 Journal of Geographic Information SystemC. Granado-Lorencio et al.
Data Availability Statement
All the primary data used in this study are freely available in the IPez1.4 website
(http://www.ipez.es). Data sources include GBIF derived dataset filtered export
of GBIF occurrence data https://doi.org/10.15468/dd.fp89mv. A detailed de-
scription of the data sources, the considered species, the states of each biological
trait assigned to each species, and the values of the diversity components, the
slopes, completeness, and the ratios of the number of species to records for each
level 2 river basin are available upon request.
References
[1] Scott, J.M., Davis, B., Csuti, R., et al. (1993) Gap Analysis: A Geographic Approach
to Protection of Biological Diversity. Wildlife Monographs, 123, 3-41.
[2] Meynard, C.N., Devictor, V., Mouillot, D., et al. (2011) Beyond Taxonomic Diversi-
ty Patterns: How Do Alpha, Beta and Gamma Components of Bird Functional and
Phylogenetic Diversity Respond to Environmental Gradient across France? Global
Ecology and Biogeography, 20, 893-903.
https://doi.org/10.1111/j.1466-8238.2010.00647.x
[3] Conroy, M.J. and Noon, B.R. (1996) Mapping of Species Richness for Conservation
of Biological Diversity: Conceptual and Methodological Issues. Ecological Applica-
tions, 6, 763-773. https://doi.org/10.2307/2269481
[4] Hortal, J., de Bello, F., Diniz-Filho, J.A.F., et al. (2015) Seven Shortfalls That Beset
Large-Scale Knowledge of Biodiversity. Annual Review of Ecology, Evolution, and
Systematics, 46, 523-549. https://doi.org/10.1146/annurev-ecolsys-112414-054400
[5] Stevens, R.D. and Tello, J.S. (2014) On the Measurement of Dimensionality of Bio-
diversity. Global Ecology and Biogeography, 23, 1115-1125.
https://doi.org/10.1111/geb.12192
[6] Stevens, R.D. and Tello, J.S. (2018) A Latitudinal Gradient in Dimensionality of
Biodiversity. Ecography, 41, 2016-2026. https://doi.org/10.1111/ecog.03654
[7] Naeem, S., Prager, C., Weeks, B., et al. (2016) Biodiversity as a Multidimensional
Construct: A Review, Framework and Case Study of Herbivory’s Impact on Plant
Biodiversity. Proceedings Royal Society B, 283, Article ID: 20153005.
https://doi.org/10.1098/rspb.2015.3005
[8] Flynn, D.F.B., Mirotchnick, N., Jain, M., et al. (2011) Functional and Phylogenetic
Diversity as Predictors of Biodiversity-Ecosystem Function Relationships. Ecology,
92, 1573-1581. https://doi.org/10.1890/10-1245.1
[9] Cadotte, M.W., Cavender-Bares, J., Tilman, D., et al. (2009) Using Phylogenetic,
Functional and Trait Diversity to Understand Patterns of Plant Community Prod-
uctivity. PLoS ONE, 4, e5695. https://doi.org/10.1371/journal.pone.0005695
[10] Le Bagousse-Pingueta, Y., Soliveres, S., Grossa, N., et al. (2019) Phylogenetic, Func-
tional, and Taxonomic Richness Have Both Positive and Negative Effects on Eco-
system Multifunctionality. Proceedings of the National Academy of Sciences of the
United States of America, 116, 8419-8424.
https://doi.org/10.1073/pnas.1815727116
[11] Oberdorff, T., Guégan, J.F. and Hugueny, B. (1995) Global Scale Patterns in Fresh-
water Fish Species Diversity. Ecography, 18, 345-352.
https://doi.org/10.1111/j.1600-0587.1995.tb00137.x
[12] Oberdorff, T., Lek, S. and Guégan, J.F. (1999) Patterns of Endemism in Riverine
DOI: 10.4236/jgis.2021.131001 14 Journal of Geographic Information SystemC. Granado-Lorencio et al.
Fish of the Northern Hemisphere. Ecology Letters, 2, 75-81.
https://doi.org/10.1046/j.1461-0248.1999.t01-2-22051.x
[13] Tedesco, P.A., Leprieur, F., Hugueny, B., et al. (2012) Patterns and Processes of
Global Riverine Fish Endemism. Global Ecology and Biogeography, 21, 977-987.
https://doi.org/10.1111/j.1466-8238.2011.00749.x
[14] Leprieur, F., Tedesco, P.A., Hugueny, B., et al. (2011) Partitioning Global Patterns
of Freshwater Fish Beta Diversity Reveals Contrasting Signatures of Past Climate
Changes. Ecology Letters, 14, 325-334.
https://doi.org/10.1111/j.1461-0248.2011.01589.x
[15] Casties, I. and Briski, E. (2019) Life History Traits of Aquatic Non-Indigenous Spe-
cies: Freshwater vs. Marine Habitats. Aquatic Invasions, 14, 566-581.
https://doi.org/10.3391/ai.2019.14.4.01
[16] Villéger, S, Grenouillet, G. and Brosse, S. (2014) Functional Homogenization Ex-
ceeds Taxonomic Homogenization among European Fish Assemblages. Global
Ecology and Biogeography, 23, 1450-1460. https://doi.org/10.1111/geb.12226
[17] Guégan, J.F., Lek, S. and Oberdorff, T. (1998) Energy Availability and Habitat He-
terogeneity Predict Global Riverine Fish Diversity. Nature, 391, 382-384.
https://doi.org/10.1038/34899
[18] Hugueny, B., Oberdorff, T. and Tedesco, P.A. (2010) Community Ecology of River
Fishes: A Large Scale Perspective. In: Jackson, D. and Gido, K., Eds., Community
Ecology of Stream Fishes: Concepts, Approaches and Techniques, American Fishe-
ries Society Symposium, Bethesda, 29-62.
[19] Strecker, A.L., Olden, J.D., Whittier, J.B., et al. (2011) Defining Conservation Priori-
ties for Freshwater Fishes According to Taxonomic, Functional, and Phylogenetic
Diversity. Ecological Applications, 21, 3002-3013.
https://doi.org/10.1890/11-0599.1
[20] Rolls, R.J., Heino, J., Ryder, D.S., et al. (2018) Scaling Biodiversity Responses to Hy-
drological Regimes. Biological Review, 93, 971-995.
https://doi.org/10.1111/brv.12381
[21] de Carvalho, R.A. and Tejerina-Garro, F.L. (2015) Relationships between Tax-
onomic and Functional Components of Diversity: Implications for Conservation of
Tropical Freshwater Fishes. Freshwater Biology, 60, 1854-1862.
https://doi.org/10.1111/fwb.12616
[22] Decker, E., Linke, S., Hermoso, V., et al. (2017) Incorporating Ecological Functions
in Conservation Decision Making. Ecology and Evolution, 7, 8273-8281.
https://doi.org/10.1002/ece3.3353
[23] Naeem, S., Duffy, J.E. and Zavaleta, E. (2012) The Functions of Biological Diversity
in an Age of Extinction. Science, 336, 1401-1406.
https://doi.org/10.1126/science.1215855
[24] Freitas, J.R. and Mantovani, W. (2018) An Overview of the Applicability of Func-
tional Diversity in Biological Conservation. Brazilian Journal of Biology, 78,
517-524. https://doi.org/10.1590/1519-6984.09416
[25] Winemiller, K.O. (1991) Ecomorphological Diversification of Freshwater Fish As-
semblages from Two Biotic Regions. Ecological Monographs, 61, 343-365.
https://doi.org/10.2307/2937046
[26] Pont, D., Hugueny, B., Beier, U., et al. (2006) Assessing River Biotic Condition at a
Continental Scale: A European Approach Using Functional Metrics and Fish As-
semblages. Journal of Applied Ecology, 43, 70-80.
https://doi.org/10.1111/j.1365-2664.2005.01126.x
DOI: 10.4236/jgis.2021.131001 15 Journal of Geographic Information SystemC. Granado-Lorencio et al.
[27] Comte, L., Cucherousset, J., Boulêtvean, S., et al. (2016) Resource Partitioning and
Functional Diversity of Worldwide Freshwater Fish Communities. Ecosphere, 7,
e01356. https://doi.org/10.1002/ecs2.1356
[28] Toussaint, A., Chapin, N., Brosse, S., et al. (2016) Global Functional Diversity of
Freshwater Fish Is Concentrated in the Neotropics While Functional Vulnerability
Is Widespread. Scientific Reports, 6, 122-125. https://doi.org/10.1038/srep22125
[29] Kang, B., Huang, X., Yan, Y., et al. (2018) Continental-Scale Analysis of Taxonomic
and Functional Fish Diversity in the Yangtze River. Global Ecology and Conserva-
tion, 15, e00442. https://doi.org/10.1016/j.gecco.2018.e00442
[30] Kuczynski, L., Cote, J., Toussaint, A., et al. (2018) Spatial Mismatch in Morphologi-
cal, Ecological and Phylogenetic Diversity in Historical and Contemporary Euro-
pean Freshwater Fish Faunas. Ecography, 41, 1665-1674.
https://doi.org/10.1111/ecog.03611
[31] Lamothe, K.A., Alofs, K.M., Jackson, D., et al. (2018) Functional Diversity and Re-
dundancy of Freshwater Fish Communities across Biogeographic and Environmen-
tal Gradients. Diversity and Distributions, 24, 1612-1626.
https://doi.org/10.1111/ddi.12812
[32] Lechêne, A., Lobry, J., Boët, P., et al. (2018) Change in Fish Functional Diversity
and Assembly in the Course of Tidal Marsh Restoration. PLoS ONE, 13, e0209025.
https://doi.org/10.1371/journal.pone.0209025
[33] Toussaint, A., Chapin, N., Beauchard, O., et al. (2018) Non-Natives Species Led to
Marked Shifts in Functional Diversity of the World Freshwater Fish Faunas. Ecolo-
gy Letters, 21, 1649-1659. https://doi.org/10.1111/ele.13141
[34] Dumay, O., Tari, P.S., Tomasini, J.A., et al. (2004) Functional Groups of Lagoon
Fish Species in Languedoc Roussillon, Southern France. Journal of Fish Biology, 64,
970-983. https://doi.org/10.1111/j.1095-8649.2004.00365.x
[35] Stuart-Smith, R.D., Bates, A.E., Lefcheck, J.S., et al. (2013) Integrating Abundance
and Functional Traits Reveals New Global Hotspots of Fish Diversity. Nature, 501,
539-542. https://doi.org/10.1038/nature12529
[36] Lefcheck, J.S., Innes-Gold, A.A., Brandl, S.J., et al. (2019) Tropical Fish Diversity
Enhances Coral Reef Functioning across Multiple Scales. Sciences Advances, 5,
eaav6420. https://doi.org/10.1126/sciadv.aav6420
[37] Pelayo-Villamil, P., Guisande, C., Manjarrés-Hernández, A., et al. (2018) Com-
pleteness of National Freshwater Fish Species Inventories around the World. Biodi-
versity and Conservation, 27, 3807-3817.
https://doi.org/10.1007/s10531-018-1630-y
[38] Pelayo-Villamil, P., Guisande, C., Vari, R.P., et al. (2015) Global Diversity Patterns
of Freshwater Fishes-Potential Victims of Their Own Success. D iversity and
Distributions, 21, 345-356. https://doi.org/10.1111/ddi.12271
[39] Pelayo-Villamil, P., Guisande, C., González-Vilas, L., et al. (2012) ModestR: Una
herramienta informática para el estudio de los ecosistemas acuáticos de Colombia.
Actualidades Biológicas, 34, 225-239.
[40] García-Roselló, E., Guisande, C., González-Dacosta, J., et al. (2013) ModestR: A
Software Tool for Managing and Analysing Species Distribution Map Databases.
Ecography, 36,102-1207. https://doi.org/10.1111/j.1600-0587.2013.00374.x
[41] García-Roselló, E., Guisande, C., Heine, J., et al. (2014) Using ModestR to Down-
load, Import and Clean Species Distribution Records. Methods in Ecology and
Evolution, 5, 703-713. https://doi.org/10.1111/2041-210X.12209
DOI: 10.4236/jgis.2021.131001 16 Journal of Geographic Information SystemC. Granado-Lorencio et al.
[42] García-Roselló, E., Guisande, C., Manjarrés-Hernández, A., et al. (2015) Can We
Derive Macroecological Patterns from Primary GBIF Data? Global Ecology and
Biogeography, 24, 335-347. https://doi.org/10.1111/geb.12260
[43] Guisande, C., Manjarrés-Hernández, A., Pelayo-Villamil, P., et al. (2010) IPez: An
Expert System for the Taxonomic Identification of Fishes Based on Machine Learn-
ing Techniques. Fisheries Research, 102, 240-247.
https://doi.org/10.1016/j.fishres.2009.12.003
[44] Verdin, K.L. and Verdin, J.P. (1999) A Topological System for Delineation and Co-
dification of Earth’s River Basins. Journal of Hydrology, 218, 1-12.
https://doi.org/10.1016/S0022-1694(99)00011-6
[45] Verdin, K.L. and Greenlee, S.K. (2016) HYDRO1k Documentation. US Geological
Survey [Online].
http://webgis.wr.usgs.gov/globalgis/metadata_qr/metadata/hydro1k.htm
[46] González-Vilas, L., Guisande, C., Vari, R.P., et al. (2016) Geospatial Data of Fresh-
water Habitats for Macroecological Studies: An Example with Freshwater Fishes.
International Journal of Geographical Information Science, 30, 126-141.
https://doi.org/10.1080/13658816.2015.1072629
[47] Manjarrés-Hernández, A.M., Guisande, C., García-Roselló, E., et al. (2018) A Pro-
cedure to Assess the Spatial Variability in the Importance of Abiotic Factors Affect-
ing Distributions: The Case of World Freshwater Fishes. Current Zoology, 64,
549-557. https://doi.org/10.1093/cz/zox063
[48] Guisande, C, Heine, J., García-Roselló, E., et al. (2017) DER: An Algorithm for
Comparing Species Diversity between Assemblages. Ecological Indicators, 81,
41-46. https://doi.org/10.1016/j.ecolind.2017.05.049
[49] Guisande C. (2018) Ecological Indicators. R Package Version. 1.4.
https://cran.r-project.org/web/packages/EcoIndR
[50] R Development Core Team (2020) A Language and Environment for Statistical
Computing. R Foundation for Statistical Computing, Vienna.
[51] Gaston, K.J. (1994) Rarity. Chapman and Hall, London.
https://doi.org/10.1007/978-94-011-0701-3
[52] Leroy, B., Petillon, J., Gallon, R., et al. (2012) Improving Occurrence-Based Rarity
Metrics in Conservation Studies by Including Multiple Rarity Cut-Off Points. Insect
Conservation and Diversity, 5, 159-168.
https://doi.org/10.1111/j.1752-4598.2011.00148.x
[53] Leroy, B., Canard, A. and Ysnel, F. (2013) Integrating Multiple Scales in Rarity As-
sessments of Invertebrate Taxa. Diversity and Distribution, 19, 794-803.
https://doi.org/10.1111/ddi.12040
[54] Warwick, R. and Clarke, K.R. (2001) Practical Measures of Marine Biodiversity
Based on Relatedness of Species. Oceanography Marine Biology, 39, 207-231.
[55] Villéger, S., Mason, N.W.H. and Mouillot, D. (2008) New Multidimensional Func-
tional Diversity Indices for a Multifaceted Framework in Functional Ecology.
Ecology, 89, 2290-2301. https://doi.org/10.1890/07-1206.1
[56] Buisson, L., Grenouillet, G., Villéger, S., et al. (2013) Toward a Loss of Functional
Diversity in Stream Fish Assemblages under Climate Change. Global Change Biol-
ogy, 19, 387-400. https://doi.org/10.1111/gcb.12056
[57] Guisande, C., Heine, J., González-Dacosta, J., et al. (2014) RWizard Software. Uni-
versity of Vigo, Vigo. http://www.ipez.es/RWizard
[58] Lobo, J.M., Hortal, J., Yela, J.L., et al. (2018) KnowBR: An Application to Map the
DOI: 10.4236/jgis.2021.131001 17 Journal of Geographic Information SystemC. Granado-Lorencio et al.
Geographical Variation of Survey Effort and Identify Well-Surveyed Areas from
Biodiversity Databases. Ecological Indicators, 91, 241-248.
https://doi.org/10.1016/j.ecolind.2018.03.077
[59] Guisande, C. and Lobo, J.M. (2019) Discriminating Well Surveyed Spatial Units
from Exhaustive Biodiversity Databases. R Package Version 2.0.
http://cran.r-project.org/web/packages/KnowBR
[60] Carmona, C., de Bello, F., Mason, N.W.H., et al. (2016) Traits without Borders: In-
tegrating Functional Diversity across Scales. Trends in Ecology and Evolution, 31,
382-394. https://doi.org/10.1016/j.tree.2016.02.003
[61] Leroy, B., Dias, M.S., Giraud, E., et al. (2019) Global Biogeographical Regions of
Freshwater Fish Species. Journal of Biogeography, 46, 2407-2419.
https://doi.org/10.1111/jbi.13674
[62] Dias, M.S., Oberdorff, T., Hugueny, B., et al. (2014) Global Imprint of Historical
Connectivity on Freshwater Fish Biodiversity. Ecology Letters, 17, 1130-1140.
https://doi.org/10.1111/ele.12319
[63] Drake, N.A., Blench, R.M., Armitage, S.J., et al. (2011) Ancient Watercourses and
Biogeography of the Sahara Explain the Peopling of the Desert. Proceedings of the
National Academy of Sciences of the United States of America, 108, 458-462.
https://doi.org/10.1073/pnas.1012231108
[64] Xing, Y., Zhang, C., Fan, E., et al. (2015) Freshwater Fishes of China: Species Rich-
ness, Endemism, Threatened Species and Conservation. Diversity and Distributions,
22, 358-370. https://doi.org/10.1111/ddi.12399
[65] Halpern, B.S. and Floeter, S.R. (2008) Functional Diversity Responses to Changing
Species Richness in Reef Fish Communities. Marine Ecology Progress Series, 364,
147-156. https://doi.org/10.3354/meps07553
[66] Villéger, S., Ramos Miranda, J., Flores Hernández, D., et al. (2010) Contrasting
Changes in Taxonomic vs. Functional Diversity of Tropical Fish Communities after
Habitat Degradation. Ecological Applications, 20, 1512-1522.
https://doi.org/10.1890/09-1310.1
[67] Winemiller, K.O., Fitzgerald, D.B., Bower, L.M., et al. (2015) Functional Traits,
Convergent Evolution and Periodic Tables of Niches. Ecology Letters, 18, 737-751.
https://doi.org/10.1111/ele.12462
[68] Schmera, D., Heino, J., Podani, J., et al. (2017) Functional Diversity: A Review of
Methodology and Current Knowledge in Freshwater Macroinvertebrate Research.
Hydrobiologia, 787, 27-44. https://doi.org/10.1007/s10750-016-2974-5
[69] Guillemont, N., Kulbicki, M., Chabanet, P., et al. (2011) Functional Redundancy
Patterns Reveal Non-Random Assembly Rules in a Species-Rich Marine Assembly.
PLoS ONE, 6, 226375. https://doi.org/10.1371/journal.pone.0026735
[70] Tilman, D. (1999) The Ecological Consequences of Changes in Biodiversity: A
Search for General Principles. Ecology, 80, 1455-1474.
https://doi.org/10.2307/176540
DOI: 10.4236/jgis.2021.131001 18 Journal of Geographic Information SystemYou can also read