Divided by Identity on the Left? Partisan Spillover and Identity Politics Alignment - De Gruyter
←
→
Page content transcription
If your browser does not render page correctly, please read the page content below

The Forum 2021; 19(2): 253–281

Willie Gin*
Divided by Identity on the Left? Partisan
Spillover and Identity Politics Alignment
https://doi.org/10.1515/for-2021-0017

Abstract: It has often been stated that in the United States the left tends to be less
united than the right on issues related to identity politics such as race, gender, and
religion. This article presents evidence that this asymmetry in partisan alignment over
identity politics is changing over time. Looking at various measures of public opinion
shows that the left’s agreement on issues related to identity politics has either caught
up with the right or that the gap is diminishing. The article considers various possible
explanations for unity on these issues – including personality distribution, party
homogeneity, and message infrastructure – and shows that partisan spillover in the
context of polarization helps explains the closing of the gap in unity between the right
and the left. In an era of polarization, Democratic affiliation induces warmer feeling
toward stigmatized coalition partners. Groups that may have joined the Democratic
party on a single group interest claim (race, gender, religion, class) will gradually move
toward greater acceptance of other group interest claims supported by the party. These
findings have implications for the oft-stated strategic claim that the left needs to focus
on class redistribution over identity politics if the left does not want to be fractured.

Keywords: asymmetric polarization, identity politics, partisan asymmetry, partisan
spillover

Research and popular perception suggest that the left in the United States is more
divided than the right on issues of race, gender, and religion – what many now
refer to as “identity politics.” For instance, the Democratic party has been called a
party of a “multiplicity of interests” (Acheson 1955, 25), "a coalition of diverse
overlapping minorities" (Axelrod 1972, 13), a “mosaic of interests” (Polsby 2009,
20), and a “pluralistic” party with “multiple power centers that compete” (Freeman
1986, 329). By contrast, the Republican party has been described as “bound
together much more by ideological agreement”; “much more likely to think more
or less alike about public policy” (Polsby 1983, 85; Polsby 2009, 20); and a “unitary
party” in which “activists are expected to be ‘good soldiers,’ and competing loy-
alties are frowned upon” (Freeman 1986, 329).

*Corresponding author: Willie Gin, Sonoma State University, Political Science, 1801 E. Cotati Ave,
Rohnert Park, CA 94928, USA, E-mail: willie.gin@sonoma.edu

254        W. Gin

     There have been several attempts to verify these observations about the
relative unity of the two parties. Mayer (1996, 73, 100–7) documented how Dem-
ocratic voters are less ideologically unified than Republicans on a variety of issues.
Grossman (2012, 81–2) found that, excluding business interests, liberal interest
groups are more scattered than conservative interest groups, with liberal single-
issue and ideological advocacy groups outnumbering conservative groups three to
one. Grossman and Hopkins (2016, ch. 2) marshal a variety of evidence to char-
acterize the Republican party as more ideological and the Democratic party as
more oriented toward rewarding particularistic group interests. More recently,
Mason and Wronski (2018, 267, 270) find party asymmetry in what they call social
sorting, with Republicans on average feeling closer to the groups typically asso-
ciated with the Republican party (Whites, Christians, and conservatives) compared
with how close Democrats feel to groups associated with the Democratic party
(Black, Hispanics, atheists, and liberals).
     This article focuses on divisions within the left and right at the mass level,
and uses the term identity politics (hereafter IP) alignment to describe the level
of agreement on race, gender, religious, and class issues. What has been the
trend in IP alignment on the right and left? Three theories – party homogeneity,
personality distribution, and conservative message infrastructure – predict
continued asymmetric IP alignment. The article proposes a mechanism, party
spillover, that predicts the left catching up to the right in IP alignment. The
empirical analysis makes two contributions. First, the article shows that on at
least some measures, the gap in IP alignment is decreasing, contrary to the
conventional view of the divided left. The second contribution of the paper is
demonstrating that partisan spillover helps account for this unexpected in-
crease in IP alignment on the left. These findings have implications for the oft-
stated strategic claim that the left needs to focus on class redistribution issues
over IP issues if the left does not want to be fractured.

1 Theories of Asymmetric IP Alignment
When it comes to analyzing the potential divisions within the left and the right in
the United States at the mass level, there is good reason to focus on IP alignment
rather than alignment on issues like taxes, the environment, or healthcare. On
issues not associated with IP, the left may actually be more united because of the
finding that on economic issues, the public tilts left (Drutman 2017). Mass public
opinion also tends to be operationally liberal but symbolically conservative (Ellis
and Stimson 2012), so it would be more likely for the left to be better aligned on
“operationally liberal” issues.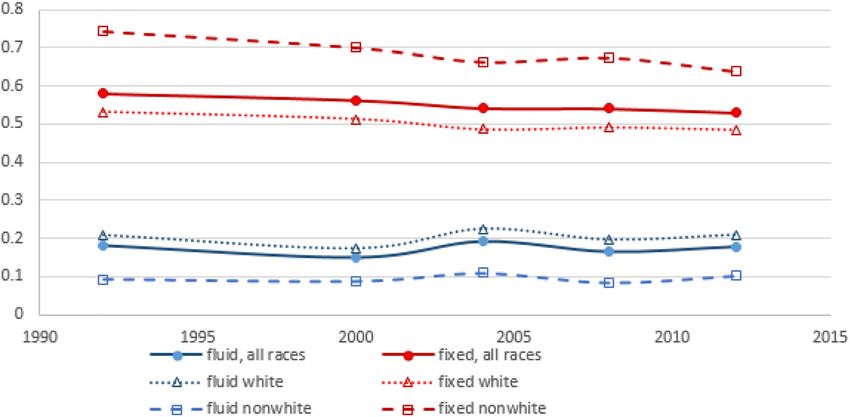
Partisan Spillover and Identity Politics Alignment   255

     The idea that the left is divided by IP is often found in popular discourse.
African American feminists associated with the Combahee River Collective in the
1970s (Combahee River Collective 1995) were one of the first to use the term IP. The
term originally meant highlighting specific forms of oppression that African
American women faced from multiple systems of power. IP called for attention to
group-specific disadvantages while also paying attention to more encompassing
systems of power that affect other groups (Collins 2019, 137–8). However, the
term’s use in popular discourse often contrasted a supposed “narrow” IP with a
supposedly more universalistic and inclusionary politics. On the right, this took
the form of IP opposing “color-blindness” and individualism (King and Smith
2011). On the left, works like Gitlin (1995) and Lilla (2017) argued that IP detracted
from either class politics or more general liberal ideals.
     Others have critiqued how contemporary portrayals of IP draw too much of a
distinction between the particular and universal, contrary to its original formulation
by African American feminists (Collins 2019, 97). Still, while IP theoretically calls for
identification both inside and outside one’s groups, there is reason to believe that
this is difficult to do in practice. While it has been sometimes theorized that groups
that face institutionalized disadvantage might be able to better empathize with other
groups’ history of disadvantage, research on this question has been mixed. Some
studies find greater identification among disadvantaged groups (Craig and Richeson
2012) while others find that prompting one group’s disadvantages might actually
stimulate a sense of zero-sum group conflict and less empathy for other disadvan-
taged groups (Craig and Richeson 2014; Craig et al. 2012).
     In short, there is a prominent, recurring narrative that the left is divided by IP,
buttressed by some of the research cited earlier (Mayer 1996; Grossman 2012; Gross-
man and Hopkins 2016; Mason and Wronski 2018). On the other hand, one might
wonder why the right is not similarly divided by IP, given that the right is composed of
different factions of evangelicals, pro-business conservatives, libertarians, tradi-
tionalists, pro-defense nationalists, and White nationalists. In the existing literature,
there are three likely candidates that predict asymmetric IP alignment between the
parties: party homogeneity, personality, and institutional messaging structure.
     One common explanation for differences in the unity of the left and the right is
that the Republican party is the more homogeneous party, particularly in regards to
race and religion (Galvin 2010, 8; Mayer 1996, 100–7; Mason and Wronski 2018, 270).
For instance in 2008, non-Hispanic Whites were roughly 90 percent of Republican
identifiers, compared to only about 60 percent of Democratic identifiers (Newport
2013). The Republican party is also more homogeneous in religion. Non-Christians
such as Jews, Muslims, Hindus, Buddhists, and nonbelievers skew heavily in favor
of the Democratic party, whereas Christians predominate in the Republican party
(Lipka 2016). The difference between the parties becomes starker when looking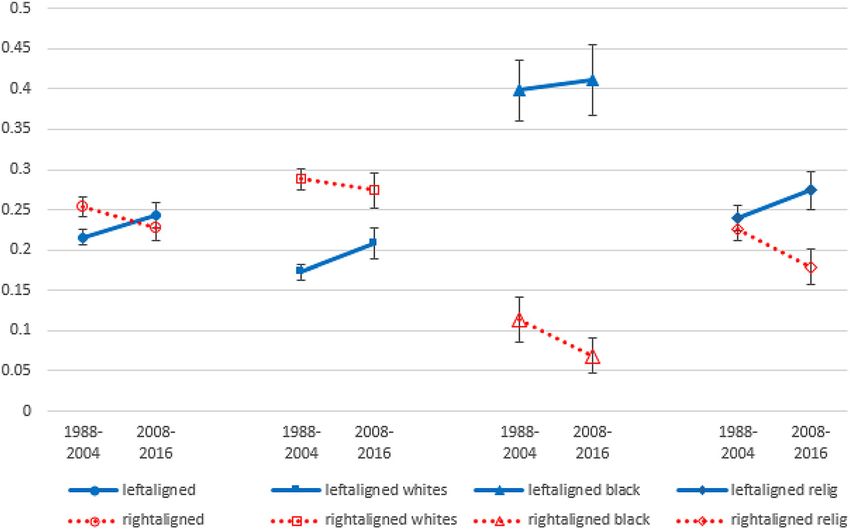
256         W. Gin

simultaneously at race and religion. About 73% of Republican identifiers are White
Christians, compared with 29% of Democratic identifiers (Ingraham 2017). Race and
religion are significant predictors of political attitudes, and they are simultaneously
connected with opinions on class and gender, since poverty is often associated with
race and gender (Gilens 1999, 67–79; Hancock 2004, ch. 2). Gender is also often
connected to religion through attitudes on abortion, contraception, and the role of
women in the household. Hence, one would expect a wider distribution of views on
IP in the party that is more racially and religiously diverse, making it harder for the
coalition to bridge those divides and come to agreement on a consistent ideology.
Racial minority groups and nonbelievers have continued to grow in the first two
decades of the 21st century, and these groups continue to strongly associate with the
Democratic party (Pew Research Center 2016, 7), so trends in demographic diversity
would predict continued asymmetric IP alignment today.
     A second explanation for asymmetric alignment could be personality distribu-
tion. A tendency for attitudes on race, gender, religion, and class to go together may
be a reflection of personality traits that predict attitudes towards outsiders, novelty,
normalcy, and/or hierarchy. For instance, supposing there is a personality type that
has a strong aversion against strangeness and the abnormal, this personality
orientation may be predisposed to similar political attitudes in race, religion, sexual
orientation, gender, and class. Outgroups can be racial (Blacks, Latinos, Asians),
religious (Jews, Muslims, atheists), sexual (gay and lesbian), gendered (feminists as
abnormal), or even expressed in terms of class, as the poor may be seen as a deviants
compared to the middle class, or because particular racial or religious minorities
may be overrepresented among the poor.
     Researchers have proposed a variety of potential personality types organized
around attitudes toward outsiders, novelty, normalcy, and hierarchy. Advocates of
contemporary “biopolitics research” (Faulkner et al. 2004; Aaroe, Petersen, and Arce-
neaux 2017) argue that orientations to outsiders stem from feelings of disgust selected
through evolution to avoid germs and disease. Hetherington and Weiler (2018) describe
what they call fixed versus fluid worldviews, with fixed worldviews preferring hierarchy
and order to manage potential threats emanating from those who break from racial,
gender, religious, or class norms (Hetherington and Weiler 2018, 17–18, 33–4, 38–55).
     Personality approaches could explain asymmetric IP alignment in the United
States. Hetherington and Weiler (2018, 18) report that 42 percent of the population
have a mostly fixed worldview while 32 percent of the population have a mostly fluid
worldview. They also report that those in the middle who are partially fixed and fluid
tend to have issue positions closer to the fixed (164–5). The greater proportion of the
population with fixed worldviews or sympathetic to that worldview may then
translate into a greater proportion of the population with simultaneous negative
views of racial and religious minorities, feminists, and the poor. Hetherington and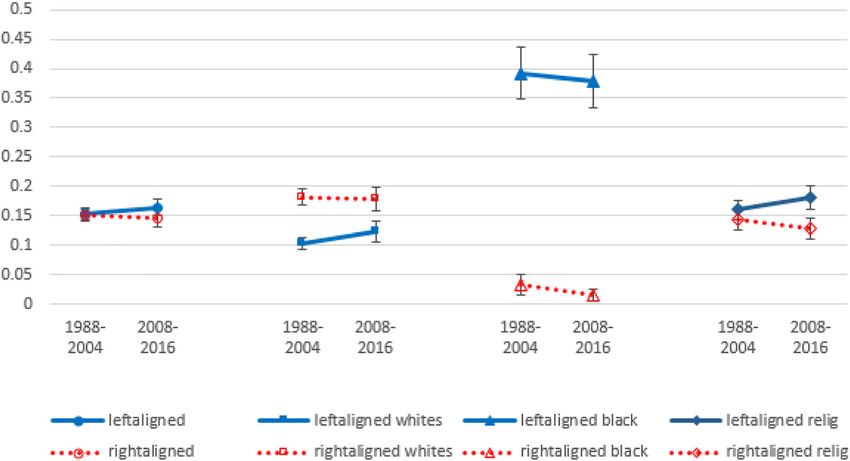
Partisan Spillover and Identity Politics Alignment    257

Weiler (2018, 23) note that during the Trump presidency fixed and fluid worldviews
have concentrated in the Republican and Democratic parties respectively to a much
greater degree than in the 1990s. Although the trend of the fluid identifying with the
Democratic party should help left IP alignment, the simultaneous trend of the fixed
moving into the Republican party, coupled with the numerical advantage of fixed
personalities, should still lead to asymmetry in IP alignment.
     A third explanation for asymmetrical IP alignment focuses on differences in the
institutional infrastructure for policy and idea entrepreneurship on the left and right.
It may be the case that organized institutional activists on the right have more
resources and are more centralized, thus allowing them to promote a much more
coherent ideological package than the left. Academics and left activists have noted a
disparity in institutional infrastructure for ideological development (Grossman and
Hopkins 2016, 75–102; Payne 2008, 13–4). The conservative message infrastructure
includes: think tanks; conservative journals; broadcast television and radio; legal
advocacy groups; the backing of billionaire family foundations; and organizations
to promote legislation across states (Payne 2008, 31–40).
     By contrast liberals may have a harder time uniting, in part because bridging
institutions like unions have been disappearing. Instead, the left has tended to
organize around single-interest groups (Grossman 2012, 81–2). Liberals have
attempted to organize broader progressive infrastructure to match this conservative
infrastructure, but these efforts appear to have fallen short. Comparing the Koch
network to the left-oriented Democracy Alliance, Skocpol (2016) found the De-
mocracy Alliance remains significantly weaker and less centralized. A comparison of
cross-state policy advocacy groups on the left and right shows that not only have the
networks on the right existed longer, they are also better funded and more centralized
(Hertel-Fernandez 2016, 461–5). Benkler, Farris and Roberts (2018, 54–6) look directly
at message dissemination on the left and right online, and their study shows that the
media system on the right is more concentrated and insular. Given this institutional
concentration, one might expect greater message discipline and unity on the right
than on the left. Better IP alignment on the right may simply reflect a media ecology in
which the right is exposed to more centralized and unified sources.

2 Toward Partisan Symmetry: Party Polarization
  and IP Polarization
While the above factors show why the right may be more united on IP issues, one
factor that may help IP alignment on the left catch up to that of the right is partisan
identity. Polarization has continually increased since the mid-20th century in
258         W. Gin

American politics, making party identity increasingly salient over time. Since party
identity is one of the fundamental group identities in the United States, there may
be a greater inclination of existing party members to match their issue positions
with their party’s positions and against the opposition party, leading to eventual
greater IP alignment on the left.
     An enduring tradition in public opinion sees group identities such as race,
gender, and religion as shaping public opinion (Green, Palmquist, and Schickler
2002, 4–5; Achen and Bartels 2016, 3, chs. 8–9). Partisan identity is also a signif-
icant group identity. Iyengar and Westwood (2014) for instance find that in judg-
ments of scholarship eligibility, partisan bias is actually stronger than racial bias.
Many studies show that partisan cues can shape in-group party members’ opinion
(Levendusky 2009; Lenz 2012; Druckman, Peterson, Slothuus 2013). If party elites
have become increasingly polarized and if voters rely on partisan cues to form their
opinions, then one would predict that as polarization increases, partisan voters
will shift their attitudes to match. In other words, partisan attachment “spills over”
into other facets of public opinion.
     This spillover effect has been documented in other dimensions. For instance,
Tesler (2016, chs. 4–5) has argued that racial biases can spill over into other issue
domains. Individuals hostile to Obama because of his race oppose other things
associated with Obama that have nothing to do with race, such as healthcare policy
or the breed of dog chosen by the Obamas as their family pet. This spillover effect
may also work in the reverse direction. Attachment to the Democratic party and/or
aversion to the Republican party may lead Democratic supporters to align their
attitudes on race to better match that of their party. As evidence of this effect,
several studies have documented that in recent years White Democrats have
become significantly racially liberalized (Engelhardt 2019; McElwee 2018; Gold-
berg 2019). Some studies have shown that party identification has contributed to
this change in racial attitudes on the left (Engelhardt 2020) and the effect may be
stronger on issues the public has not had time to form opinions, such as sanctuary
cities (Collingwood, O’Brien, and J. R. Tafoya 2020).
     Historically spillover within parties has not always happened. Gin (2017, 76–
82) has pointed out the example of the Catholic–Southerner coalition in the
Democratic party in the middle of the 20th century. Despite being committed to the
Democratic party, White southerners remained hostile to Catholics. One difference
between now and then is that polarization has deepened since the mid-20th cen-
tury, making ideological consistency within the parties more common. Party elites
and platforms are more well sorted in IP terms, with Democrats and Republicans
strongly associated with opposing positions on race (Carmines and Stimson 1989),
gender (Wolbrecht 2000), and religion (Margolis 2018). As the distance between
Partisan Spillover and Identity Politics Alignment   259

Democrats and Republicans increases, party positions should play a larger role in
individual’s stances on issues.
    The most straightforward way in which spillover can occur is through the cues
of party elites. A Democratic leader signals a position on race, gender, or sexual
orientation, and Democratic identifiers may be more likely to adopt that position.
Negative cues – i.e. defining oneself against the publicly declared stances of
outgroup party elites – may also be particularly effective in the United States, given
the constraint of the two-party system (Nicholson 2012). Cues can also come from
social movements (Gillion 2020), as movements like Black Lives Matters get
interpreted by the media, political entrepreneurs, and the mass public as part of a
larger story about the differences between Democrats and Republicans.
    With polarization, party spillover effects on race, gender, religion, and class
should increase the level of IP alignment. Adherents to the Democratic party may
have been initially attracted to the party by specific group-interest claims based
solely on either race, gender, class, or religion, as Grossman and Hopkins (2016)
have argued has been the main tendency of the left. Once identifying as Democrats,
however, the effect of polarization in increasing the salience of party identity may
lead those who initially sorted into the Democratic party on one or two group
interest claims to be persuaded to adopt positions supporting other group interest
claims – the party spillover effect as outlined above. This same process would have
less an effect on Republican IP alignment, since they may have already been
substantially aligned because of homogeneity, personality distribution, and
messaging infrastructure. Hence, polarization and the partisan spillover effect
may lead to the left catching up on IP alignment as time passes, in contrast to what
theories of asymmetrical IP alignment predict.

2.1 Study 1. What Is the Trend in IP Alignment in the Mass Public?

To look at IP alignment over time and test whether different explanations explain the
trend, I look at a variety of affective and policy measures. I first look at an affective
measure in the American National Election Studies (ANES) Cumulative File. The
ANES consistently asks a series of feeling thermometer questions related to a variety
of groups – Blacks, Hispanics, Asians, feminists, the poor, fundamentalists, gays,
Jews, Muslims, people on welfare, and illegal aliens. This captures affective attitudes
to groups on race, gender, religion, and class dimensions. The feeling thermometer
scores are scaled 0 to 100, with 50 explicitly defined as neutral. Anything over 50 is a
positive evaluation, while anything under 50 is a negative evaluation. In terms of IP
alignment, the following would count as IP alignment on the left: positive evalua-
tions for groups typically associated as Democratic constituents (Blacks, Hispanics,
260         W. Gin

Asians, feminists, Jews, Muslims, the poor, people on welfare, and illegal aliens) and
negative evaluations for constituent groups perceived as Republican (fundamen-
talists). The opposite would count for IP alignment on the right.
     The top section of Table 1 shows average feeling thermometer scores by Dem-
ocratic and Republican affiliation for the periods 1998 to 2006, and 2008 to 2016.
From 2008 to 2016, the average feeling thermometer for Blacks, Hispanics, Asians,
Jews, and poor people are well over 50 for both Democrats and Republicans. Looking
at just these thermometers, there would be no grounds for calling Democrats less
unified. Republicans are favorably rating groups that are not typically associated
with the Republican party, so if anything, it is Republicans who are more divided.
There are some thermometers in which there is a partisan split, with the average for
one party above 50 and the average for the other party below 50 in the expected
directions. These include the thermometers for feminists, fundamentalists, gays,
people on welfare, and Muslims. For feminists, gays, and people on welfare, the
Democratic distance from the neutral score of 50 is larger than the Republican
distance from 50 – that is, Democrats are warmer to these constituent groups than
Republicans are colder. Only for Muslims and fundamentalists might it be said that
Democrat “feeling” is less intense than Republican feeling, with Republican dis-
tance from 50 greater than Democratic distance from 50. The only thermometer that
is below 50 for both Democrats and Republicans is the thermometer for illegal aliens.
So only with respect to fundamentalists, Muslims, and illegal aliens could Demo-
crats be described as potentially lagging behind Republicans.
     Switching focus to change over time, the change in Democratic thermometer
scores over the two time periods is greater in the liberal direction than the change
in Republican thermometer scores in the conservative direction for all of the
thermometers except for Muslims and the two thermometers that deal with non-IP
groups (i.e. poor and environmentalists). The last two lines of the first part of
Table 1 show the average change by party for all thermometers except the gay and
environmentalist thermometers. I exclude the thermometer for gays since it may be
an outlier in that it has experienced the most dramatic positive change in the
liberal direction for both Democrats and Republicans over the past 30 years. I also
exclude the environmentalist thermometer from the average since it is not related
to IP. The summary shows that the change for Democrats in the liberal direction is
greater than for Republicans in the conservative direction, which is consistent with
partisan spillover leading to a trend of greater IP unity.
     As a harder test, I convert the thermometer ratings to z-scores to look at
dispersion around the average in each survey year. If the right is really more united
than the left, one would expect more extreme views in the tail of the distribution
associated with right-leaning opinion than the tail of the distribution associated with
left-leaning opinion. Looking at z-scores by year takes out of consideration
Partisan Spillover and Identity Politics Alignment 261
Table : Feeling thermometer average by party ID/z-score threshold and race, – and
–.
Feeling thermometer average by party ID
Whites only All races
to to Change to to Change
Black therm Dem . . . . . .
Rep . . . . . −.
Hispanic therm Dem . . .
Rep . . . . . .
Feminist therm Dem . . . . . .
Rep . . . . .
Fundamentalist Dem . −. . −.
Rep . . . . . .
Gay therm Dem . . .
Rep . . . . .
Poor therm Dem . . . . .
Rep . . .
Welfare therm Dem . . . . . .
Rep . . .
Muslim therm Dem . . . . −
Rep . . −. . . −.
Illegal alien therm Dem . . . . . .
Rep . . −. . . −.
Environmentalist Dem . . −. . −
Rep . −. . . −.
Avg dem change (excluding gay/env; flip sign on . .
fundamentalist therm)
Avg rep change (excluding gay/env; flip sign on −. −.
fundamentalist therm)
Thermometer average by z-score threshold of >. (left) &
262 W. Gin Table : (continued) Thermometer average by z-score threshold of >. (left) &
Partisan Spillover and Identity Politics Alignment            263

the right for most thermometers (the exceptions being Muslims, illegal aliens, and
fundamentalists). Looking at change over time also yields the same story as above.
Comparing 1988–2006 to 2008–2016, there is greater change on the left than the
right for most thermometers, the exceptions being Blacks, Muslims, and envi-
ronmentalists. The last two lines of Table 1 shows the average for change in all
thermometers in the left and right tails (again excluding the gay thermometer as an
outlier and the environmentalist thermometer as non-IP-related). This shows a
greater degree of change for the tail of the distribution associated with the left,
rather than the right.
      It still remains to be seen whether the left is aligned when looking at multiple
thermometers simultaneously. I select the thermometers for Blacks, Hispanics,
feminists, and the poor to look at simultaneously.1 An individual is IP aligned in a
given year if on at least three of the four thermometers they have a z-score at least
half a standard deviation in the liberal or conservative direction.2 For instance,
positive z-scores greater than 0.5 on the Black, Hispanic, feminist, and poor ther-
mometers would count as leaning liberal, and having a liberal opinion on at least
three of these four thermometer scores would count as IP alignment on the left. This
coding scheme gives a fairly easy interpretation to the resulting measure of those
coded as 1—percent of the population that is IP aligned either on the left and right.
      Pooling the data (Figure 1) allows a comparison of the trend in alignment before
and after Obama became president. From 1988 to 2004, alignment on the right ex-
ceeds alignment on the left looking either at all races or just Whites. This would seem
to confirm the standard narrative of a left divided by IP issues. However, from 2008 to
2016, left alignment overall is about the same as right alignment. Left alignment for
Whites lags behind the right, but the gap has diminished over time.
      These results complicate the narrative of a left divided by IP issues. On the left,
higher levels of alignment of Blacks (Figure 1) is counteracting the lower alignment
of Whites, so that overall differences between the left and right when all races are
considered together are minimal by the Obama and Trump years. There is still
some justification for calling the left more divided since the aggregate score con-
ceals the difference between Whites and Blacks on the left. This is a greater
problem for the left because Blacks are a much more substantial proportion of the
left than the right. By comparison, Figure 1 shows that the religious (those defined

1 I omitted religion because the thermometer scores for fundamentalists and gays would favor left
sorting here, but including an analysis of either gays or fundamentalists (Appendix 2, Supple-
mentary Figures 1 and 2) does not change the patterns described in this article. I also include in the
appendix an analysis of alignment based on blacks, feminists, and the two groups (people on
welfare, illegal aliens) for which the left might be more split (Supplementary Figure 3).
2 I use z-score as a harder test of alignment, since looking at alignment based on whether the
thermometer is above or below 50 would overwhelmingly favor liberal unity.
264 W. Gin
Figure 1: Aligned percentage: Black, feminist, Hispanic, poor thermometers (pooled, ANES).
as going to church at least once a month or more) on the right are slightly less
aligned than everyone on the right, but this difference is not nearly as large as the
difference between Blacks and Whites on the left. Still, the striking fact is that
alignment of Whites on the left is increasing over time, so that the gap with Whites
on the right has decreased.
These trends over time do not match up well with explanations of IP alignment
that predict continued asymmetry. The proportions of fixed and fluid personalities
in the population have not shifted significantly (see Appendix 2, Supplementary
Figure 4). The left has become more racially and religiously diverse as time has
passed. The left has also not caught up to the right in terms of message infra-
structure according to Skocpol (2016) and Hertel-Fernandez (2016). The trend here
also does not correspond to thermostatic effects. From 2008 to 2016, the entirety of
the Obama administration, one would expect public opinion to have swung
thermostatically against the liberal direction. The trend here is more consistent
with the view that increasing polarization and partisan spillover has prompted
higher levels of left alignment, especially among Whites on the left.
2.2 Study 2: Panel Analysis
Although the trend over time in the cross-sectional data is suggestive that partisan
identity is causing left IP alignment to catch up, I further test the idea thatPartisan Spillover and Identity Politics Alignment 265
partisanship has motivated increasing IP unity on the left by looking at the De-
mocracy Fund Views of the Electorate Research (VOTER) panel. The VOTER survey,
conducted online by YouGov, started in 2012 with a nationally representative
sample of adults. VOTER has re-polled these initial respondents, with 8000 re-
spondents recontacted in 2016 and 5000 in 2017. With the VOTER panel data, the
analysis below can look at the same individuals over time, see whether they are
becoming more aligned, and tease out the factors that explain why someone who is
initially unaligned in IP flips to aligned in the later time period.
I start with feeling thermometer measures in VOTER, then perform a second
analysis looking at policy attitude measures. For the feeling thermometers, I look
at z-scores as a harder test than just looking at the raw thermometer scores, since
the average on most feeling thermometers are above 50. Judging whether one is
left- or right-aligned by whether they are above or below 50 on the thermometer
would massively favor left alignment. Looking at the z-score, I am instead using
distance from the average as a measure of being on the left or right.
Figure 2a looks at the change in z-score on a variety of group feeling ther-
mometers from 2012 to 2017, broken down by party identification in 2012. Self-
identified Democrats in 2012 improved their z-scores five years later on feeling
thermometers for Blacks, Hispanics/Latinos, Asians, gays/lesbians, Muslims, and
Jews, while also feeling colder toward Christians. In comparison, both self-
identified Republicans and those with no party identification in 2012 saw decreases
five years later in their z-scores on feeling thermometers for groups thought of as
Democratic constituent groups.
To analyze IP alignment on multiple thermometers simultaneously, I look
at the subset of thermometers for Blacks, Latinos, gays/lesbians, and Muslims.
Unfortunately, the thermometer for feminists was not asked in 2012, but the four
thermometers used here do capture divisive IP issues related to race and reli-
gion in the contemporary era.3 As before, someone is on the left if their z-score
on an individual thermometer is greater than 0.5, and they are on the right if
their z-score is less than −0.5. A person is coded as aligned on the left if their
z-score is greater than 0.5 on at least three of these thermometers in a given
year. A person is coded as aligned on the right if their z-score is less than −0.5 on
at least three of the thermometers in a given year. Based on this measure, IP
alignment for self-identified Democrats and Republicans in 2012 is about the
same in 2012 and 2017 (see Figure 2b). In terms of change over time from 2012 to
3 I include the thermometer for gays in the analysis here since in this limited time frame, the scale
of improvement for gays was similar for other groups (Figure 2a), where in the analysis looking
from 1988 to 2016, the scale of improvement for gays was much bigger compared to other groups
and might have too favorably contributed to left sorting.266 W. Gin
a
Blacks
Hispanics/LaƟnos
Asians
Gays and Lesbians
Jews
Muslims
ChrisƟans (reverse coded, indicaƟng increase
in coldness)
-0.3 -0.25 -0.2 -0.15 -0.1 -0.05 0 0.05 0.1 0.15
Self idenƟfied Democrats in 2012
No party id, 2012
Self idenƟfied Republicans in 2012
b
0.6
0.5
0.4
0.3
0.2
0.1
0
2012 2017 2012 2017 2012 2017
Dem in 2012 Dem in 2012, white Dem in 2012, black
Rep in 2012 Rep in 2012, white Rep in 2012, black
Figure 2: (a) Mean change in z-score 2012 to 2017, feeling thermometers (VOTER data).
(b) Aligned percentage: Black, Hispanic, Muslim, gay thermometers (VOTER data).Partisan Spillover and Identity Politics Alignment 267
2017, the only group for which there is significant improvement in alignment is
White Democrats.
I employ a lagged regression to see which factors in 2012 are correlated with a
change in alignment in 2017. The binary dependent variable is whether or not one
is aligned on the left in 2017 in one regression (Table 2, column 1), and whether or
not one is aligned on the right in 2017 in a separate regression (Table 2, column 2).
Similar to Egan (2019), I include as an independent variable the value of alignment
on the left and right in 2012. The inclusion of this lagged variable means that the
regression can explain the change in alignment from 2012 to 2017 – that is, the
newly aligned and unaligned in 2017.
I then include other independent variables from 2012 to test for the possibilities
covered in the literature review section of this paper. I include variables for party and
ideology in 2012 to test my main hypothesis that party spillover leads to improve-
ments in alignment. I include racial dummies (African American, Latino, Asian, and
other), which is relevant to understanding how much racial homogeneity within
parties matters. Authoritarian/fixed personality is identified by the standard four
questions on child rearing as defined by Hetherington and Weiler (2016; see
Appendix for wording). Unfortunately, these questions were not asked in 2012, only
in 2016. However, since personality is supposed to be a stable trait, the value in 2016
should be close to its value in 2012 for the same individuals in a panel.
Potential exposure to conservative/liberal infrastructure is measured by a
variable indicating how closely the respondent follows and is aware of politics.
This variable should capture some exposure to conservative or liberal messaging.
The measure is overly broad, as other factors account for interest in politics, but
this fact makes the overall regression a more conservative test of whether party and
ideology matter. As further measures of the potential influence of messaging
infrastructure, I also include a measure of how interest in politics changed from
2012 to 2017, as well as a measure of Internet use in 2012, since the Internet may
expose the respondent to messages from political entrepreneurs.
Finally, I include control variables for gender, age, family income, and Church
attendance. In addition, I include a variable for change of income between 2012
and 2017, since more dire economic circumstances may enhance competition and
threat from out-group members.
The results of the logit regression are reported in Table 2. Column 1 looks at IP
alignment on the left, while column 2 looks at IP alignment on the right. Being a
Democrat in 2012 significantly leads to a greater probability of being aligned on the
left. Fluid personality is also statistically significant, though it does not have as large
an effect as party. Race and measures of exposure to messaging are not significant.
For someone who was not left aligned in 2012, the average marginal effect of being a
Democrat in 2012 contributes 11 percentage points to the probability of one becoming268 W. Gin
Table : Logit regression predicting newly IP aligned in and .
() () () ()
Alignleft Alignright Alignleft Alignright
Democrat .*** .***
(.) (.)
Liberal . .***
(.) (.)
Fluid .** .***
(.) (.)
Republican .* .***
(.) (.)
Conservative .* .**
(.) (.)
Fixed .*** .
(.) (.)
Interest in politics . −. . .***
(.) (.) (.) (.)
Change interest politics −. −.
– (.) (.)
Change interest politics . .***
– (.) (.)
Internet use −. . . −.
(.) (.) (.) (.)
Black . −. .*** −.*
(.) (.) (.) (.)
Latino . −. . −.
(.) (.) (.) (.)
Asian −.* . −. −.
(.) (.) (.) (.)
Other race . . .** .*
(.) (.) (.) (.)
Church attendance −. −.** −.** .
(.) (.) (.) (.)
Male . .** −. .
(.) (.) (.) (.)
Education . . .* −.*
(.) (.) (.) (.)
Age . . −.** .
(.) (.) (.) (.)
Family income (in . −.** −.* .**
$s) (.) (.) (.) (.)
Change family income .** −.
– (.) (.)Partisan Spillover and Identity Politics Alignment 269
Table : (continued)
() () () ()
Alignleft Alignright Alignleft Alignright
Change family income – −. −.
(.) (.)
Alignleft .*** .***
(.) (.)
Alignright .*** .***
(.) (.)
_Cons −.*** −.*** −.*** −.***
(.) (.) (.) (.)
N
Standard errors are in parentheses: *p270 W. Gin
position, and are combined to form one score ranging from 0 to 1 to measure
respondent’s attitudes on African American inequality (see appendix for wording
of the survey questions in this section).
On immigration VOTER asks whether illegal immigrants are a drain on
American society; whether there should be a path to citizenship for the undocu-
mented; and whether immigration to the United States should be more difficult.
The most liberal position was coded as 0, a neutral position as 0.5, and the most
conservative position as 1. Moderately liberal or moderately conservative positions
were coded as 0.25 and 0.75 when appropriate. These measures were combined to
form one measure on attitudes toward immigration.
For attitudes on class redistribution, VOTER asks whether respondents favor raising
taxes for those making over $200,000 and how much government regulation is desir-
able. Liberal responses were coded as 0, neutral responses as 0.5, and conservative
responses as 1. These scores were combined to form a measure of class redistribution.
Finally, VOTER asks whether respondents think abortion should be illegal in all
circumstances, some circumstances, or legal in all circumstances. The liberal po-
sition (legal in all circumstances) was coded as 0, neutral responses (some cir-
cumstances) as 0.5, and the conservative response (illegal in all circumstances) as 1.
From 2012 to 2016, the change in average scores on these four measures are shown
in Figure 3a. Attitudes for all party and non-party identifiers liberalized in relation to
African American racial resentment and immigrants, but self-identified Democrats in
2012 became relatively more liberal in their attitudes than non-Democrats. Abortion
also became more polarized, with Democrats becoming more liberal and Republicans
and nonparty identifiers moving in the opposite direction. Strikingly, it is only with the
one non-IP issue – taxation and government regulation – where both Democrats and
Republicans became less polarized. Self-identified Democrats became slightly more
conservative, while all others became slightly more liberal, contrary to the notion that
class redistribution issues would be more likely to unite the left.
To look at the measures simultaneously, I create a dummy variable coding
someone as left aligned in a given year if their scores on racial resentment,
immigration, class redistribution, and abortion are below 0.5 for at least three of
the measures. I create another dummy variable coding someone as right aligned in
a given year if their answers are above 0.5 on at least three of the measures. As seen
in Figure 3b, those who self-identified as Republicans were better aligned in 2012
compared to Democrats, consistent with party asymmetry theories. By 2016 how-
ever this asymmetry in alignment disappears. Both White and African American
Democrats improved their alignment score in 2016 compared to 2012, allowing
Democrats to catch up to Republicans in alignment.
As before I run a logistic regression to see which factors predict left and right IP
alignment in 2016. For this analysis, I use the same independent variables in thePartisan Spillover and Identity Politics Alignment 271
a
African American inequality
ImmigraƟon
AborƟon
TaxaƟon and govt regulaƟon
-0.04 -0.02 0 0.02 0.04 0.06 0.08 0.1
Self idenƟfied Democrats in 2012
No party id, 2012
Self idenƟfied Republicans in 2012
b
0.9
0.8
0.7
0.6
0.5
0.4
0.3
0.2
0.1
0
2012 2016 2012 2016 2012 2016
Dem in 2012 Dem in 2012, white Dem in 2012, black
Rep in 2012 Rep in 2012, white Rep in 2012, black
Figure 3: (a) Attitude change in liberal direction, 2012 to 2016: African Americans, immigration,
abortion tax/regulation (VOTER data).
(b) Aligned percentage: Black inequality, immigration, tax/regulation, abortion (VOTER data).272 W. Gin
regression for the thermometer scores above. The results are reported in Table 2,
columns 3 and 4. Both Democratic and liberal identification in 2012 are signifi-
cantly associated with a higher probability of being left aligned in 2016. African
American and fluid personality are also significantly associated with left alignment
in the expected directions, while none of the variables potentially associated with
message infrastructure are significant. If one was not left aligned in 2012, the
average effects margin for being a Democrat in 2012 is 17 percentage points to the
predicted probability of being newly left aligned in 2016. The average effects
margin for being a liberal in 2012 is 16 percentage points to the probability of being
newly left aligned in 2016.
On the right, party identification and conservative ideology are significant in the
expected direction. Consistent with the view that better right infrastructure may
contribute to IP alignment, political interest is positively associated with right align-
ment. Being Black was negatively associated, as expected, while fixed personality was
not associated with right alignment. The average effects margin of being a Republican
in 2012 is 9 percentage points to the probability of being newly right aligned in 2016;
the average effects margin for being conservative in 2012 is 5 percentage points.
In summary, the second panel analysis shows that prior party identification
leads to better IP alignment on both sides of the political spectrum, but with a
greater effect for Democrats. Fluid personality also contributed to better alignment
on the left, but Democratic affiliation exerts an independent effect, and this effect
is stronger than fluid personality. Both panel analyses, with different specifica-
tions of IP alignment, show evidence for the partisan spillover hypothesis. Con-
trolling for other factors, Democratic partisanship is associated with an increase IP
alignment for the same individuals at a later time period.
3 Discussion
The conventional narrative is that the left is more divided than the right, partic-
ularly on issues related to IP rather than class redistribution. This article has found
some evidence that this was true prior to the Obama years. Study 1 found that
Whites on the left were more divided than Whites on the right in IP alignment prior
to Obama. Over time, however, this gap is decreasing. In the three measures of IP
alignment in this paper (Figures 1, 2b and 3b), the White left’s IP alignment
increased over time, so that the gap with the right either decreases or disappears.
When all races are included in the analysis, overall IP alignment of the left matches
or exceeds that of the right in the contemporary period for all measures of IP
alignment in this paper.Partisan Spillover and Identity Politics Alignment 273
Previous findings of asymmetry may differ from the findings here because they
are looking at different measures. Mason and Wronski (2018), for instance, find
partisan asymmetry when asking Democrats and Republicans how close they feel
to Whites, Christians, conservatives, Blacks, Hispanics, atheists, and liberals. They
find Republicans on average feeling closer to their constituent groups (Whites,
Christians, and conservatives) and more distant to nonconstituent groups (Blacks,
Hispanics, atheists, and liberals) compared with Democrats feeling closer to
constituent groups (Blacks, Hispanics, atheists) and distant to nonconstituent
groups (Whites, Christians, and conservatives). This affective measure was
captured by two separate surveys in 2013 and 2016, with different questions in each
of those surveys. The asymmetry in Mason and Wronski’s measure is consistent
with declining asymmetry in the measures reported in this article. Not feeling close
to a group in one’s coalition can still be consistent with overall positive feeling
toward a constituent group and support for policies that benefit that constituent
group. It may make sense that Whites on the left may not feel close to African
Americans because of African Americans’ distinct history and experience with
institutionalized discrimination. One would actually expect that recognition of this
difference would lead to support for African American policy goals. In addition, it
is possible that the sense of closeness of those on the left to constituent groups
could be changing over time. Perhaps future iterations of the survey questions
used by Mason and Wronski may find this trend.
Some of Grossman and Hopkins’ (2016) evidence for partisan asymmetry looks
at the composition of liberals and conservatives within each party and attitudes
about party unity. For instance, Grossman and Hopkins (2016, 29–31) noted that in
2012 Republican party identifiers are much more united in considering themselves
ideologically as “conservative,” compared with Democratic party identifiers being
relatively less likely to consider themselves “liberal.” Grossman and Hopkins do not
look directly at evaluations of the subgroup identities affiliated within the coalitions
of the left and right, or the policies associated with those subgroups, which is the
evidence considered in this paper. Why might there still be partisan disparity in
embracing liberal/conservative identity, but not in evaluations of particular groups
and policies associated with those subgroups within each party’s coalition? The
difference may reflect a well known paradox in public opinion. As other scholars
have noted, American public opinion may be “symbolically conservative” but
“operationally liberal” (Ellis and Stimson 2012). That is, more of the public is willing
to agree with specific liberal issue positions but still be reluctant to label themselves
as “liberal.” The fact that individual attitude positions on race, gender, class, and
religion may be moving toward greater unity but that the left side of public opinion
still is reluctant to identify itself as “liberal” may be a reproduction of the observed
distinction between operational and symbolic political identification.274 W. Gin
The second contribution of this paper is in showing that partisan affiliation on
the left plays a role in left IP alignment catching up to the right. Both panel analyses
confirm the importance of prior Democratic affiliation to higher levels of IP align-
ment, with a greater effect of party on the left compared with the right. This evidence
supports the hypothesis that the left can catch up with the right in IP alignment
through a process of partisan spillover. In a context of severe polarization, partisans
who initially may agree with the party only on a few of its IP stances will over time be
more inclined to adopt the left’s positions on more of its IP stances.
Recent scholarship has emphasized the necessity of looking at how multiple
group identity positions stack on top of each in explaining political behavior
(Mason and Wronski 2018). This article contributes to that agenda by considering
simultaneous combinations of group identity positions that have been previously
neglected. One limitation of this study is that it has looked at only a sample of these
potential combinations of IP alignment. I have tried to select “hard cases,” since
testing out all possible combinations of alignment increases factorially with each
new identity position added to the analysis. In some cases, my measures may not
have adequately captured all dimensions of attitudes on race, gender, class, and
religion. Other aspects of religious conflict such as transgender rights may be
increasing in importance in the contemporary culture wars. Another gap is that in
the panel studies, I could not include attitudes on gender in the analysis of
alignment. Future studies of IP alignment may include other and more complete
measures of attitude positions on race, gender, religion, and class, or add new
dimensions. For now, however, the agreement of measures looking at a variety of
combinations of IP alignment, both with cross-sectional and panel data, confirms
in these specific cases the two major findings – decline of asymmetric IP alignment
and partisan spillover contributing to this decline.
One potential implication of these findings is that polarization can contribute to
raising the status of a group’s coalition partners through party spillover. The existing
literature on polarization tends to emphasize its negative effects, such as gridlock
and extremism. The existing literature on minority political incorporation has also
often been pessimistic. Frymer (1999) for instance suggests that African American
votes are taken for granted in the Democratic party, making the party ineffective in
transforming racial attitudes. By contrast, the evidence here suggests that polari-
zation and party identification is making the left overall more sympathetic to the
racial, ethnic, religious, and gender diversity of its constituent coalition partners.
These findings suggest that the left does not have to focus solely on class redistri-
bution issues to unify support among Democrats. Over time, polarization and
partisanship has contributed to the left increasingly agreeing on IP issues.Partisan Spillover and Identity Politics Alignment 275 APPENDIX 1: Question Wording from VOTER VOTER, 2012 to 2017 Racial Resentment race_deservemore_2016, race_deservemore_baseline: “Over the past few years, blacks have gotten less than they deserve” race_overcome_2016, race_overcome_baseline: “Irish, Italian, Jewish and many other minorities overcame prejudice and worked their way up. Blacks should do the same without any special favors” race_tryharder_2016, race_tryharder_baseline: “It’s really a matter of some people not trying hard enough; if blacks would only try harder they could be just as well off as whites” race_slave_2016, race_slave_baseline: “Generations of slavery and discrimination have created conditions that make it difficult for blacks to work their way out of the lower class.” Potential answers for all four questions: (strongly agree/agree/don’t know/ disagree/strongly disagree). Undocumented Migration immi_contribution_2016, immi_contribution_baseline: “Overall, do you think illegal immigrants make a contribution to American society or are a drain?” (mostly make a contribution/neither/mostly a drain/not sure) immi_naturalize_2016, immi_naturalize_baseline: “Do you favor or oppose providing a way for illegal immigrants already in the United States to become U.S. citizens?” (favor/oppose/not sure) immi_makedifficult_2016, immi_makedifficult_baseline: “Do you think it should be easier or harder for foreigners to immigrate to the U.S. legally than it is currently?” (much easier/slightly easier/no change/slightly harder/much harder/ not sure). Class Attitudes taxdoug_2016, taxwealth_baseline: “Do you favor raising taxes on families with incomes over $200,000” (yes/no/don’t know) govt_reg_2016, govt_reg_baseline: “Do you think there is too much or too little regulation of business.” (too much/about the right amount/too little/don’t know)
276         W. Gin

Religion

abortview3_2016, abortview3_baseline: “Do you think abortion should be legal in
all cases; legal/illegal in some cases; illegal in all cases; don’t know.”

Authoritarian/fixed personality

“Which do you think is more important for a child to have?”
SOCIAL_CONFORMITY_1_2016: independence/respect for elders
SOCIAL_CONFORMITY_2_2016: curiosity/good manners
SOCIAL_CONFORMITY_3_2016: obedience/self reliance
SOCIAL_CONFORMITY_4_2016: considerate/well behaved
Fixed answers: respect for elders; good manners; obedience; well behaved.
Respondent gets one point for each fixed answer, 0 for fluid answer. A fixed
personality is someone who has a cumulative score of 3 or higher; fluid if someone
has a cumulative score of 1 or lower.

Exposure to conservative/liberal infrastructure

newsint_2016, newsint2_baseline: “Some people seem to follow what's going on in
government and public affairs most of the time, whether there's an election going
on or not. Others aren't that interested. Would you say you follow what's going on
in government and public affairs …” (most of the time/some of the time/only now
and then/hardly at all/don’t know)

Measure of how interest in politics changed from 2012 to 2017

Value of political interest in 2016 minus political interest in 2012.

Measure of Internet use in 2012

“How often do you use the Internet…”
daily_intuse_home_baseline: at home
daily_intuse_work_baseline: at work
daily_intuse_else_baseline: somewhere else
daily_intuse_mobile_baseline: from a mobile wireless device
Answers: (More than 6 hours per day/3-6 hours per day/1-2 hours per day/Less
than one hour per day)
Aggregate measure is averaged across all four questions (1=less than one hour a
day, 4=more than 6 hours a day).
Partisan Spillover and Identity Politics Alignment      277

APPENDIX 2: Supplementary Figures

Supplementary Figure 1: Aligned Percentages Using Black, Feminist, Fundamentalist, and Poor
Thermometers (ANES, pooled pre- and post-Obama).

Supplementary Figure 2: Aligned Percentages Using Black, Feminist, Gay, and Poor
Thermometers (ANES, pooled pre-and post-Obama).
278          W. Gin

Supplementary Figure 3: Aligned Percentages Using Black, Feminist, People on Welfare, and
Illegal Alien Thermometers (ANES, pooled pre- and post-Obama).

Supplementary Figure 4: Fixed and Fluid Proportions of Population, ANES Cumulative File.

References
Aaroe, L., M. B. Petersen, and K. Arceneaux. 2017. “The Behavioral Immune System Shapes
    Political Intuitions: Why and How Individual Differences in Disgust Sensitivity Underlie
    Opposition to Immigration.” American Political Science Review 111 (2): 277–94.
Achen, C. H., and L. M. Bartels. 2016. Democracy for Realists: Why Elections Do Not Produce
    Responsive Government. Princeton: Princeton University Press.
You can also read