Do Male and Female Legislators Have Different Twitter Communication Styles?
←
→
Page content transcription
If your browser does not render page correctly, please read the page content below
State Politics & Policy Quarterly (2023), 23: 2, 117–139
            doi:10.1017/spq.2022.16

            ORIGINAL ARTICLE

            Do Male and Female Legislators Have Different
            Twitter Communication Styles?
            Daniel M. Butler1          , Thad Kousser2          and Stan Oklobdzija3
            1
             Department of Political Science, Washington University in St. Louis, St. Louis, MO
            2
             Department of Political Science, University of California, San Diego, La Jolla, CA, USA
            3
             School of Public Policy, University of California, Riverside, Riverside, CA, USA
            Corresponding author: Thad Kousser, email: tkousser@ucsd.edu

            (Received 12 February 2021; revised 31 August 2021; accepted 22 September 2021)

            Abstract
            Communication is a fundamental step in the process of political representation, and an
            influential stream of research hypothesizes that male and female politicians talk to their
            constituents in very different ways. To build the broad dataset necessary for this analysis, we
            harness the massive trove of communication by American politicians through Twitter. We adopt
            a supervised learning approach that begins with the hand coding of over 10,000 tweets and then
            use these to train machine learning algorithms to categorize the full corpus of over three million
            tweets sent by the lower house state legislators who were serving in the summer of 2017. Our
            results provide insights into politicians’ behavior and the consequence of women’s underrepre-
            sentation on what voters learn about legislative activity.

            Keywords: state legislators; gender and Twitter; constituent communication

            Elected officials’ communication efforts are an important part of representation
            (Fenno 1977; Grimmer 2013). Historically, traditional media outlets have been a
            major way that politicians have reached their constituents. However, traditional
            media outlets have demonstrated bias against women, making it harder for them to
            reach voters (Baitinger 2015; Heldman, Carroll, and Olson 2005; Kahn 1992, 1994).
            This poses a challenge for women in politics; they need to reach voters but face
            obstacles in utilizing a primary avenue, traditional media outlets, for doing so. The
            rise of Twitter and other social media tools represents one way that women may be
            able to overcome bias in media coverage by allowing politicians to circumvent
            traditional media and directly reach voters. In this paper, we test whether women
            state legislators are more likely to use Twitter. We also explore whether gender
            predicts how politicians communicate with the public through Twitter.

            © The Author(s), 2023. Published by Cambridge University Press and State Politics & Policy Quarterly. This is an Open
            Access article, distributed under the terms of the Creative Commons Attribution licence (http://creativecommons.org/
            licenses/by/4.0), which permits unrestricted re-use, distribution and reproduction, provided the original article is properly
            cited.

https://doi.org/10.1017/spq.2022.16 Published online by Cambridge University Press
118 Dan Butler et al.
We evaluate several hypotheses to learn about the differences between men and
women. Some of these hypotheses tell us about what motivates politicians when they
think about their election prospects. For example, previous work has argued that
female politicians have strong incentives to portray themselves as conservative in
order to counteract the stereotype that they are more liberal than their male,
co-partisan colleagues (Koch 2000). Another stream of research shows that women
work harder in political office (Kurtz et al. 2006), speak more in the legislature
(Pearson and Dancey 2011), put more effort into their constituency service
(Thomsen and Sanders 2020), and produce more legislation (Anzia and Berry
2011; Volden, Wiseman, and Wittmer 2013), suggesting that gender may affect
how much effort state legislators will put into the time-consuming task of social
media communication.
Other hypotheses have important implications for levels of descriptive represen-
tation. Previous work has found that politicians’ communications can bias the
information environment for voters. For example, Grimmer (2013) finds that
politicians with more extreme preferences are more likely to communicate about
policy issues and moderate politicians are more likely to discuss nonpolicy-related
funding that they secure for their district. The differences in how these groups
communicate allow extremist views to dominate the public policy debate. In a similar
way, if men and women communicate differently, this has implications for what
voters hear because women are underrepresented in office. Previous work has argued
that women tend to work more on issues like education and health care (Foerstel and
Foerstel 1996; Reingold 1992; Saint-Germain 1989; Swers 1998, 2002; Thomas 1994;
Thomas and Welch 1991). If women also discuss these issues more, then electing
more women will lead voters to hear and learn more about these issues. We test
whether gender predicts how much legislators communicate on these issues.
To build the broad dataset necessary to undertake this analysis, we harness the
massive trove of communication by American politicians through Twitter. Just as it
has become a highly visible mode of political discourse in national politics (Garofoli
2018), social media is now one of the primary modes of political communication for
state legislators. As we show, a majority of members of state lower houses have public
Twitter handles, with the average lawmaker tweeting over 1,000 times. Together, the
lower house state legislators we study produced over three million tweets in our
period of study from October 2015 to July 2018.
This wealth of data presents both an opportunity and a challenge for state politics
scholars. Lawmakers in statehouses all across the nation are speaking via the same
medium, and doing so both during campaign seasons and while they are governing.
Holding the medium constant, scholars can study what they have to say before,
during, and after elections, whether the electoral rules under which they run affect
their ideological positioning, whether citizen lawmakers speak differently from those
in professional legislatures, or whether polarized statehouses produced more negative
discourse. With user engagement data, scholars can determine what forms of political
communication followers are most apt to like or retweet and whether this varies by
state and party. But in order to answer such questions, researchers must make sense
of a mountain of data (for review of prior work, see Jungherr 2016; Vergeer 2015).
The modern tools of machine learning can aid in the task of classifying the topics,
tone, and content of the enormous amount of data that state legislators are producing
every day on Twitter. Machine learning techniques for text analysis can be divided
into two approaches. In the first, “unsupervised learning,” researchers mine data for
https://doi.org/10.1017/spq.2022.16 Published online by Cambridge University PressState Politics & Policy Quarterly 119
attributes, such as the topics that cluster together, and then attribute meaning to the
output of these algorithms. We adopt the second approach, “supervised learning,” a
hybrid between qualitative and quantitative techniques that begins by applying
human judgment to code texts and then uses these codings to train machine learning
algorithms (see Grimmer and Stewart 2013; Peterson and Spirling 2018). Only after
testing how precisely the algorithms can replicate human codings, and ensuring
sufficient accuracy, do we move onto the stage of classifying the full set of state
political tweets. This approach, which we detail below, has been used to study political
tweets in gubernatorial elections by McGregor et al. (2016), in the Australian
Parliament by Kousser (2019), and for US presidential candidates by Kousser and
Oklobdzija (2018). Here, we apply it to state legislators, producing the largest set of
classified tweets, including 3,580,727 spanning 49 distinct political systems, that we
have seen in the literature.
Four main findings emerge from our analysis. First, women communicate
more than men. They are more likely to have Twitter accounts and to use them.
Second, in contrast to previous work, we find that female legislators’ tweets have
a more positive tone than male legislators’ tweets. Third, women do discuss
women’s issues more than their male counterparts, tweeting about both educa-
tion policy and about health care policy more often. Fourth, gender does not
appear to predict the ideological content of tweets after we control for legislators’
roll call records.
In what follows, we first draw hypotheses about gender and legislator communi-
cation from the previous literature. We then describe and validate our original dataset
and use it to test the hypotheses we lay out. We summarize the findings and their
implications in the conclusion.
Theories about Gender and Social Media Communication
Allocating Resources to Twitter Communication
Before politicians decide what to tweet, they must first decide whether they will tweet
at all and how often they will do so. This choice is a strategic choice because
committing to establishing a social media presence requires a significant investment
of time. To study the “tweet styles” of Australian legislators, Kousser (2019) draws
upon Fenno’s (1977) classic work on the home styles adopted by members of
Congress in their districts. Kousser makes an analogy between Fenno’s concept of
the allocation of resources that representatives devote to connecting with their
districts and the allocation of effort that today’s lawmakers devote to connecting
through social media.
While tweeting does not require the pecuniary investments that are necessary to
set up and staff a district office or to fly home to meet with constituents, social
media communication taxes a lawmaker’s most vital resource: time. According to
Fenno (1977, 890), “Of all the resources available to the House member, the
scarcest and most precious one, which dwarfs all others in posing critical allocative
dilemmas, is his time.” Tweeting consistently requires a significant investment of
time and attention from lawmakers. The price of this investment is magnified
because most state legislators typically author their own Twitter feeds. They must
do so while still fulfilling a host of other job commitments. Kurtz et al.’s (2006)
survey, conducted long before social media added yet another demand to the busy
https://doi.org/10.1017/spq.2022.16 Published online by Cambridge University Press120 Dan Butler et al.
lives of state legislators, demonstrates the immense time commitment required by
serving in a statehouse, even one that pays a small salary and is considered a part-
time body.
We argue that allocating time toward tweeting is a costly activity whether the
lawmaker communicates directly or indirectly to constituents.1 How should a
lawmaker’s gender impact this allocational decision? We expect that female legisla-
tors will be more likely to establish a social media presence—both by creating a public
Twitter account and by tweeting more often —than male legislators. There are a few
reasons this might occur.
First, electoral discrimination might lead to “sex-based selection.”2 Anzia and
Berry (2011) argue that “if voters discriminate against female candidates, only the
most talented, hardest working female candidates will win elections” (478; see also
Fulton 2012, 2014; Pearson and McGhee 2013). Consistent with this argument, Anzia
and Berry (2011) find that female members of Congress in fact outperform men when
it comes to securing district funding and sponsoring and co-sponsoring legislation
(see also Volden et al. 2013). If this same sex-based selection mechanism operates in
state legislatures, we should expect female lawmakers to work harder when it comes
to social media communication.
Second, women in state politics may be more motivated to devote time to tweeting
because they are simply responding to the demands that constituents are making of
them. In a field experiment conducted in collaboration with state legislators, Butler
et al. (2020) find that when men and women legislators make the same outreach to
constituents, constituents are more likely to ask women legislators to do more work.
Legislators are motivated by a desire to win reelection and so craft their homestyles in
order to please voters. If constituents are asking more of women, women may in turn
do more in order to be responsive. Although many studies show that female
candidates perform very well in general elections (Burrell 1994; Fox 2006; Newman
1994; Seltzer, Newman, and Leighton 1997), this may be because they are doing more
to meet voter demands rather than because voters are not demanding more of them.
Third, traditional media outlets might be biased against women (Baitinger 2015;
Heldman, Carroll, and Olson 2005; Kahn 1992, 1994). Women legislators might
prefer to reach their constituents through traditional news outlets but prior studies
reveal that they are simply not be covered at the same rates as men (Heldman, Carroll,
and Olson 2005; Kahn 1992). If they face obstacles to reaching voters through
traditional news outlets, women may get around this issue by using Twitter to
directly reach out to voters. Twitter thus allows them to circumvent the agenda
power of media and communicate to voters on their own terms. While this is an
advantage for both men and women, the gender bias in the media should make this a
relatively more attractive option for women, leading to greater uptake of Twitter
among female legislators.
1
When state politicians tweet, they are likely speaking directly to their immediate audience of followers but
also indirectly others in their communities. Statehouse journalists increasingly cover tweets, and followers
share tweets, either digitally or physically, through their social networks. Rosenstiel et al. (2015) show that a
majority of non-Twitter users have seen tweets; they are exposed to them primarily on television, through
friends, and in newspaper articles.
2
This is a disputed position in the literature, with many studies finding that women candidates are not
discriminated against in elections (see reviews in Brooks 2013; Hayes and Lawless 2016; Lawless 2015;
Thomsen 2020).
https://doi.org/10.1017/spq.2022.16 Published online by Cambridge University PressState Politics & Policy Quarterly 121
Whatever mechanism is at work, we predict that female legislators will work
harder than men to establish a social media presence. If this is true, it will be
consistent with Kurtz et al.’s (2006, 332) finding that women in state legislators
“devote an additional 7 percent of a full-time job to their legislative work compared
with men.” It will also fit with Evans and Clark’s (2016) finding that female
candidates tweeted more often than male candidates in the 2012 congressional
elections and Thomsen and Sanders’ (2020) study showing that women put more
effort into their constituency service. In the social media realm, we set forth two
empirical hypotheses to test the idea that female state lawmakers put forth more effort
in this realm than their male counterparts.
Hypothesis 1: Compared to men, female state lawmakers will be more likely to
establish a public Twitter account.
Hypothesis 2: Compared to men, female state lawmakers will tweet with greater
frequency.
Sentiment
Prior research has tested whether gender predicts how negative politicians are in their
public communications (e.g., Evans and Clark 2016). Gender stereotypes are a reason
why gender might be correlated with the tone of communication. Society stereotypes
women as being more helpful and kind and men as more aggressive and forceful
(Fridkin and Kenny 2009; Huddy and Terkildsen 1993). If voters hold these stereo-
types, this can shape what voters expect from them and how they respond to the tone
of politicians’ communications.
The effect of legislators’ tone on voter evaluations is unclear. Some scholars
conclude that voters punish women when they act in ways that are counter to existing
stereotypes (e.g., Kahn 1996). Yet others conclude that taking a more negative tone
helps women because it challenges those stereotypes (Lau and Pomper 2004).
In looking at social media, Evans et al. (2014) and Evans and Clark (2016) find that
women are more likely to send more negative attack tweets (cf., Parmelee and Bichard
2012). Evans and Clark (2016) also find that the number of negative tweets (coming
from both men and women) increases with the number of women in the race. One
reason that women may be negative in their tone is that they are more likely to be
attacked (Lazarus and Steigerwalt 2018). This may lead them to defend themselves
with tweets that have a more negative tone because they are trying to deal with a more
hostile political environment. On the other hand, women may feel more pressure
regarding reelection (Krook 2020), leading them to try to win over constituents using
a more positive tone in their tweets. We test whether this relationship identified at
other levels of office holds among state legislators.
Hypothesis 3: Compared to men, female state lawmakers’ tweets will be more likely
to have a negative tone.
Issue Focus
Men and women may also differ in the policy content of their communication. At the
most basic level, they might differ because they work on different issues. Previous
https://doi.org/10.1017/spq.2022.16 Published online by Cambridge University Press122 Dan Butler et al.
studies have identified health, welfare, and education as “women’s issues” (Saint-
Germain 1989; Swers 1998, 2002). Other studies have instead focused on specific
issues: for example, focusing on funding for breast cancer as opposed to all health care
funding generally (Osborn 2012; Reingold 2000). We focus on the general categories,
in part, because of the data. There are few tweets on any given specific issue. Indeed,
there are some major categories that are rarely tweeted about. Looking at the more
general categories provides greater variation for analysis. However, using general
categories is a noisier measure. This is why “[s]tudies that adopt a more specific
definition of women’s issues, or those issues that directly affect women, find a closer
connection between women’s presence and policy outputs benefitting women”
(Osborn 2012, 27). For this reason, our test is a harder test of gender differences in
issue coverage.
Theoretically, research suggests that women may be more likely to work on these
issues because they have more knowledge about these issues or simply because they
personally prioritize these issues (Foerstel and Foerstel 1996; Reingold 1992; Thomas
1994; Thomas and Welch 1991). Either way, previous studies have found that women
are more active in policy making on women’s issues.
During the committee stage, women are more likely to advocate for women’s
interests (Swers 2002). And committees with more women are more likely to produce
legislation that incorporates women’s interests (Berkman and O’Connor 1993;
Norton 1999; Swers 2002). Further, female legislators in both the United States
(Thomas 1994; Thomas and Welch 1991) and elsewhere (Considine and Deutchman
1994; Heath, Schwindt-Bayer, and Taylor-Robinson 2005) are more likely to serve on
committees that deal with issues traditionally considered women’s issues.
Even after legislation leaves the committee, women are more active on these issues
with female legislators in Congress participating more in floor debates on women’s
issues (Swers 2000; Tamerius 1995). The focus is not simply because women have
more opportunities to work on women’s issues. When men and women are given the
same requests for help, female legislators are more likely to work on women’s issues
than are their male counterparts (Butler 2014).
In identifying women’s issues, we use general categories rather than specific issues.
In order to classify tweets by issue areas, we follow the categorizations created by the
US Policy Agendas Project Codebook (see Adler and Wilkerson 2014).3 “Education”
tweets are ones that fit the topics in 600: Education in that coding system, and include
primary and higher education as well as tweets about universal pre-K. Our
“Healthcare” category includes policies fitting into 300: Health, including references
to Medicaid, the Affordable Care Act, Medicare for All, and prescription drug prices.
We did not use a separate “Welfare” category, because tweets about this policy area
were so rare. In our training dataset of 10,104 hand-coded tweets, only five used the
word “welfare,” with three of these being references to corporate welfare and thus
included under macroeconomic policy. After classifying all state tweets, following the
machine learning process that we detail below, we test whether women are more
likely than men to discuss women’s issues by comparing their rates of tweeting about
education and health care.
3
The codebook used by Adler and Wilkerson (2014), which we followed and adapted, is available at
https://comparativeagendas.s3.amazonaws.com/codebookfiles/Topics_Codebook_2014.pdf, first accessed
in June 2016.
https://doi.org/10.1017/spq.2022.16 Published online by Cambridge University PressState Politics & Policy Quarterly 123
Hypothesis 4: Compared to men, female state lawmakers’ tweets will include more
content on education and health care policy.
Ideology
In this study, we look at how legislators communicate with their constituents. In
order to win elections, politicians want to publicly take positions that appeal to voters.
This can lead politicians to try to shape their public record to appear to be more in line
with their voters’ preferences. Gender can affect this dynamic because voters think
female, Republican legislators are more liberal than male, Republican legislators and
they think female, Democratic legislators are more liberal than male, Democratic
legislators (Koch 2000). If this leads voters to think that the voters are out-of-step
with their constituents, then legislators have incentives to engage in more conserva-
tive position-taking in order to compensate for voters’ stereotypes and present
themselves as in-line with their constituents.
Hypothesis 5: Controlling for their positions on roll calls, female state lawmakers’
tweets will be more conservative than male state lawmaker’s tweets.
We might see a partisan difference in how legislators take positions because of
their incentives to appeal to primary voters (Brady, Han, and Pope 2007). Democratic
women may not try to appear more conservative than their voting record simply
because being viewed as liberal can help them in the primary election (Sides et al.
2020). Thus, we may not see any relationship between gender and Twitter ideology
among Democrats once we control for their roll call-based ideology. Republican
women, by contrast, have incentives to appear more conservative in order to win their
primary elections (Koch 2000). This suggests that we may only see Republicans
engaging in position-taking to make themselves appear more conservative than they
really are.
Hypothesis 6: Among Republicans, female state lawmakers’ tweets will be more
conservative than male state lawmakers’ tweets when controlling for their roll call
record.
Case Selection
We study legislators’ tweets—and focus on the states—for four reasons. First,
legislators control their tweets. In contrast to coverage in traditional media, the
legislators are able to control what they write. This is important because it may be that
the media systematically covers female politicians differently than male politicians. If
we look at the media coverage, then it is unclear if we are measuring the actions taken
by the legislators, the biases of the media, or a combination of both. Because we are
interested in how politicians choose to portray themselves, looking at Twitter—a
communication form they control—allows us to do that (see also Pearson and
Dancey 2011; Pearson and McGhee 2013).
Second, at least in some legislatures, women face institutional constraints that
affect their ability to influence legislation or other outcomes (Hawkesworth 2003).
Twitter is a tool that is not controlled by legislative leaders or legislative institutions
https://doi.org/10.1017/spq.2022.16 Published online by Cambridge University Press124 Dan Butler et al.
and therefore allows us to measure the legislators’ activity free from any biases against
them or constraints placed on them.
Third, tweets are public information. We need access to what legislators say in
order to measure how legislators portray themselves. Twitter has this information.
Also, legislators cannot microtarget tweets. It is not the case that women can send
messages only to female followers and men only to male followers. If they could, we
might worry that the differences in content might reflect the specific group they were
microtargeting. This is not the concern because we are getting the public tweets that
they use to speak to all constituents, the media, and fellow legislators.
Fourth, social media and Twitter are an increasingly important form of commu-
nication. They are used extensively not only by American state legislators but also by
politicians all around the world (Alles and Jones 2016; Jungherr 2016; Vergeer 2015).
Understanding how politicians communicate through a medium that they use nearly
every day is critical to understanding how they choose to portray themselves—and
how the public perceives them—in the modern era.
Focusing on state legislators in particular provides a strong empirical ground in
which to study the impact of gender on communication styles. In our dataset, there
are 1,391 female lawmakers, making up 25.7% of state legislators overall. This
includes 535 Republican women and 845 Democratic women. By contrast, during
the 116th Congress, only 101 women served in the House, including 88 Democrats
and just 13 Republicans.4 Compared to Congress, studying the states provides more
opportunity to identify systematic patterns and to differentiate the effects of gender
from those of party. And studying Twitter in state legislatures can provide a
particularly unfiltered view of political communication. The scarcity of staff
resources makes it more likely that state legislators send tweets themselves rather
than relying upon staff, relative to members of Congress. When studying the impact
of an individual attribute such as gender, this ability to observe direct personal
behavior is valuable.
Data Collection
In order to combine human coding with machine learning techniques to classify the
tweets of all lower house state legislators, we proceeded in four steps:
• Classifying and validating a “training set” of 10,104 hand-coded tweets
• “Pre-processing” the tweets to focus on their essential linguistic characteristics
• Training machine learning algorithms to replicate the hand codes, and testing
their accuracy
• Classifying the full corpus of 3,580,727 tweets.
We began by creating a training set of tweets by American politicians over the last
several years, categorized by their ideology, sentiment, whether they contained
explicitly political subjects or not, the policy area that they address, and whether
they constituted an opinion or a factual claim. We did so by building on the work
done by Kousser and Oklobdzija (2018) who had a team of multiple research
4
See “Women Serving in the 116th Congress (2019–2021),” Center for American Women and Politics,
Rutgers University, https://cawp.rutgers.edu/list-women-currently-serving-congress.
https://doi.org/10.1017/spq.2022.16 Published online by Cambridge University PressState Politics & Policy Quarterly 125
Table 1. Measures of intercoder reliability: humans agreeing with humans
Agreement rate Cohen’s kappa
Is the Tweet a factual claim or an opinion? 0.78 0.42
Ideology (liberal, neutral, or conservative) 0.78 0.66
Sentiment (negative, neutral, or positive) 0.75 0.60
Is the Tweet political or personal? 0.91 0.55
Topic: Immigration 1.00 0.87
Topic: Macroeconomics 0.97 0.73
Topic: Defense 0.96 0.77
Topic: Law and Crime 0.99 0.86
Topic: Civil Rights 0.98 0.71
Topic: Environment 1.00 0.84
Topic: Education 1.00 0.83
Topic: Health 0.99 0.82
Topic: Government operations 0.98 0.23
Topic: No policy content 0.91 0.78
Asks for a donation? 0.99 0.66
Asks to watch, share, or follow? 0.95 0.65
Asks for miscellaneous action? 0.93 0.57
Note: Based on an analysis of 1,217 tweets coded by rotating pairs of research assistants.
assistants (RAs) hand code a random sample of 8,206 tweets by the 2016 presidential
candidates and their SuperPACs. These tweets were downloaded from Twitter’s
public API every week from October 2015 to July 2018.5
We then supplemented the database from Kousser and Oklobdzjia (2018) with
1,898 tweets from upper house state legislators and statewide officeholders that we
coded for this project. We coded the tweets from the upper house state legislators
because we wanted to make sure we included communications from those serving in
a legislative context in our training dataset, but to train our algorithms on a set of
tweets that was distinct from the lower house tweets in the full corpus that we later
analyze. We downloaded the tweets from state legislators and state officials beginning
in June 2018. We also had a group of RAs hand code the tweets using the same
procedure as Kousser and Oklobdzjia (2018). In particular, all RAs worked from the
same codebook and met regularly but coded tweets independently and were given
only the text of the tweet, with no information about who sent it.
Table 1 provides data demonstrating that these coders reliably agreed in their
independent categorizations. Using a subset of 1,217 presidential tweets, which were
assigned to overlapping pairs of coders, we report two measures of intercoder
reliability: the rate of agreement between coders and the Cohen’s Kappa, measuring
how much more likely our coders were to agree than two coders would be by random
chance alone. Our rates of agreement range from 75% on our three-category
sentiment measure to perfect agreement on three of our subject areas, with the
Cohen’s Kappa measures ranging from “fair” to “almost perfect” agreement levels for
all but one of our variables. For our measure of ideology, the coders agreed 78% of the
time, with a Cohen’s kappa of 0.66, demonstrating that they could make this
subjective judgment in a reliable, replicable manner.
5
Kousser and Oklobdzjia (2018) found that their coding led to Cohen’s kappa, which measures how much
more likely our coders were to agree than two coders would be by random chance alone, range from 75% on
the three-category sentiment score to perfect agreement on three of the subject areas.
https://doi.org/10.1017/spq.2022.16 Published online by Cambridge University Press126 Dan Butler et al.
Table 2. Examples of variables and tweets in each category
What issue did the tweet address?
Education issue (3.4%) Health care issue (1.6%)
Thank you for helping me reach The #opioidcrisis is very much here. This is a great initiative by
1,400 followers. I appreciate @GovernorTomWolf and steps to link people to…
your support for my campaign
to #StopCommonCore in #AZ
Thanks to @SenatorBaldwin for I’ve personally witnessed how Medi-Cal has changed lives. 1/3 of CA’s
fighting to expand access to population (13 million children & adults) is on Medi-Cal
#HigherEd
RT @HouseDemsIL: Live call w/ @ChrisMurphyCT thanking him for leading opposition to
Superintendents call on #TrumpCare. Watch. https://t.co/WZH1Ot0LUa @ActTogetherCT
@GovRauner to do his job and @womensmarchct
#SignSB1 to ensure our
children receive a quality
education
Ideology
Liberal (8.3%) Neutral (72.1%) Conservative (19.6%)
Medicaid enrollment has slowed Top 5 AZ consumer fraud I was proud to stand up for the
in recent years, but it still complaints and 5 warning #righttolife again this week!
serves nearly a quarter of our signs: https://t.co/fznWrvoBr6 #prolife #alpolitics
population
Workers’ Rights: Check this video Last night, we went to Seussical. New approach to business tax
out w/ local verizon workers My cousin Wes was one of the filings greatly reduces gov’t
on strike in EB and what their leads and all three of my red tape—was recommended
cause is about. http://t.co/ neighbors were in it. They all by our streamlining initiative
0FPMMr9 via @youtube did great!
Sentiment
Negative (19.0%) Neutral (22.0%) Positive (59.1%)
Lots that could have been fixed if Discrimination Lawsuit Filed Pa. Medical Marijuana legislation
WI GOP had not quit early: Against Used Car Dealership in back on track #SenAHW
student loan debt, transpo Mesa #CoSponsor #SB3
funding, voucher #MedicalMarijuana #PA via
accountability…
#WICanDoBetter
In Senate Approps being asked Intel predicts a $7 trillion self- Governor Brown signs 5
to spend $1.9 million to cover driving future #EquityAndJustice bills today!
@SchuetteOnDuty’s fight A BIG step to promote safety,
against marriage equality. rehabilitation & family
Waste of taxpayer dollars cohesion
In Table 2, we provide examples of tweets by state politicians that fit into the key
categories that we focus on in this analysis. We show what types of text would
highlight to our coders that a tweet had liberal, neutral, or conservative ideological
content, as well as whether it conveyed negative, neutral, or positive sentiment. We
report tweets that were identified as falling into the education or health care policy
realms, two types of “women’s issues” highlighted by prior research (Saint-Germain
1989; Swers 1998, 2002) and following the policy categories used by the Policy
Agendas Project to code federal bills by Adler and Wilkerson (2014). For each
category, we report how prevalent it was in the full corpus of state lower house
tweets, according to our classifications.
https://doi.org/10.1017/spq.2022.16 Published online by Cambridge University PressState Politics & Policy Quarterly 127
Table 3. Measures of classification accuracy: computers replicating humans
Final testing accuracy Cohen’s kappa
Is the Tweet an opinion versus a factual claim? 0.65 0.29
Ideology (liberal, neutral, or conservative) 0.62 0.40
Sentiment (negative, neutral, or positive) 0.60 0.38
Is the Tweet political or personal? 0.83 0.38
Topic: Education 0.92 0.03
Topic: Health 0.97 0.20
Topic: Immigration 0.98 0.29
Topic: Macroeconomics 0.93 0.27
Topic: Defense 0.93 0.10
Topic: Law and crime 0.98 0.07
Topic: Civil rights 0.97 0.26
Topic: Environment 0.20 0.00
Topic: Government operations 0.98 0.07
Topic: No policy content 0.79 0.56
Asks for a donation? 0.99 0.00
Asks to watch, share, or follow? 0.95 0.50
Asks for miscellaneous action? 0.29 0.02
Note: Based on an analysis of a final testing set of 1,010 tweets after training on 8,084 tweets and testing on 1,010 tweets.
With this training set in hand, we then pre-processed the tweets through a series of
steps that are commonly used in text analysis. We made every word lower case,
removed URLs as well as additional links and emails, and deleted all alphanumeric
text. Depending on whether it improved prediction accuracy for individual charac-
teristics of tweets, we also removed unnecessary stop words such as “the,” “a,” or “an,”
and removed screen names.
We then used the remaining text of each tweet, along with the human codings of
their characteristics, to train a set of algorithms that fit models connecting the text to
the codings. The algorithms that we used in this stage of the analysis were all taken
from the scikit-learn Python library.6 To train the algorithms, we divided our training
set of 10,104 tweets, using 80% of them to train, 10% to test the accuracy and select the
most accurate algorithm, and 10% to use as a “final testing set,” which avoids over-
fitting a model. Table 3 reports the results of these final tests. The first column shows
accuracy for each variable, which is rate at which the algorithm was able to correctly
replicate the human coding. The second column reports the Cohen’s kappa, which is
the improvement in accuracy over what we would expect by random chance if the
algorithm always placed a tweet in the most prevalent category. For the policy
variables, which take on only two values, accuracy is consistently high, registering
over 90% in final testing accuracy for every policy area other than environmental
policy (which does not feature in our analysis). While accuracy is lower for sentiment
and ideology, reflecting the increased difficulty of correctly coding a variable that
takes on three values, Cohen’s kappa values fall just over or just below the “moderate”
threshold (Landis and Koch 1977, 165) for both variables.
6
This library can be accessed at https://scikit-learn.org/stable/. We used the algorithm that produced the
best accuracy for each tweet characteristic, including Multinomial Naïve Bayes (for sentiment, political,
ideology, no policy content, factual claims or opinions, and whether a tweet made a miscellaneous ask),
Bagging Classifier (for immigration, macroeconomic, health care, national security, crime, and whether a
tweet asked for donations), and Linear SVC (for civil rights, governance, and whether a tweet asked a follower
to watch, share, or follow). We also adjusted the tuning parameters to identify the best fit for each model.
https://doi.org/10.1017/spq.2022.16 Published online by Cambridge University Press128 Dan Butler et al.
Finally, we used the trained algorithms to classify an original dataset of the tweets
of all lower house state legislators. To collect these tweets, we began by working with
undergraduate RAs to search for the Twitter handles of all legislators serving in lower
houses of 49 states—excluding Nebraska’s unicameral, nonpartisan house—in the
summer of 2017. The RAs generally started by first performing a search for a one of
the legislators on their list. In some states, especially more professional states, the
handles were sometimes publicly listed together. More often, the RAs first found the
Twitter account for one legislator and then found that the other legislators in their
party in the state often linked to that account.
The RAs were unable to find accounts for many legislators, even after using
several variants of the legislator’s names in the search. If the RAs were unable to
find an account after searching for several minutes, they moved on to the next
account. RAs also limited the sample to publicly listed accounts because we are
interested in how legislators portray themselves to the public. Once the RAs
identified a likely match, they looked at several tweets in the accounts to confirm
that they had correctly identified the legislator’s account. In a few cases, the
legislator did not have an account, but accounts were set up to parody the
legislator. In other cases, legislators had multiple accounts. RAs looked through
these accounts and identified the account(s) that were used as the legislator’s
account during the legislative session. In some cases, legislators had multiple
accounts that met these criteria; in those cases, all accounts were used in the
study. In many of these cases, the dates the accounts were used did not overlap,
suggesting that it may simply have been a case where the legislator forgot their
password and decided to simply create a new account.
The RAs also recorded the genders,7 party affiliations, and districts represented by
these 5,413 state legislators.8 Of these lawmakers, 2,014 (37%) did not have a public
Twitter handle that we could identify. For the 3,399 (63%) of state legislators who did
have a social media presence, we collected all available tweets from Twitter’s public
API that were available in April 2019. This produced a dataset of 3,580,727 tweets.
We then classified the features of these tweets and then calculated the average rates of
each type of tweet for each tweeting legislator, along with their total tweet count. We
merge this dataset with our data on legislator characteristics, successfully matching
3,129 state legislators to their tweet records. Finally, we appended data ideology based
on statehouse roll call voting and national survey responses for all state legislators
elected before 2016, using Shor and McCarty’s (2011), updated with data from all
legislators elected before 2016 through their website.9
In order to explore the validity of the classifications the algorithms produced, we
can compare our tweet-based ideology score with the roll call-based measures for
state legislators collected by Shor and McCarty (2011). Although lawmakers may
choose to vote and to communicate in slightly different ways (e.g., Hypotheses 5 and
6), there should be a strong correlation between the ideological positions that
legislators take on the floor and the images that they convey on social media.
7
In internet searches, we have not identified any state legislators who have made a public declaration of a
non-binary gender identification as of May 2019.
8
This is two more legislators that serve at any one time in state lower houses (5,411), likely because some
legislators who were selected in special elections to replace others were also included.
9
We collected roll call ideology scores in May 2019 from https://americanlegislatures.com/data/.
https://doi.org/10.1017/spq.2022.16 Published online by Cambridge University PressState Politics & Policy Quarterly 129
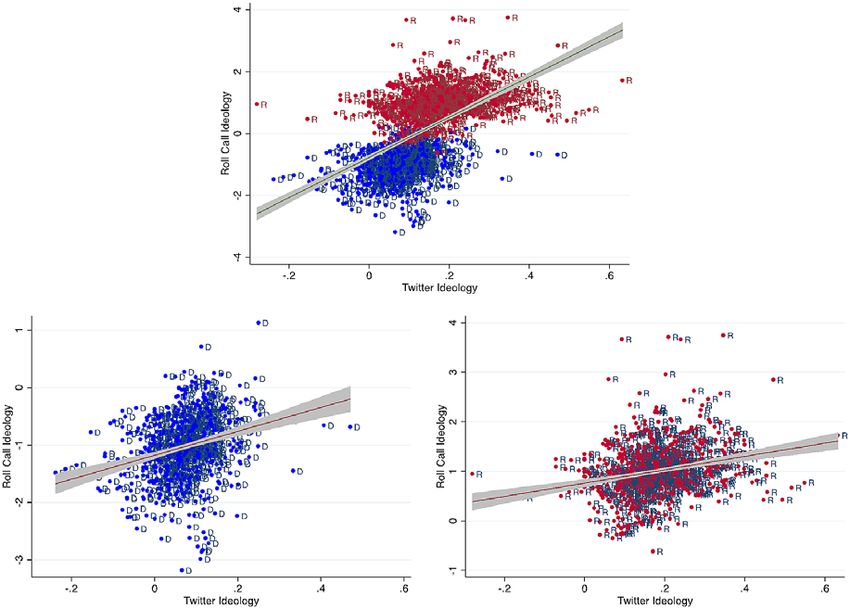
Figure 1. Testing the validity of tweet-based ideology measure.
Notes: All graphs compare our measure of the average ideology of each legislator’s tweets with her roll call
ideology, taken from updates to the dataset originally collected by Shor and McCarty (2011). Observations
are all state lower house legislators elected before 2016 with more than 10 tweets.
As Figure 1 shows, a legislator’s Twitter ideology score10 is positively correlated
with her roll call ideology score produced by Shor and McCarty (2011). The
scatterplot in the top panel, which includes a fit line with a 95% confidence interval,
combines the data for both Democrats and Republicans and shows there is a positive
relationship between the two measures. A regression of roll call ideology on Twitter
ideology, reported in Supplementary Appendix Table 1, shows that this relationship
is statistically significant at the 99% confidence level. Importantly, our tweet-based
scores also predict roll call ideology within parties. The two scatterplots in the lower
panel of Figure 1 show that this link holds within the Democratic Party and
Republican Party. Regressions in Supplementary Appendix Table 1 demonstrate
that these relationships are statistically significant. In fact, this relationship holds
even within party for a model with state fixed effects. That means that when two
legislators are in the same party and members of the lower house in the same state, the
10
We calculate this score by multiplying a legislator’s liberal tweets by negative one, neutral tweets by zero,
and conservative tweets by one, and taking the sum. This yields a score that can range from negative one to
one, with larger values representing a higher rate of conservative versus liberal tweeting. In Figure 1, we
display data only for legislators with more than 10 tweets, to guard against small-sample outliers, and also
remove the 0.75 score of Mississippi legislators Earle Banks, the most liberal frequent tweeter in our dataset,
whose Twitter record consists almost entirely of campaign messages during his 2012 run for state Supreme
Court.
https://doi.org/10.1017/spq.2022.16 Published online by Cambridge University Press130 Dan Butler et al.
lawmaker who tweets more conservatively is also likely to vote more conservatively,
an important validation of this measure.
Analysis
In using the information on the 5,413 state legislators and their tweets to test our
hypotheses, we compare the raw, bivariate differences between female and male
legislators and then present full multivariate tests (see Oklobdzija, Kousser, and
Butler 2022 for replication code and data). In these tests, we control for legislators’
party affiliation and also include state fixed effects. These fixed effects capture the
impact of all measurable features of a state—its level of legislative professionalism, its
political culture, the party balance in its statehouse—along with all idiosyncratic
characteristics that are fixed. These multivariate models with controls for party and
with state fixed effects are the focus of our main analysis. Later, we present extensions
that add additional factors to probe the robustness of the impact of gender and to
explore other social media dynamics, often with a subset of our cases. We look at the
impact of a legislator’s racial and ethnic identity, as well as its intersection with
gender, in a section of the paper devoted to this question. We explore the effects of a
state’s legislative professionalism (Squire 2017) and of how recently a lawmaker was
elected in analyses reported in our Supplementary Appendix. Each of these reveals
important lessons but does not alter the clear relationship between gender and social
media activity and messaging. That is the central focus of our main analysis presented
below.
We first test relationship between gender and a lawmaker’s allocation of time to
establishing a social media presence. Hypotheses 1 and 2, respectively, predict that
women will be more likely to have a Twitter handle and will tweet more frequently if
they do. Regarding Hypothesis 1, 71.9% of the 1,391 female state legislators in our
dataset had a public Twitter account we could identify. For the 4,022 male state
legislators, this figure was only 60.0%. This significant gender gap in social media
presence also holds when we estimate regressions that control for the legislator’s
partisanship and state fixed effects. According to this model, reported in Table 4,
women establish handles at a 10.6% higher rate, all else equal, a result that is
significant at the 99% confidence level.
Conditional on establishing an account, women also appear to tweet more often,
tweeting an average of 1,200 times compared to 1,032 for men over the full history of
their political Twitter account. That represents a 16% increase in how much more
often women tweet compared to their male counterparts. In a multivariate model of
tweet frequency, conditional on having an account, we also see that women send an
estimated 121 more tweets, which again is strongly significant. The final model in
Table 4 ties these two aspects of social media together into a single estimation. Our
assumption here is that there is a latent variable measuring each lawmaker’s “tweet
effort.” For those who take on high enough values of this variable to establish an
account, we can directly observe their effort through their number of tweets. For
those who have no account, our observation of their effort is censored at zero tweets.
This sort of censoring can be corrected for by a “Tobit” maximum likelihood model,
with left-censoring at zero. The estimated impact of gender from this model, which is
determined both by women’s higher rates of tweeting and the greater likelihood that
https://doi.org/10.1017/spq.2022.16 Published online by Cambridge University PressState Politics & Policy Quarterly 131
Table 4. Does gender affect twitter activity?
Does the legislator have a handle? Tweet count Tobit model
0.106** 118.771** 327.635**
Female legislator (0.014) (46.580) (49.510)
0.053** 314.705** 354.528**
Democratic legislator (0.013) (45.036) (45.836)
State fixed effects Included Included Included
Observations 5,422 3,134 5,422
Adjusted R-squared 0.159 0.081
Notes: Observations are all state lower house legislators in the first and third models, and all state legislators with Twitter
accounts in the second model. Standard errors in parentheses, **p < 0.01, *p < 0.05. Dependent variables are a dichotomous
measure of whether a legislator had an official Twitter handle (in the first column) and the count of tweets from that handle
(in the second).
Table 5. Does gender affect sentiment and attention to “women’s issues”?
Sentiment score Women’s issues Education Health care
3.774** 0.716** 0.308** 0.408**
Female legislator (0.949) (0.148) (0.104) (0.106)
4.972** 0.876** 0.280** 0.596**
Democratic legislator (0.978) (0.135) (0.093) (0.097)
State fixed effects Included Included Included Included
Observations 3,134 3,134 3,134 3,134
Adjusted R-squared 0.107 0.080 0.086 0.052
Notes: Observations are all state lower house legislators with Twitter accounts. Standard errors in parentheses, **p < 0.01,
*p < 0.05. Dependent variables are the percentage of tweets: (1) with a positive sentiment, (2) addressing women’s issues,
(3) addressing education issues, and (4) addressing health care issues.
they will establish a social media presence in the first place, is that female state
legislators score an estimated 330 tweets higher on this scale of tweet effort.
Our test of Hypothesis 3 explores the finding of Evans et al. (2014) and Evans and
Clark (2016) that female candidates tweet with a more negative tone than their male
counterparts. At first glance in our dataset, it appears that gender has little impact on
sentiment, with women registering a 48.8% in our summary measure of sentiment11
and men a 47.1%. Yet the multivariate analysis reported in Table 5 shows that gender
does have an apparent effect that is hidden, in a bivariate comparison, by its
correlation with party affiliation. Women tweet an estimated 3.8 percentage points
more positively, while Democrats tweet 5 percentage points more negatively. The full
extent of this gender gap is only revealed when we control for party because the
majority of women serving in office belong to the Democratic Party and Democrats
tweet more negatively. So when we compare female legislators to their partisan
counterparts, we see that women exhibit a more positive sentiment in their tweets.
Even with state fixed effects, these effects are significant at the 99% confidence level.
Sentiment patterns in our sample of state legislator tweets run contrary to the
patterns observed in congressional campaigns by Evans et al. (2014) and Evans
and Clark (2016); when tweeting from statehouses, it appears, female legislators strike
a more positive tone than their male counterparts.
11
We calculate this score by multiplying a legislator’s negative tweets by negative one, neutral tweets by
zero, and positive tweets by one, and taking the sum. A higher score denotes a higher frequency of positive
tweets relative to negative tweets.
https://doi.org/10.1017/spq.2022.16 Published online by Cambridge University Press132 Dan Butler et al.
Table 5 also reports our tests of whether female legislators are more likely to tweet
about education and health care (i.e., Hypothesis 4). These are policy realms in which
they may have a great interest and expertise, and where their opportunities to claim
credit for their work may be magnified if voters view them as more expert in these
areas. To be sure, tweeting about these issues or indeed any specific policy realm is a
rare occurrence for legislators of either gender. Over 66% of state legislative tweets
have no clearly identifiable policy content, a trend that Kousser (2019) also identifies
among members of the Australian Parliament. Still, the rate of tweeting about
education or health care does significantly vary by gender in the states. Men address
these issues in 3.5% of their tweets, while women do so in 4.4% of tweets. Controlling
for party and for state fixed effects, our multivariate model estimates that female
lawmakers tweet about women’s issue 0.7 percentage points more often, a different
that is significant at the 99% confidence level. Our models also show that this is
because they tweet more about each women’s issue significantly more often. Women
tweet about education 0.3 percentage points more often and about health care 0.4
percentage points more often than men.
Our final tests look at whether women communicate differently than men about
their ideology. Because they may seek to counter the stereotype that they are more
liberal than their co-partisans (see Koch 2000), women of both parties may take more
conservative positions on Twitter than men (Hypothesis 5). Because we are interested
in how the present themselves relative to their roll call positions, we control for their
roll call-based ideology in these tests.
In our test of Hypothesis 6, we explore the possibility that these incentives may
operate differently for Republican and Democratic women. Republican women
should have consistent incentives to take positions on social media that are more
conservative, because this will position them well for Republican primary elections.
Democrats face a countervailing incentive to appear more liberal to improve their
chances in the primary election, which may push take them to tweet more liberally
than expected given their roll call behavior.
The first model in Table 6 shows no apparent relationship between gender and
Twitter ideology when we hold party affiliation and roll call-based ideology constant.
As Figure 1 already showed, there is a positive correlation between legislators’ twitter
ideology and their roll call-based ideal points. Table 6 confirms this relationship with
the positive coefficient on the roll call-based measure for legislators’ ideal points.
Significantly, when we control for their roll call record, party and gender do not
predict the ideological content of their tweets. When we estimate separate models for
each party (see columns 2 and 3), we also see no relationship between gender and the
ideological content of their tweets. In sum, once we control for the legislators’ ideal
point, gender does not predict the ideological content of tweets. Women are not
portraying themselves more conservatively in their tweets than they are in their roll
call votes.
Race, Ethnicity, and Intersectionality
Recent studies suggest the importance of taking a broader view of identity. Looking at
tweet activity by members of the Congressional Black Caucus during the 2013–2024
session, Tillery (2019) finds that gender was the single most powerful predictor of
how often a caucus member tweeted about racial issues, with women tweeting
https://doi.org/10.1017/spq.2022.16 Published online by Cambridge University PressState Politics & Policy Quarterly 133
Table 6. Does gender predict Twitter ideology?
All legislators Only democrats Only republicans
0.039** 0.025 0.047**
Roll call ideology (0.007) (0.013) (0.010)
0.009 0.017 0.003
Female legislator (0.007) (0.010) (0.009)
0.012
Democratic legislator (0.016)
State fixed effects Included Included Included
Observations 1722 782 937
Adjusted R-squared 0.216 0.063 0.149
Notes: Observations are all state lower house legislators elected before 2016 with Twitter accounts. Standard errors in
parentheses, **p < 0.01, *p < 0.05. Dependent variable in all models is average ideology of each legislator’s tweets.
significantly more frequently about race. Barrett’s (1995) investigation demonstrates
that the policy priorities of Black women in statehouses are shaped by both aspects of
their identity, and Fraga et al. (2006) find significant differences between male and
female Latinx state lawmakers in the coalitions that they form and how often
members of other groups seek their expertise.
Using data collected by the Reflective Democracy Campaign (2017) on the race
and ethnicity of state legislators in the 2016–2017 session, we were able to record the
race and ethnicity of 3,355 members of our full dataset of 5,422 state lawmakers,
including 2,077 of the 3,144 lawmakers with Twitter handles. For this exploratory
analysis, we initially analyzed members of each racial and ethnic group individually
and found that Black and Latinx legislators were distinct from other legislators. To
streamline the analysis and preserve statistical power in the analysis below, we
combine the members of the nation’s two largest racial and ethnic minority groups.
An initial, descriptive analysis reveals that Black and Latinx women in state
legislatures are by far the most active group, with 82.2% having a political Twitter
handle, compared with 72.3% of women who are white or members of other groups.
Among male state lawmakers, 71.6% of male Black or Latinx representatives tweet,
compared with 63.6% of men who are white or members of other groups. Legislators
from these racial and ethnic minority groups also tweet more often than their white or
other counterparts of the same gender, with Black and Latinx female lawmakers
sending 1,209 versus 1,149 tweets and Black and Latinx men sending 1,344 versus
1,040. The multivariate analysis of tweet activity reported in Table 7 shows that this is
intertwined with partisan differences. Democratic state legislators are much more
active on social media, and Black and Latinx lawmakers are much more likely to be
members of the Democratic Party. Controlling for partisanship, we do not find a
significant impact of race/ethnicity or its interaction with gender on tweet activity.
Yet these patterns raise the question of whether the higher levels of social media
engagement by Democrats in state legislatures is partly a function of the more diverse
makeup of this party.
Our analyses of the content of tweets, reported in Table 8, again reveal mixed
findings but do show a significant effect of race and ethnicity on attention to health
care issues as well as the persistent influence of gender. Just as we found in our main
analysis, women are more likely to tweet with a positive sentiment and focus more on
education and on health care. For the latter issue, Black and Latinx lawmakers are
significantly more attentive than white legislators or members of other groups. The
https://doi.org/10.1017/spq.2022.16 Published online by Cambridge University PressYou can also read