DRAG REDUCTION OF AIRFRAME AND NON-LIFTING ROTATING SYSTEMS - DISSERTATION TO OBTAIN THE DEGREE OF MASTER IN AERONAUTICAL ENGINEERING - uBibliorum
←
→
Page content transcription
If your browser does not render page correctly, please read the page content below
UNIVERSIDADE
                          OF
                    BEIRA INTERIOR

        DEPARTAMENTO DE CIÊNCIAS AEROESPACIAIS

     DRAG REDUCTION OF AIRFRAME
                        AND
     NON-LIFTING ROTATING SYSTEMS

           Gonçalo Alexandre da Graça Pereira

DISSERTATION TO OBTAIN THE DEGREE OF MASTER IN
          AERONAUTICAL ENGINEERING

                      AUGUST 2009
Gonçalo Alexandre da Graça Pereira

                  DRAG REDUCTION OF AIRFRAME
                                        AND
                 NON-LIFTING ROTATING SYSTEMS

Dissertation of Master in Aeronautical Engineering presented to the University of Beira
Interior, 2009

                    Thesis developed under coordination of
                 Professor Eng. André Resende Rodrigues Silva

                                in association with:
To Rute

...for all the moments, inspiration and comprehension.

ABSTRACT

Abstract

       Acting as a bridge for the development of the aeronautics sector in the European
Union, the Clean Sky project is being developed in partnership with leading European
manufacturers of aircraft and their components. Taking into account all the
environmental problems addressed during the recent past, this project has the goal of
revolutionizing the industry through the construction and operation of aircraft with a
low environmental impact. Consequently, the development of this dissertation focuses
on the Green Rotorcraft (GRC2) project that is part of the mentioned European
programme, which aims to shorten the time to market for new solutions tested on
heavy-sized utility aircraft, aerodynamically improved to reduce fuel consumption and
consequent emissions.
       The present work shows, through a literature search focused on guidelines and
studies for active and passive control methodologies, a theoretical review of methods to
reduce the parasite drag of the fuselage and non-lifting rotating systems with the
objective to implement them on heavy-sized helicopters, which can ensure the
achievement of the primary objectives established by the European Commission for the
Clean Sky programme. Consequently, design guidelines are shown with practical
examples demonstrated, to give evidence and enable the development of this project.
       An analytical work is performed in this thesis, divided into two distinct areas:
Active Horizontal Stabilizer, to trim the fuselage; and Cooling Systems, improved to
reduce their net ram drag. Optimization solutions are presented in this research,
showing the theoretical benefits obtained from the implementation of such changes.

                                           iv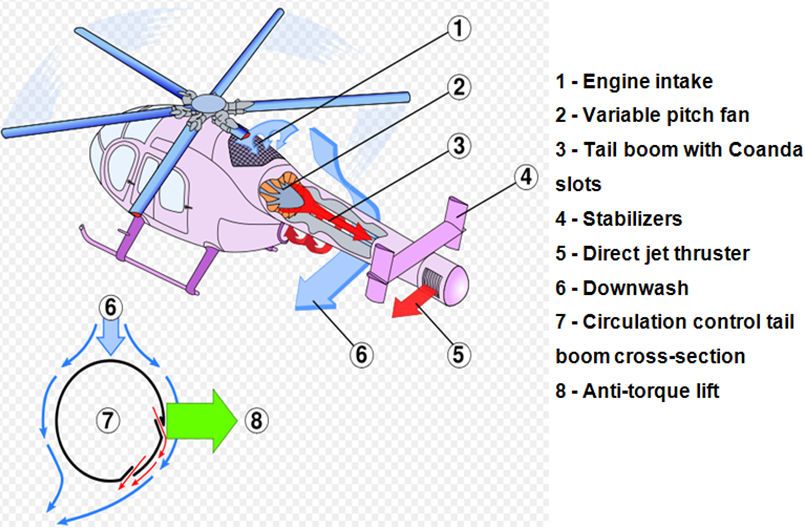
RESUMO

Resumo

       Actuando como ponte para o desenvolvimento do sector aeronáutico na União
Europeia, o projecto Clean Sky está a ser desenvolvido em parceria com os principais
construtores europeus de aeronaves e respectivos componentes. Tendo em consideração
todos os problemas ambientais abordados nos últimos anos, este projecto tem como
objectivo revolucionar a indústria aeronáutica através da construção e operação de
aeronaves com reduzido impacto ambiental. Desta forma, o desenvolvimento desta
dissertação incide sobre o projecto Green Rotorcraft (GRC2) que faz parte do programa
europeu mencionado, visando à redução do tempo de construção de novos conceitos
para uma aeronave da categoria Utilitário pesado melhorada aerodinamicamente de
forma a reduzir o consumo de combustível e consequentes emissões poluentes.
       O presente trabalho mostra, através de uma pesquisa bibliográfica focada em
directrizes e estudos para métodos de controlo activo e passivo, uma revisão teórica de
métodos para redução da resistência ao avanço parasita da fuselagem e de sistemas
rotativos que não produzam sustentação com o objectivo de os implementar
helicópteros pesados utilitários, assegurando assim o alcance dos principais objectivos
estabelecidos pela Comissão Europeia para o programa Clean Sky. Assim sendo, são
propostas directrizes de projecto com exemplos práticos demonstrados que comprovem
e viabilizem o desenvolvimento deste projecto.
       Nesta tese é realizado um estudo analítico, dividido em duas áreas distintas:
Estabilizador Horizontal Activo, para trimar a fuselagem; e Sistemas de Arrefecimento,
melhorados de forma a reduzirem a sua resistência ao avanço. Durante este estudo são
apresentadas optimizações, mostrando os benefícios teóricos obtidos da implementação
destes sistemas.

                                          v
ACKNOWLEDGEMENTS

Acknowledgements

       I would like to take this opportunity to express my thanks and appreciations to
my academic coordinator, Professor André R. R. Silva, and to my industry coordinator,
Nigel Scrase, for their advice and guidance during all the steps of this work as well as
the constant availability through the development stage.

       This work was made possible through the collaboration between University of
Beira Interior, CEIIA and Agusta Westland.

       I am grateful for all the support given from my colleagues at the Aerodynamics
Department in Agusta Westland, with a special thanks to John Carmichael, Cristina
Garcia, George Gardner, Edward Power and David Tring for all the assistance.
       I would also like to thank to Jon Hamm, Mathew Horwood and Stephen Dymott
for all the analytical research support.

       I would like to extend a special acknowledgement to my girlfriend Rute and to
my parents, for all the support and confidence throughout my academic path.

                                                                       Gonçalo Pereira
                                                                         Covilhã, 2009

                                           vi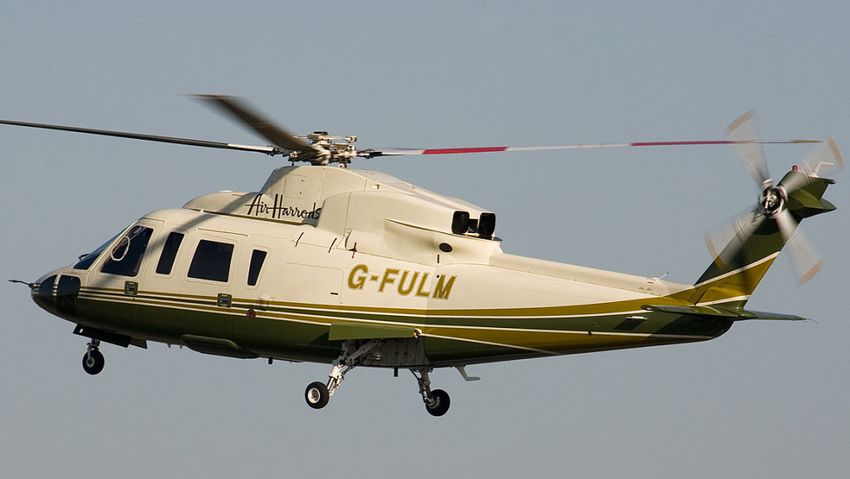
TABLE OF CONTENTS

Table of Contents

List of Acronyms and Abbreviations.............................................................................................ix
Nomenclature................................................................................................................................x
List of Figures................................................................................................................................xi
List of Tables...............................................................................................................................xiv
Chapter 1

INTRODUCTION...........................................................................................................1
            1.1 Objectives...................................................................................................................1
            1.2 Clean Sky....................................................................................................................1
            1.3 Parasitic Power...........................................................................................................7
            1.4 Engine Installation......................................................................................................8
Chapter 2

LITERATURE SEARCH.............................................................................................11
            2.1 Introduction..............................................................................................................11
            2.2 Sources of Performance Loss...................................................................................14
                        2.2.1 Fuselage....................................................................................................14
                        2.2.2 Protuberances..........................................................................................16
                        2.2.3 Cooling Systems........................................................................................18
                        2.2.4 Engine Installation Performance..............................................................18
            2.3 Performance Improvement Methods......................................................................20
                        2.3.1 Passive Drag Reductions...........................................................................20
                                    2.3.1.1 Design Aspects..........................................................................20
                                    2.3.1.2 Spoiler.......................................................................................21
                                    2.3.1.3 Strake/Deflector.......................................................................23
                                    2.3.1.4 Vortex Generators....................................................................25
                        2.3.2 Active Drag Reductions.............................................................................27
                                    2.3.2.1 Synthetic Jet Actuators............................................................27
                                    2.3.2.2 Active Dimples.........................................................................29
                        2.3.3 Anti-Torque Control Systems...................................................................31
                                    2.3.3.1 Fenestron..................................................................................31
                                    2.3.3.2 NOTAR.....................................................................................33

                                                                       vii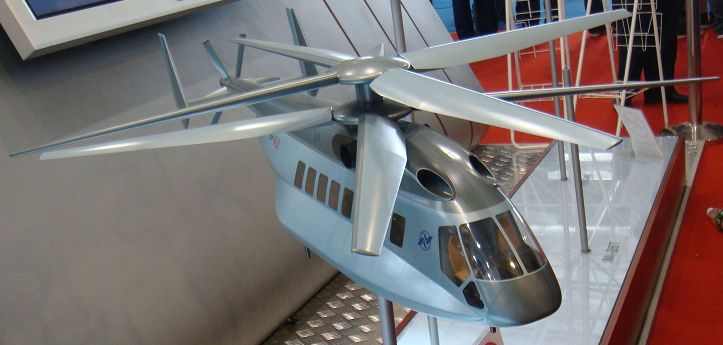
TABLE OF CONTENTS

                                    2.3.3.3 Vectored Thrust Ducted Propeller System..............................34
                        2.3.4 Considerations for Engine Installation Performance Improvements.......36
            2.4 Industry Examples....................................................................................................38
                        2.4.1 Westland Lynx - Helicopter World Speed Record.....................................38
                        2.4.2 Sikorsky S-76.............................................................................................41
                        2.4.3 Sikorsky X2................................................................................................43
                        2.4.4 Aerospatiale SA 365N Dauphin.................................................................44
                        2.4.5 Mil Mi-38..................................................................................................46
                        2.4.6 Kamov Ka-92.............................................................................................47
Chapter 3

ANALYTICAL RESEARCH.......................................................................................50
            3.1 Active Tailplane........................................................................................................50
                        3.1.1 Introduction..............................................................................................50
                        3.1.2 Simulation.................................................................................................51
                        3.1.3 Savings......................................................................................................57
                        3.1.4 Analysis.....................................................................................................58
            3.2 Cooling Systems........................................................................................................58
                        3.2.1 Introduction..............................................................................................58
                        3.2.2 Results and Savings..................................................................................61
                        3.2.3 Analysis.....................................................................................................62
Chapter 4

CONCLUSIONS............................................................................................................64
Recommendations........................................................................................................................A
References.....................................................................................................................................B
Appendix A....................................................................................................................................G
Appendix B...................................................................................................................................M

                                                                     viii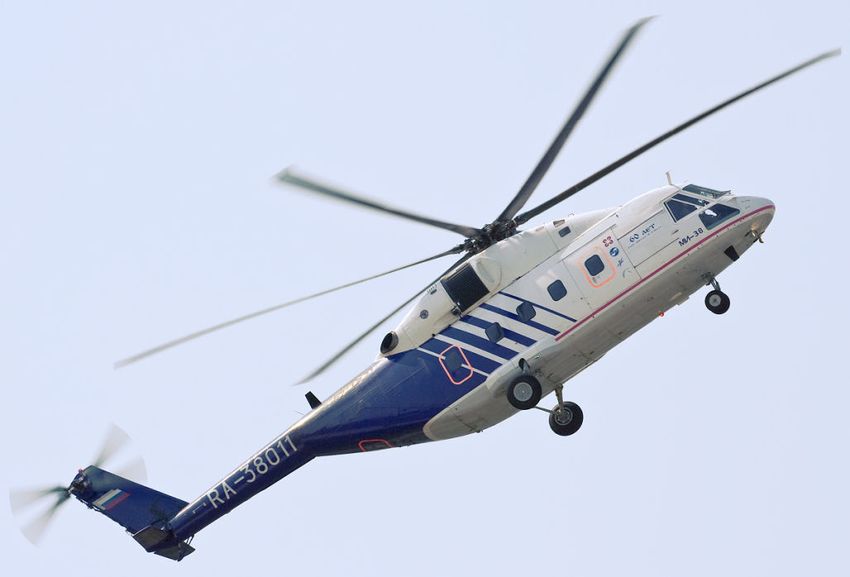
LIST OF ACRONYMS AND ABBREVIATIONS

List of Acronyms and Abbreviations

EU      - European Union
JTI     - Joint Technology Initiative
ITD     - Integrated Technology Demonstrator
ACARE   - Advisory Council for Aeronautics Research in Europe
GTOW    - Gross Takeoff Weight
SFC     - Specific Fuel Consumption
ECS     - Environmental Control System
VG      - Vortex Generators
SJA     - Synthetic Jet Actuators
CFD     - Computational Fluid Dynamics
RANS    - Reynolds Average Navier-Stokes
EAP     - Electro Active Polymer
CG      - Centre of Gravity
SL      - Sea Level
OAT     - Outside Air Temperature
MGB     - Main Gearbox
IPCS    - Instrument Panel Cooling System
ACCS    - Avionics Cabinet Cooling System
MCSP    - Merlin Capability Sustainment Program
APU     - Auxiliary Power Unit
AW      - Agusta Westland

                                        ix
NOMENCLATURE

Nomenclature

f     - flat-plate area
WF    - Weight of Fuel
δ     - Pressure Ratio
θ     - Temperature Ratio
CD0   - Drag coefficient based on frontal area
α     - Fuselage Angle of Attack
D     - Drag Force
q     - Dynamic Pressure
D100 - Drag Force, in pounds, corrected to a speed of 100ft/sec at SL and Standard
Conditions

                                             x
LIST OF FIGURES
List of Figures
Figure 1.1. European Commission's Seventh Research Framework Programme1..................................3
Figure 1.2. Environmental goals sets by ACARE1....................................................................................4
Figure 1.3. Integrated Technology Demonstrator’s1..............................................................................5
Figure 1.4. Areas of Technology Development for the Green Rotorcraft ITD1.......................................6
Figure 1.5. Predictions of main rotor power in forward flight (Ballin, 1987)..........................................7
Figure 1.6. Drag breakdown for typical 20,000lb single rotor helicopter (Keys & Wiesner, 1975)........8
Figure 1.7. Normalized specific fuel consumption and fuel flow for a notional turbo-shaft engine
(Leishman, 2006)....................................................................................................................................9
Figure 2.1. Helicopter/fixed-wing aircraft drag trends (Keys & Wiesner, 1975)..................................11
Figure 2.2. Effect of fuselage cross-section shape on drag (Keys & Wiesner, 1975)...........................15
Figure 2.3. Effect of streamlining on antenna drag (Keys & Wiesner, 1975).......................................17
Figure 2.4. Effect of BO-105 spoiler on lift and drag during cruise flight (Keys & Wiesner, 1975).......22
Figure 2.5. MBB BO-105 with a spoiler device implemented2.............................................................23
Figure 2.6. Effect of Strakes on the CH-46 helicopter fuselage drag (Keys & Wiesner, 1975)..............24
Figure 2.7. Effect of deflectors on helicopters upsweep (Seddon, 1983)...........................................25
Figure 2.8. Schematics of velocity profile and flow around VG at the fuselage upsweep...................26
Figure 2.9. “Diagram Sketch” of a zero-mass synthetic jet actuator (Hassan et al, 1998)....................27
1
Figures taken from the official website of the project, www.cleansky.eu
2
Figures taken from the website www,airliners.net
xiLIST OF FIGURES
Figure 2.10. US Army/Boeing MDX Active Flow Control wind tunnel model showing jet slot
configuration (Hassan et al, 2005).....................................................................................................28
Figure 2.11. Principle of actuation of a dimple (Dearing et al, 2007)...................................................30
Figure 2.12. Example of a Fenestron installation device on the Eurocopter EC-155B2........................32
Figure 2.13. Schematic picture of the NOTAR anti-torque system3....................................................34
Figure 2.14. Sikorsky X-49 concept flight test, based on the S-602.....................................................35
Figure 2.15. Image showing common engine installation mounted ahead, on the EC725 (left), and
behind, on the S76 (right), of the main transmission2........................................................................36
Figure 2.16. EH-101 showing two different types of engine installation2...........................................37
Figure 2.17. Westland World Speed Record G-Lynx in forward flight4................................................40
Figure 2.18. Sikorsky S-76 in hover condition where is possible to notice the various design
particularities of this model2.............................................................................................................41
Figure 2.19. The multirole combinations for the Sikorsky X2 Technology Demonstrator5...................43
Figure 2.20. Eurocopter AS-365N (SA 365N)2....................................................................................44
Figure 2.21. Mil Mi-38 during a product exhibition flight2..................................................................47
Figure 2.22. Kamov Ka-92 mock-up concept to demonstrate the project guidelines5.........................48
Figure 3.1. Variation of the fuselage pitch attitude depending on airspeed for three CG positions....51
Figure 3.2. Graph representation of the fuselage pitch attitude, depending on: a) airframe drag, b)
fuselage lift, c) horizontal stabilizer lift and d) horse-power required; flying at SL with middle CG
position..........................................................................................................................................52
3
Figure taken from the website commons.wikimedia.org/wiki/File:NOTAR_System.svg
4
Figure provided by Agusta Westland
5
Figures taken from the website www.flightglobal.com
xiiLIST OF FIGURES
Figure 3.3. Graph representation of the fuselage pitch attitude, depending on: a) airframe drag, b)
fuselage lift, c) horizontal stabilizer lift and d) horse-power required; flying at SL with forward CG
position..........................................................................................................................................53
Figure 3.4. Graph representation of the fuselage pitch attitude, depending on: a) airframe drag, b)
fuselage lift, c) horizontal stabilizer lift and d) horse-power required; flying at SL with after CG
position..........................................................................................................................................54
Figure 3.5. Graph representation of the fuselage pitch attitude, depending on horse-power required,
for: a) middle CG position, b) forward CG position and c) after CG position; comparing the data
obtained between SL and 4000ft.....................................................................................................55
Figure 3.6. Graph representation of the fuselage pitch attitude, depending on fuel flow, for: a)
middle CG position, b) forward CG position and c) after CG position; comparing the data obtained
between SL and 4000ft...................................................................................................................56
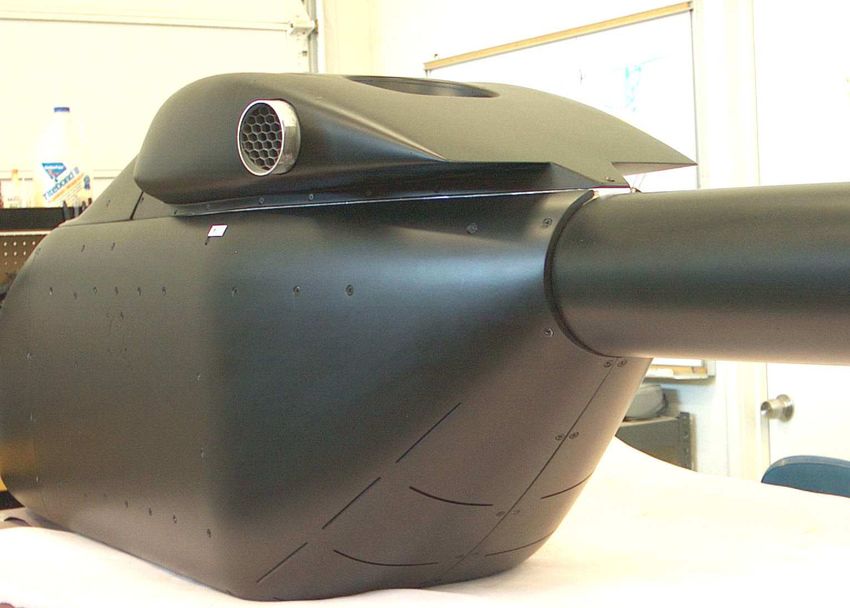
Figure 3.7. Picture of the port side of the fuselage showing the flush ambient air intake2................59
Figure 3.8. Picture of the avionics cabinet cooling system intake used2............................................60
xiiiLIST OF TABLES
List of Tables
Table 2.1. Drag audit of an hypothetical, recently designed, heavy-sized helicopter.................12
Table 2.2. Drag Breakdown at 216kts with a -6⁰ Fuselage Pitch Attitude (Perry, 1987).............39
Table 2.3. Airframe Parasite Drag Reduction on SA 365N (Roesch, 1980)..................................46
Table 3.1. Variable input values used to evaluate the Active Horizontal Stabilizer simulation..51
Table 3.2. Presentation of the optimum horizontal stabilizer angle for each flight configuration
analysed, with the respective fuel flow and horse-power required and saved........................57
Table 3.3. Properties of the Cooling Systems considered for this research................................61
Table 3.4. Theoretical improvements that can be made on Cooling Systems, globally and for
each group...................................................................................................................................61
Table A.1. FDS program simulation data for middle CG position at SL.........................................G
Table A.2. FDS program simulation data for forward CG position at SL.......................................H
Table A.3. FDS program simulation data for rearward CG position at SL.......................................I
Table A.4. FDS program simulation data for middle CG position at 4000ft...................................J
Table A.5. FDS program simulation data for forward CG position at 4000ft.................................K
Table A.6. FDS program simulation data for rearward CG position at 4000ft...............................L
Table B.1. Table of fuel flow per engine......................................................................................M
xivGonçalo Pereira
INTRODUCTION
Chapter 1
INTRODUCTION
1.1 Objectives
The purpose of this work is to give an overview through all the technology
available nowadays that could help to get a solution for the last major problem faced by
the Aeronautic Market, to bring the latest EU demands into reality. In this document,
priority will be given to the reduction in airframe drag of medium to heavy-helicopters
by gathering all the information available in literature cited. Continuing with this
subject, various academic and industry methods are presented to improve the
aerodynamic characteristics for the Rotorcrafts.
The next step is to make an analytical research of helicopter efficiency, divided
into two main subjects. During the first study, consideration will be given to the
possibility of implementing an Active Horizontal Stabilizer that can optimise the pitch
attitude during forward flight. The second topic is to examine current diverse Cooling
Systems implemented on heavy-sized helicopters with the objective of producing a
theoretical way of making one global Cooling System that could improve the overall
drag characteristics.
1.2 Clean Sky
Air Transport Systems, nowadays, are one of the most important elements for
society, having a decisive role in making the world a global community through
interaction of different cultures and promoting economic growth across the globe.
1Gonçalo Pereira
INTRODUCTION
The Clean Sky project is a “Joint Technology Initiative” (JTI)6 which will
develop some new technology solutions to reduce the negative impact of the air
transport on the environment. This is one of the largest European research projects to
date, supported equally by the European Commission and Industry partners with a
budget estimated at 1.6 billion Euros, where 160 million of them are intended to the
rotorcraft Integrated Technology Demonstrator (ITD), managed over the period 2008-
2015, representing 86 organizations and 16 countries. The concepts developed through
this initiative will provide technological breakthrough developments and will frame
them in market scenarios with solutions tested on Full Scale Demonstrators (established
in 2013-14).
Therefore, Clean Sky JTI will try to implement new, radically greener Air
Transport products that will:
• Provide a quick response to the Aeronautics Industry in the delivery of
technology to markedly improve the environmental impact of the air quality;
• Improve the European Industry competitively, in order to contribute to the
European Union objectives;
• Take leadership that serves to inspire the rest of the aviation world to provide
greener products.
The next figure represents a diagram of what will be the framework schedule
expected for the Clean Sky project, specifying the years with their respective task,
giving an overall understanding of this initiative.
6
“JTI is a type of project created by the European Commission for funding research in Europe to allow
the implementation of ambitious and complex activities, including the validation of technologies at a high
readiness level. The size and scale of JTI requires the mobilisation and management of very substantial
public and private investment and human resources.”
2Gonçalo Pereira
INTRODUCTION
Figure 1.6. European Commission's Seventh Research Framework Programme
Content
This quick research process, offered by Clean Sky, represents an unprecedented
opportunity for accelerated advance in the implementation of green technology in the
Aircraft Industry.
During the time granted for this project, technology breakthroughs will be
demonstrated and validated in order to make major steps towards the environmental sets
by the Advisory Council for Aeronautics Research in Europe (ACARE) – the European
Technology Platform for Aeronautics & Air Transport and to be achieved by 2020.
In the figure below are shown the three different goals sets by ACARE to
improve the environmental aspect involved on this project, linked with each group of
technology domain required to achieve the objectives.
3Gonçalo Pereira
INTRODUCTION
Figure 1.7. Environmental goals sets by ACARE
The Clean Sky JTI is made up of six Integrated Technology Demonstrators
(ITD):
• SMART Fixed Wing Aircraft: development of an active wing technology and a
new aircraft configuration for breakthrough performance;
• Green Regional Aircraft: proposal for low-weight aircraft with smart structures,
coupled with low external noise configuration, as well as the implementation of
other ITDs technologies (such as engines, energy management and new system
architectures);
• Green Rotorcraft: improvements around innovative rotor blades and engine
installation for noise reduction, reduced airframe drag, integration of diesel
engine technology and advanced electrical systems for elimination of noxious
hydraulic fluids and fuel consumption reduction (which constitutes a teaming of
Eurocopter/AgustaWestland leader initiative);
• Sustainable and Green Engines: produce five engine demonstrators to integrate
technologies for low noise and lightweight low pressure systems, high
efficiency, low NOx and low weight cores and novel configurations such as
open rotors and intercoolers;
• Systems for Green Operations: attention made to all-electrical equipment and
systems architecture, thermal management, capacity to accomplish “green”
4Gonçalo Pereira
INTRODUCTION
trajectories/missions and improved ground operations to reach extensive benefits
of Single European Sky;
• Eco-Design: focus on green design and production activities, withdrawal, and
recycling of aircraft, through an optimized use of raw materials and energies
thus improving the environmental impact of the whole products life cycle.
In figure 2.3 is possible to understand the working flow implemented for the
interaction between the six independent ITD’s and the simulation facility - Technology
Evaluator.
Figure 1.8. Integrated Technology Demonstrator’s
All of the developments will be assessed by the Technology Evaluator, which is
a simulation facility that will assess the performance of the technologies following their
review. This provides a process of looking at trade-offs, as some technologies may
prove to have a more significant impact than others. The evaluation process will
additionally enable the program to have coherent, unified and efficient development and
structure.
5Gonçalo Pereira
INTRODUCTION
Green Rotorcraft
Progressively, rotorcraft operations are growing to meet the demands of the
European population. This effect can be seen in the following areas: medical service for
safe and quick transport of patients and living organs for transplantation, passenger
transport from city heliports to airports, and also between cities or areas where an
efficient surface transport network cannot be developed for geographical or economical
reasons.
The figure 1.4 outlines the goals to be achieved by the Green Rotorcraft ITD at
the end of the Clean Sky project.
Figure 1.9. Areas of Technology Development for the Green Rotorcraft ITD
The Rotor blades designed or modified by the Green Rotorcraft initiative are
expected to have enhanced capabilities by passive methods and active control
techniques to reduce impulsive air loads and as a consequence, the radiated noise. At the
same time, attention will be given to the turbo-shaft engine installation, improved with
both the re-design of air intakes and exhaust nozzles to minimize the noise especially in
hover and low speed flight conditions.
With the same weight of importance, “cleaner and more efficient power use”
provides a need for development of aerodynamic subjects such as:
6Gonçalo Pereira
INTRODUCTION
• Design of features on the airframe for the reduction of aerodynamic drag and
download in cruise flight conditions;
• Engine integration through the adaptation of Diesel engine technology to light
helicopters and turbo-shaft engine installation optimised for minimal power loss;
• Innovative electrical systems architectures enabling energy management
optimisation on helicopters, implementing generic principles within the Eco-
Design ITD.
1.3 Parasitic Power
One of the most important subjects related to helicopter performance is the
parasitic power (or parasite drag). During the past years, a major effort has been taken
to try to reduce this contribution for “dirty” designs. The parasitic power is known as a
power loss generated from the viscous shear effects and flow separation on the airframe,
tail, rotor hub, and various other sources on the aircraft frame/structural components.
Through the overview of the next graph on Figure 1.5, this source of drag can be very
significant as the helicopter advances at higher forward flight speeds, because helicopter
airframes are much less aerodynamic than equivalent fixed-wing counterparts.
Figure 1.10. Predictions of main rotor power in forward flight (Ballin, 1987)
7Gonçalo Pereira
INTRODUCTION
At the present time, it is usual to see values of f (equivalent wetted area or
equivalent flat-plate area) - ranging from 10ft2 on light helicopters to 50ft2 on
medium/heavy helicopter designs (Leishman, 2006 (1)).
The next figure illustrates the parasite drag portions produced by each
component, or group of components, for current production configurations and for new
designs.
Figure 1.6. Parasite Drag breakdown for typical 20,000lb single rotor helicopter (Keys & Wiesner,
1975)
The power required in forward flight is also a function of helicopter weight.
Normally, the final performance results are represented in terms of gross takeoff weight
(GTOW) because the fraction of fuel carried, relative to gross weight, is very small.
Thereby, the excess power available becomes progressively less with the increase of
GTOW, and it’s more perceptible at lower speeds where the induced power constitutes a
larger portion of the total power.
1.4 Engine Installation
Within the helicopter industry, there are three different types of turbine engine
installation. For the two first approaches, the engine is mounted either directly ahead or
behind the main transmission, depending on if they are frontly or rearly driven
8Gonçalo Pereira
INTRODUCTION
respectively; the engines could also be mounted on both sides of the transmission with
the addition of angle drive gearboxes. For any of these configurations, there are
advantages and disadvantages.
When the turbine engines are mounted forward or aft, an increase on the cross sectional
area is avoided to accommodate them, but there are known complications with both
inlets and exhausts. It is common to use simple pitot intakes on front mounted engines,
but the exhausts end being directed sideways, which incurs an inherent moment drag;
the rear mounted engines normally involve double bends in their inlet ducts with
attendant power losses.
A different option is to have turbine engines mounted on both sides, which are
preferable in terms of accessibility, balance and battle damage points of view. This type
of engine configuration does not place any restrictions on the inlet or exhaust design;
however this installation tends to increase frontal area and interference drag
(particularly on the rotor hub).
Knowledge of the engine fuel burn is always required for an easy understanding
of various performance problems, such as the range and endurance type of calculations.
Engine performance data are usually expressed in terms of specific fuel consumption
SFC (in units of lb/hp.hr or kg/kW.hr) versus shaft power (in units of hp or kW) as it
can be seen on Figure 1.6 below.
Figure 1.7. Normalized specific fuel consumption and fuel flow for a notional turbo-shaft engine
(Leishman, 2006)
9Gonçalo Pereira
INTRODUCTION
10Gonçalo Pereira
LITERATURE SEARCH
Chapter 2
LITERATURE SEARCH
2.1 Introduction
The current in-service helicopters hold parasite drag levels are far in excess of
equivalent fixed wing aircraft. As shown by Keys & Wiesner (1975), a 20,000 lb
helicopter would have approximately ten times the parasite drag of a turboprop airplane
with the same gross weight, and at a speed of 150 knots this drag accounts for 45
percent of the total power required. Therefore the importance of reducing helicopter
cruise power requirements is increasingly evident in light of the higher speed demanded
of new helicopter designs and the current energy crisis (Leishman, 2006 (1)).
The graphic represented on figure 2.1 is a way of showing the benefits that can
be reached in terms of drag through a proper guideline for drag reduction on future
production helicopters.
Figure 2.1. Helicopter/fixed-wing aircraft drag trends (Keys & Wiesner, 1975)
11Gonçalo Pereira
LITERATURE SEARCH
Regarding an actual vehicle design, there are many varied design requirements
with associated geometric constraints which may adversely affect the drag. In most
cases they are not entirely rigid and may be traded off to a certain extent with the
generally conflicting criteria for low drag. Unfortunately, this trade-off may be very
difficult to quantify in terms of the estimated drag reduction with its anticipated benefits
versus the possible penalties. The capability to adequately examine and quantify the
effect of a design change becomes available to the industry through improved
mathematical modelling techniques (Williams & Montana, 1975). There are available
data on helicopter parasite drag reduction but relatively little flight test data. Although
the tunnel data drag reduction experiences already made rarely progresses to production
mainly because the customer does not set a very high priority on low drag in his
specification (Gatard et al, 1997).
It is widely known that the fuselage is the largest airframe component on a
helicopter (although if well designed can have relatively low drag), so its aerodynamic
characteristics can have a significant impact on the performance of the helicopter as a
whole. Practical constraints, such as the need for rear loading doors, means that the
shapes that are typical of helicopter fuselage designs often tends to flow separation and
high drag. In addition, the airframe often operates in the main rotor wake, which
changes the aerodynamic characteristics compared to those obtained without the rotor
(Wilson & Ahmed, 1991).
Table 2.1. Drag audit of an hypothetical, recently designed, heavy-sized helicopter
ITEM Drag Portion (%)
Basic Fuselage 18,59
Cowls 11,19
Hub 17,72
Stubs 5,51
Shanks 3,44
Blade Roots 1,72
Rotational Effect 2,58
Sponsons 5,34
Empennage 6,88
Tail Rotor Head 5,16
Cooling 5,86
Engine Drag -0,34
Aerials & Excrescences 16,01
Flotation 0,34
12Gonçalo Pereira
LITERATURE SEARCH
Through the overview of the drag audit presented on the table above, on recent
production medium to heavy-sized helicopters, it is usual to find fuselage parasite drag
values, with all of the components fitted, accounting for 60-70% of the total parasite
drag.
A prospective improvement in helicopter capability due to a decrease in drag
and a consequent increase in efficiency appears to be very substantial. In addition to the
more obvious aspects of increased range, payload, and maximum speed, there are
several additional payoffs which are not as apparent. One of these is the reduction in
aircraft size and gross weight needed to perform a given one mission. An increase in
efficiency due to a reduction in drag produces an associated reduction in power required
which in turn reduces engine/drive system size and results in reduced weight. The
reduced size and weight further reduces power required, and so on until the design
process converges. This multiplicative effect is only possible if a drag reduction is
introduced in the early design stages – before the aircraft configuration is frozen
(Gormont, 1975); (Hermans et al, 1997).
The consequence of a considerable reduction in parasite drag must be assessed
from the point of view of the entire aircraft system. The possible benefits are strongly
dependent on the particular helicopter mission/role; for instance, each of the five
primary “performance missions” – range, payload, speed, endurance and hover have
somewhat separate implications for drag. Adding the performance aspects, there are
numerous operational requirements which should also be assessed in terms of drag.
Each of these is amenable to design compromise so that the aerodynamic drag can be
minimized while still permitting maximum operational effectiveness.
Another critically important factor is the cost trade-off – design / development /
production / maintenance and operational costs (which include both direct fuel and fuel
logistics costs). It can be demonstrated that, for many missions, it is entirely possible to
develop smaller, lighter and cheaper aircrafts by designing for low drag; however, this
only happens if a low drag philosophy is implemented in the initial design stage
(Duhon, 1975).
One aerodynamicist is always trying to find ways to reduce drag, but his ideas
usually cost money and weight. Therefore he has to sell his ideas to the weight and cost
people. Any effort to reduce helicopter parasite drag must be evaluated in terms of its
13Gonçalo Pereira
LITERATURE SEARCH
effect on the helicopter’s weight, cost to manufacture, and cost to operate. Two factors
in the current environment – Design to Cost and the soaring price of fuel – make it more
important than ever to look carefully at the value of a particular drag reduction
approach. Design to Cost is a factor not only in military procurement, but is also deeply
involved in the competitive field of commercial helicopter sales. Therefore any added
cost attributed to drag reduction must balance favourably against the overall benefits it
brings. Fuel costs, which used to be almost negligible in the total cost of owning and
operating a helicopter, are now quite significant, and thus emphasis are added on
improving cruise efficiency. Undoubtedly now, more than ever before, the stage is set
for a vigorous attack on parasite drag reduction (Stroub & Rabbot Jr., 1975); (Wiesner,
1977).
The most important effect of drag on rotorcraft flight, of course, relates to
vehicle performance. Although efforts to minimize drag are directed substantially
toward maximizing speed and fuel economy, it is worthwhile, and often essential, to
consider the relationship between drag and flight dynamics characteristics.
Given that drag reduction procedure impacts aircraft stability, variations in the
vehicle design will probably be indicated to correct the stability modification. Design
variations like this should be anticipated so their cost, weight, and other factors can be
considered in assessing the merit of the drag reduction procedure.
As soon as analysis and test programs are instigated for the study and
improvement of the rotorcraft drag problem, the activities should be conducted to gather
the most useful technical information for the cost. For that reason, when an analysis or
test is designed specifically to consider drag issues, minimal additional effort would
yield extremely useful stability information. Measuring fuselage stability derivatives as
part of a drag measurement wind-tunnel test is a good example. In order to carry the
stability and control aspects of drag reduction along the projected course, it is first
necessary to identify connections between the problems (Hoffman, 1975); (Gleize et al,
2001).
14Gonçalo Pereira
LITERATURE SEARCH
2.2 Sources of Performance Loss
2.2.1 Fuselage
Beginning with the Nose Section, the major problem is concerning to the corner
radii adopted to any model, in order to achieve a low drag nose shape. Therefore, every
time the corner radius to fuselage width ratios reaches values below 0.1, there will be a
noticeable increase in drag. In the other way, the Nose Section is relatively insensitive
to contour (symmetrical/asymmetrical) from a drag point a view.
In the Cabin Section, when the aircraft flies with negative incidence, the drag
rise of a square section is four times greater than a circular. Simultaneously with this,
windows and doors located at the Cabin Section can produce drag by themselves if they
are not flush with the surface contours.
The chart in the next figure shows two principal theoretical cross-sections with
the intention of comparing it with a typical helicopter fuselage shape.
Figure 2.2. Effect of fuselage cross-section shape on drag (Keys & Wiesner, 1975)
15Gonçalo Pereira
LITERATURE SEARCH
One of the most critical sections of helicopters is the After-Body. This region
represents the largest drag contributing area of the airframe. Supporting this, if a
contraction ratio (l/D - contraction length/equivalent cabin diameter) below 2.0 is
reached, will be present a flow separation increasing the after-body pressure drag.
Another important design issue to look here is the negative after-body camber (which
shifts the fuselage zero angle of attack) and the minimum drag point angle for cruise
conditions, because this has a tendency to increase the drag and cruise download (Clar
& Wilson, 1980); (Polz & Quentin, 1981); (Seddon, 1982); (Epstein et al, 1994).
Regarding to the overall airframe, any sudden changes in curvature such as
rivets or sharp edges around doors are likely to increase parasite drag values due to
unnecessary flow separation. Apart from this, all the leakages such as holes and recesses
or large size and number of bluff-body surfaces, like fairing designs, will be penalized
with a drag increment (Gaudet, 1987).
Another usual source of parasite drag is the Cowls. As these are additional items
added to the basic fuselage, they create drag by the increment of the frontal area and
change of profile. One common reason for this implementation is for stability purposes,
but the main drawback to a full fairing is the increase in mass, along with the
complexity of access (growing maintenance time to remove/refit fairings and thus
costs). But on the other hand, we can find a high base drag on side mounted engine
cowls that could be responsible for almost 50% of general cowling drag.
One of the last design improvements achieved in the wake around the hub is the
pylon fairing, which is closely linked to the aerodynamics of the rotor head.
Implementing this pylon geometry in the aircraft, the interference drag between hub and
fuselage is decreased, but the frontal area of this fairing creates drag by itself
(maximizing the adverse pressure gradient when the pylon largest frontal area is before
of the rotor hub.
Parallel with the overall design of the airframe, the landing gear is an important
item when the parasite drag subject is approached. When the option of implementing a
skid gear is taken, additional drag will be added because of the increment on frontal
area. Still, the use of this concept is 40% lower in drag than fixed wheeled gear
(Harrington, 1954).
A common decision adopted on the latest heavy-sized helicopters is the use of
sponsons. But as this item can be seen as a protuberance, it reduces the aerodynamic
16Gonçalo Pereira
LITERATURE SEARCH
efficiency of the fuselage adding weight and drag to the airframe. When this component
lacks aerodynamic design, large drag penalties will be added to the airframe.
With the same importance, the empennage is another vital design item that needs
extremely care . So, the effectiveness of a lifting surface here, such as a fin or a tail
plane, can suffer as a result of a gap between the surface and the fuselage or a cut-out in
the leading edge. Such is the case when providing ventilation for an intermediate
gearbox. Together, where a tail plane or a tail rotor gearbox fairing is located on the fin,
particularly if there is an interference with the leading edge, there is a danger of flow
breakdown which can reduce fin effectiveness and create excessive drag. Finally, a less
careful shape design in the horizontal stabilizer and the vertical fin will increase normal
tail download condition and tail rotor fin drag, respectively.
2.2.2 Protuberances
The main problem of this group of items is the quantity that can be found on any
modern helicopter, reaching a considerable percentage of parasite drag.
Aerials have a negligible effect on drag individually, but can be significant due
to the numerous amounts of them on aircraft. As they, normally, are not taken into
account to be aerodynamically efficient, a bad positioning of externally mounted
antennas could result in a considerable increment to parasite drag (Lowson, 1980).
This graph presented on figure 2.3 demonstrates the influence of aerials
(Antenna) on the helicopter drag, giving the example of two different sections.
17Gonçalo Pereira
LITERATURE SEARCH
Figure 2.3. Effect of streamlining on antenna drag (Keys & Wiesner, 1975)
As an optional item for helicopters, the radome is one of the most problematic
issues in relation to drag. The main factors affecting radome drag are: a) radome
diameter, b) radome depth, c) radome location (aft of nose), d) lower edge radius, e)
presence or otherwise of splitter. The factors (a) and (b) are governed by the radome
size requirements and little can be done to influence the dimensions. The radome
location is usually dictated by practical (structural) considerations but does have a small
effect on drag. A radome can cause stability problems by vortex shedding especially
when placed under the nose.
In the excrescences, any external component that is not retractable or flush with
the fuselage will add drag penalties to the project as with careless undercarriage doors
design. For the components located on the exterior of the aircraft that shows
considerable frontal area and hence the drag area, as well as incorrect positioning, will
create instabilities in the design and therefore increasing drag. The airflow over the
fuselage varies considerably in speed from one location to another. The same item fitted
in a region of high speed flow will create far more drag than if it were fitted in a region
of slow moving air (Greenwell, 1997).
When one helicopter model is designed for Navy roles, it is common to
incorporate a flotation system. Normally this system is divided in four inflatable bags,
18Gonçalo Pereira
LITERATURE SEARCH
two on both aft sides and another two on either sides of the nose. Therefore, when these
components are not fitted flush on the airframe, they increase the pressure drag. In
external applications, there will be drag penalties for the changed structural design
shapes.
2.2.3 Cooling Systems
One of the most important matters for all the mechanical and electronic
components in the aircraft is the cooling systems. Environmental Control Systems
(ECS) of the aircraft require ducts to drain the air, which will tend cause spillage and
ram drag, and at the same time there is potential for drag to be caused by the exhaust
system of the cooling but the effect will vary based on the direction of the outlet. One of
the best examples to verify this effect is on the cooling intake and exhaust areas for the
intermediate and tail rotor gearbox mounted on the empennage, where excessive intake
areas will penalize the design with excessive spillage and ram drag.
2.2.4 Engine Installation Performance
It is well known that the engine installation on helicopters is a very sensitive
method, where any decision has pros and cons. Depending on size and number of
engines that one model can include, there are various different configurations that can
be adopted on the upper surface of the airframe, but parasite drag will be increased for
any of those configurations at least by bigger frontal area influence. Location is also
important to obtain sufficient flow and avoid the ingestion of hot air from exhausts or
cooling outlets, therefore increasing the power losses (Perry, 1979).
The performance around engine installations on helicopters airframe generally
results in deteriorated properties when compared to the engine manufacturer’s
performance specifications. It is normally settled that the engine installation losses can
be divided into inlet losses, exhaust losses, and losses due to bleed air extraction
(Stepniewski & Keys, 1984). A succinct discussion of each of these three subjects is
presented next:
19Gonçalo Pereira
LITERATURE SEARCH
• Inlet losses usually occur with either a rise in temperature or a pressure drop at
the inlet. During hover flight, the principal effect is the temperature rise due to
the recirculation of hot exhaust gases which happens mainly in ground effect. It
is also seen that, for installations with the gearbox located in front of the inlet, a
noticeable rise in inlet air temperature can be identified. Pressure losses
generally result from flow disturbances or separation at, or ahead of, the inlet;
this is especially noticed in forward flight, where flow separation may end in
sizeable pressure losses; however, these losses are often offset by a decrease in
flow velocity and an increase in air pressure as it enters the inlet (ram recovery).
When particle separators or screens are installed, additional considerable losses
may occur both in hover and forward flight.
• Exhaust losses are commonly caused by backpressure normally resulting from a
redirection or rerouting of the exhaust air flow, from the installation of
equipment such as an infrared suppressor, or from nozzeling to reduce parasite
drag.
• Extra losses are added to the installation if bleed air is extracted from
compressor for anti-ice protection of the engine inlets when operating under cold
ambient temperatures or for cabin or cockpit air-conditioning systems under hot
ambient conditions.
The engine installation losses are minimized for designs having podded engines
because the engines are essentially detached from the airframe. With flight test data
experiences, the power losses for this type of installation are generally less than one
percent. Consequently, the one-percent loss assumed that there is no increase in the
power available due to ram recovery effects in forward flight.
The presumably loss of power due to the inlet pressure drop (as a result of
engine installation) also leads to a consequent decrease in fuel flow. Typically, a loss in
pressure will result in a reduction in fuel flow of 0.5 percent or less for each one-percent
decrease in power available, thus resulting in a net increase in SFC. On the other side, a
temperature rise will produce approximately equal power and fuel flow reductions
without any net SFC change.
20Gonçalo Pereira
LITERATURE SEARCH
2.3 Performance Improvements Methods
2.3.1 Passive Drag Reductions
2.3.1.1 Design Aspects
In order to achieve an optimal airframe concept, there are several practical
design guidelines to follow so the helicopter can be as efficient as all the means
available nowadays allows it to be. Therefore, will be presented next a group of
particularities that can make the difference on the design:
• The corner radii of the nose shape should be kept with corner radius to fuselage
width ratio below 0.1 in order to avoid drag increments;
• It is preferable to use a cabin cross-section almost circular, so the drag rise can
be minimized when the aircraft face negative fuselage incidences;
• Windows and doors should be flush with the surface contours and door tracks
recessed to reduce the flow discontinuities along the fuselage;
• Make a carefully tapering of the after body lines gradually to avoid flow
separation, contraction ratio of at least 2.0 is required to obtain minimum after-
body pressure drag;
• Effort should be made to avoid negative after-body camber (shifts the fuselage
zero angle of attack) and the minimum drag point to more positive angles
because it tends to increase the drag and download on cruise conditions;
• Any sudden changes in curvature such as rivets, or sharp edges around doors,
should be implemented as flush as possible;
• Attention should be given to leakages such as holes and recesses, size and
number of bluff body surfaces and fairing designs of high frontal area;
• In terms of airframe aerodynamics, ideally, the landing gear should be
implemented as retractable with flush covering doors so no drag can be
associated to it;
• Inverse cambered horizontal stabilizer and a cambered vertical fin to minimize
drag of the normal tail download condition and the tail rotor fin combination,
respectively, in cruise flight;
21Gonçalo Pereira
LITERATURE SEARCH
• Try to fit in some aerials embedded in the tail plane or even change their cross
section would reduce their aerodynamic impact;
• The use of fairings and selective positioning can result in a sizeable drag
reduction on protuberances because for components located on the exterior of
the aircraft it is good practice to minimise the frontal area and hence the drag
area, and it is also a good idea to place components behind one another so that
the latter excrescence is in the wake of the preceding;
• Any component that is external to the fuselage should ideally be retractable into
the fuselage, the undercarriage should be retractable as well and should be used
undercarriage doors to minimize drag even further;
• The Flotation System should be as flush as possible through the fuselage in
order to don’t produce pressure drag;
• The inclusion of a splitter, located behind the radome, reduces drag and gives
better, steadier flow behind the radome.
2.3.1.2 Spoiler
As an additional item (excrescence), the Spoiler is a device mainly used for
stability purposes, deflecting the turbulent fuselage wake away from the tail plane
increasing their directional stability and consequent effectiveness. Another consequence
obtained from it, is a positive camber effect that can be beneficial for drag. Normally
this device is located at the after-body region, where upsweeping is due to start. Because
of the added lifting effect of the spoiler at cruise speeds, this creates nose down
moments which, unless another devices are added to counteracts, could lead to an
undesirable effect.
The next figure represents the aerodynamic study made on the spoiler
implementation for the BO-105, in terms of drag and lift.
22Gonçalo Pereira
LITERATURE SEARCH
Figure 2.4. Effect of BO-105 spoiler on lift and drag during cruise flight (Keys & Wiesner, 1975)
While negative camber provides an unfavourable increase in drag, positive
camber can be employed to shift the drag bucket to a desired nose down cruise angle of
attack. An industry example is the spoiler installation on the BO-105, which was
designed to deflect the turbulent fuselage wake and trailing vortices away from the tail
rotor, thereby improving directional stability. This installation consists of a 2 ft2 flat
plate mounted on the lower portion of the fuselage. As shown in the following Figure x,
the positive camber effect caused by this installation reduced the fuselage drag by an
amount equal to the pressure drag of the spoiler, and resulted in no drag penalty at the -
7o cruise angle of attack.
The image shown on figure 2.5 is the rear view of the BO-105 where is possible
to notice the yellow spoiler device, implemented on the upsweep.
23You can also read