DUBE TRADEPORT COTTONLANDS INDUSTRIAL PARK SOCIO-ECONOMIC IMPACT ASSESSMENT - SAHRIS
←
→
Page content transcription
If your browser does not render page correctly, please read the page content below
SEIA FOR DUBE TRADEPORT COTTONLANDS INDUSTRIAL PARK – DRAFT 1 FOR COMMENT – 27/02/2017

Socio Economic Impact Assessment Tradezone 4
(Cottonlands) - 2016

DUBE TRADEPORT COTTONLANDS
INDUSTRIAL PARK SOCIO-
ECONOMIC IMPACT ASSESSMENT

      Page 1 of 62
SEIA FOR DUBE TRADEPORT COTTONLANDS INDUSTRIAL PARK – DRAFT 1 FOR COMMENT – 27/02/2017

                                            Prepared by:

                                Urban-Econ Development Economists
                                   P O Box 50834, Musgrave, 4062
                                          Tel: 031-202 9673
                                  Email: durban@urban-econ.com

                                            Prepared for:

                                    Element Consulting Engineers
                                 PO Box 1071, Westville, Durban,3630
                                          Tel: 031 266 9699

Page 2 of 62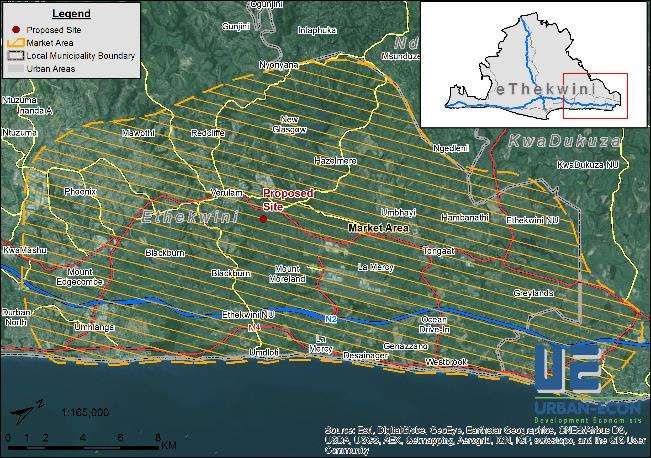
SEIA FOR DUBE TRADEPORT COTTONLANDS INDUSTRIAL PARK – DRAFT 1 FOR COMMENT – 27/02/2017

TABLE OF CONTENTS
1   Introduction ................................................................................................................................................................ 5

2   Spatial Analysis ........................................................................................................................................................ 10

3   Socio-Economic Profile ........................................................................................................................................... 15

4   General Market Trends ............................................................................................................................................ 18

5   Office, Residential, Retail and Industrial Trend Analysis ...................................................................................... 22

6   Market Assessment .................................................................................................................................................. 38

7   Socio-Economic Impact Assessment .................................................................................................................... 49

8   Recommendations .................................................................................................................................................. 57

Page 3 of 62

SEIA FOR DUBE TRADEPORT COTTONLANDS INDUSTRIAL PARK – DRAFT 1 FOR COMMENT – 27/02/2017

9   Mount Moreland – Socio-Economic Trend Analysis ............................................................................................. 60

Page 4 of 62
SEIA FOR DUBE TRADEPORT COTTONLANDS TRADEZONE 4
1 INTRODUCTION
INTRODUCTION
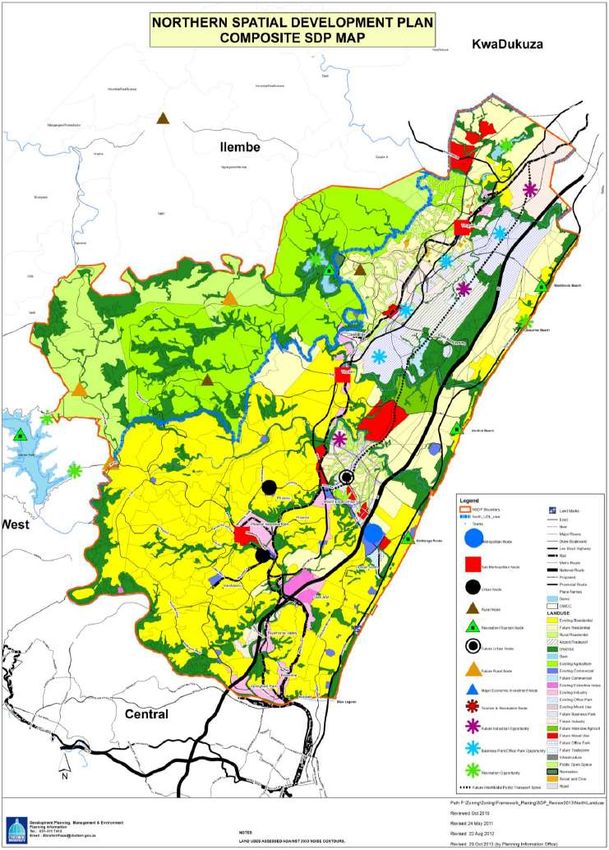
Dube Tradeport is centred around a 60-year masterplan which is illustrated in the image below, utilises 2 040 ha
greenfield site. The first phase has been completed by the KwaZulu-Natal (KZN) provincial Government and
Airports Company South Africa (ACSA), with an investment of R 8 billion.
Dube Tradeport consists of four strategic development zones. These include; Dube Cargo Terminal, Dube Trade
zone, Dube City and Dube Agri-Zone. Trade Zone 4 falls outside Dube City, located just 5 kilometres south west of
KSIA and is proposed to include premium office, retail, residential and industrially serviced area in an urban
precinct. This business support function forms an important aspect of the strategic plans for Dube Tradeport to be
positioned as South Africa’s premier logistics platform.
Map 1: Dube Tradeport 60 Year Masterplan
Source: Dube Tradeport, 2014
PURPOSE OF THE STUDY
The purpose of this study is to determine the potential socio-economic impact of the proposed Trade Zone 4
development on the neighbouring areas of Dube Tradeport (Verulam, Tongaat, La Mercy and surrounds) through
an initial scoping process, followed by a detailed input into the EIA process.
Page 5 of 62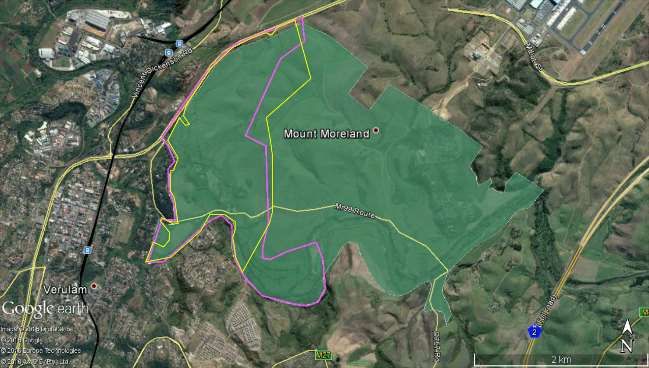
SEIA FOR DUBE TRADEPORT COTTONLANDS TRADEZONE 4
The socio-economic impact assessment is a key requirement for the Economic Impact Assessment (EIA) process
prescribed by the National Environmental Management ACT (NEMA) of 1998, as amended.
REPORT METHODOLOGY
The following figure illustrates the methodology used in undertaking the study.
Figure 1: Report methodology
Orientation and Policy Review
The purpose of the first step was aimed at obtaining all background information pertaining to the study area and
the proposed project. An intensive work session with the client and project stakeholders aimed at gaining clarity
on:
Existing role players and interested/affected parties;
Existing information and studies previously undertaken within the study area;
Timeframe and measurable deliverables and milestones.
Page 6 of 62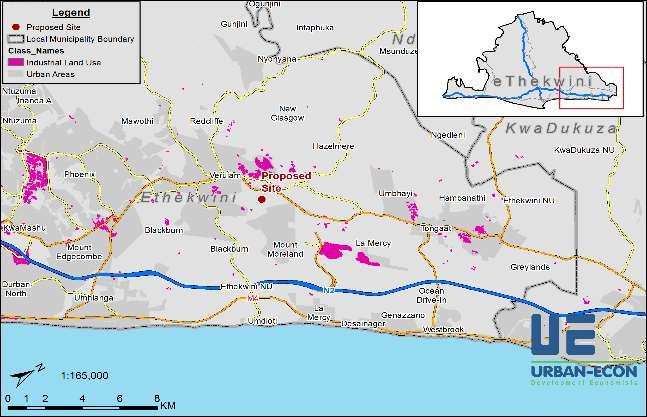
SEIA FOR DUBE TRADEPORT COTTONLANDS TRADEZONE 4
It was necessary to delineate the area into primary and secondary areas based on the information overview and
on close consultation with the client and other professional teams. It was also crucial to undertake site visits for
orientation purposes but also to obtain site specific intelligence.
Baseline Information and Trend Analysis
The purpose of this step was to review and collate all data to be able to compile a practical and up-to-date
quantitative profile of the study area to serve as baseline for the SAM modelling exercise. It is important to define
the study area as a sub-region and therefore the profile of the larger region must be interpreted and refined as
a sub-regional socio-economic profile.
Development Projections
Projections were undertaken and derived from national growth rates; sectoral production trends as well as
realistic local sectoral growth expectations resulting from physical, nodal and other planned changes in the area.
These changes feature as a structural adjustment of the economy over time.
The focus was to develop options, taking cognisance of the following:
Sectoral and structural economic changes;
Strategic development projects;
Infrastructural planning;
The type and extent of activities and land-uses;
The type of economic activities and potential projects;
Density of land uses and activities.
Demographic and socio-economic trends: Population projections were made based on existing demographic
knowledge and models. These were augmented with the verification data and up-to-date growth expectations.
These focussed on the regional economic growth expectations due to proposed projects and development
initiatives.
Economic Development Potential: The development potential of the economy was determined and in doing so
the historical growth trends and the strengths and weaknesses of the economy was addressed. A list of priority
and growth areas of the sub-regional economy that reflects the highest level of development potential and
comparative advantages was compiled. The economic information was interpreted in terms of the impact on
the household sector. The underlying principle is that economic growth will act as stimulus for urban growth and
hence domestic demand for services and infrastructure.
The potential analyses conducted were interpreted in terms of economic development opportunities. These
opportunities reflected the inherent development potential of the economy and in exploiting these opportunities,
the development potential of the economy can be maximised. These opportunities are presented as various
development scenarios.
Page 7 of 62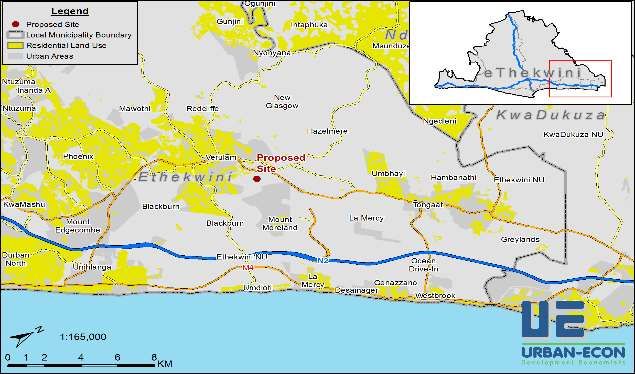
SEIA FOR DUBE TRADEPORT COTTONLANDS TRADEZONE 4
Impact Modelling
The focus of this step is to determine the economic benefits and impacts of the proposed project to the area and
broader region. A computerised model framework based on Urban-Econ’s in-house Input-Output Model was set
up and calibrated in accordance with the principles underlying the following User Requirements Specifications
(URS):
Spatial allocation options Economic growth and multiplier analysis
Scenario simulation Sensitivity analysis
This impact modelling was done by populating the SAM model with the quantified potential effects of the project
to quantify the spin-off effects in the economy. This illustrates the total benefit and dis-benefit, as well as the net
impact of the project over time.
When considering the impact of proposed interventions, several economic and user impacts can be
distinguished. These include:
o Direct user impacts
o Indirect and Induced impacts
o Construction and maintenance spending impact
Comparative Analysis of Options
The purpose of this step was to take cognisance of all work and simulation modelling done up to this stage and
undertake a comparative and integrated evaluation of options.
Net economic impacts: Any development can be associated with both positive and negative economic
impacts, where the former represents the increase in value added, employment, income, and tax base that
would result from the proposed project, while the latter reflects the loss of economic values by the existing
establishments as a result of the implementation of the proposed project. Since the extent of positive and
negative impacts can differ significantly, it is important that the net effect is determined, particularly when
comparing different options.
The focus of this step was to integrate the assessments conducted in the previous steps to compare the total
direct and indirect effects, to provide a basis for decision making and selection of options. The analysis
determined and quantified the extent and magnitude of the impacts and effects. The various measures of
economic impacts have very different interpretations:
Total employment reflects the number of additional jobs created by economic growth. This is the most
popular measure of economic impact because it is easier to comprehend than large, abstract Rand
figures. The total employment can be interpreted in terms of generally accepted definitions of job
creation.
Aggregate personal income rises as pay levels rise and/or additional workers are hired. Either or both of
these conditions can occur as a result of business revenue growth. As long as nearly all of the affected
Page 8 of 62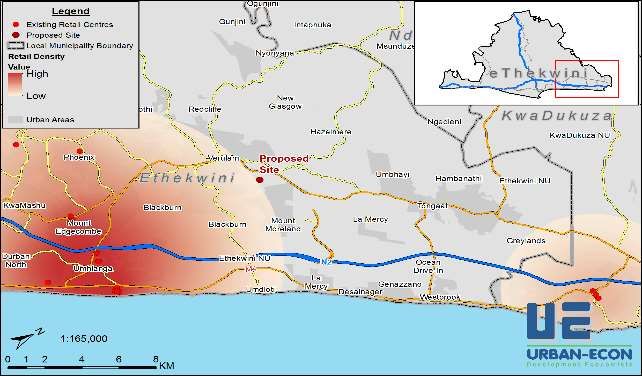
SEIA FOR DUBE TRADEPORT COTTONLANDS TRADEZONE 4
workers live in the study area, this is a reasonable measure of the personal income benefit of a project or
program.
Value Added (which is normally equivalent to Gross Domestic Product or Gross Regional Product) is a
broader measure of the full income effect. This measure essentially reflects the sum of wage income and
corporate profit generated in the study area. However, in today’s increasingly global economy, value
added can be an overestimate of the true income impact on a local area, insofar as it includes all
business profit generated there.
Business Output (also referred to as revenue or sales volume) is the broadest measure of economic
activity, as it generates the largest numbers. It includes the full (gross) level of business revenue, which
pays for costs of materials and costs of labour, as well as generating net business income (profits).
Property Values are also a reflection of generated income and wealth. When property values rise in a
community as a result of increasing demand for property which may be a direct consequence of
increasing aggregate personal income or investment of business profits.
Implications
The purpose of this step was to identify the implications of the proposed project in terms of regional economic
impacts and assess the implications of the impacts. The regional profiling undertaken in the preceding steps was
utilised as a baseline. Specific variables to evaluate the impacts included:
An Economic benefit analysis to compare the effects and impacts on the economy due to the project.
The impacts will be addressing at least the following aspects:
Sectoral changes Market implications
Regional economy effects Provincial and National economic effects
International Trade changes Integrative effects on network and capacity.
The results of this step illustrated the magnitude of the multiplier effect of the proposed project, the quantitative
and qualitative data provided an objective, market based perspective on the regional economic effects of
sector investment.
Recommendations
This section concludes by formulating a set of recommendations with respect to mitigation and management of
risks. The results of the impact analysis were interpreted and unpacked to address the potential impacts of the
proposed project as follows:
Changes in total revenue and income for the economy (business sector, tourism activities, economic
activities and housing);
Changes in local jobs and household income;
Changes in property values and intrinsic values;
Detrimental effects on the local environmental aspects related to the above.
Page 9 of 62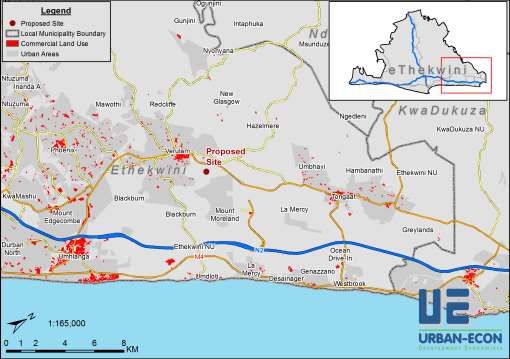
SEIA FOR DUBE TRADEPORT COTTONLANDS TRADEZONE 4

2 SPATIAL ANALYSIS

      LOCATION
The proposed site is located south of the Dube Tradeport within the eThekwini Metropolitan Municipality. The
following map gives an indication of the location of the proposed site (area bordered in purple below).

Map 2: Location of proposed site

                                                                                    Source: Google Earth, 2016

      MARKET DELINEATION
The study area covers the north of eThekwini directly within Mount Moreland, accessing portions of Umdloti, La
Mercy, Verulam and Desainager within its primary market catchment area. The following table highlights the main
places that forms part of the study area.

Table 1: Main Places within the study area

 Ballito             Hambanathi              Mount Moreland        Tongaat              Verulam
 Blackburn           Hazelmere               New Glasgow           Tongaat Beach        Westbrook
 Desainager          La Mercy                Ocean Drive-In        Umbhayi
 Genazzano           Mawothi                 Phoenix               Umdloti
 Greylands           Mount Edgecombe         Redcliffe             Umhlanga

Page 10 of 62
SEIA FOR DUBE TRADEPORT COTTONLANDS TRADEZONE 4
The following map gives an overview of the market delineation and the study area.
Map 3: Study Area of Proposed Development
Source: Urban-Econ, 2016
SPATIAL PLANNING CONSIDERATIONS
This section aims to locate the proposed development within a local spatial policy context and highlight the
strong alignment with planning and development frameworks.
eThekwini Spatial Development Framework
The Dube Tradeport Node is shown as an Economic Investment Node on the eThekwini Spatial Development
Framework (SDF) map and requires major investment. The following map indicates the 2015/16 Revised Spatial
Development Framework for eThekwini.
Page 11 of 62SEIA FOR DUBE TRADEPORT COTTONLANDS TRADEZONE 4
Map 4: Revised Spatial Development Framework, 2015/2016
Proposed
Site
Source: Revised Spatial Development Framework, 2015/2016
Page 12 of 62SEIA FOR DUBE TRADEPORT COTTONLANDS TRADEZONE 4
Furthermore, the SDF identifies the Dube Tradeport area as an Emerging Sub-Metropolitan Node. The SDF
describes Sub-Metropolitan Nodes as follows:
Sub-metropolitan nodes provide accessible day to day business, transport and social services for existing
and future local communities. These nodes serve sub-metropolitan areas of large districts and are well
connected to metropolitan public transport systems and to their adjacent residential areas. They are
generally situated on mobility spines supported by mobility roads and have access to urban freeways
offering a full variety of higher order uses with a sufficient mix that may be in tight competition with other
such nodes.
The SDF describes Dube Tradeport as follows:
The Dube Trade Port (DTP) has been established between the two sea-ports of Durban and Richards Bay
to harness the value of having an air logistics platform. DTP is developed to promote access to global trade
and open up new opportunities for production and export of high –value perishable products and
manufactured goods. It is expected to act as a catalyst for economic development and labour intense
growth throughout KZN province. The massive infrastructure investments in the Dube Tradeport Aerotropolis
will need to be optimised to fulfil its logistics promise and the Richards Bay port and industrial complex will
work on the development of its growth path.
North Spatial Development Plan
The North Spatial Development Plan (SDP) indicates that Dube Tradeport is located within the Northern Urban
Development Corridor and states that “Dube Trade Port Logistics Hub is located within this corridor and new
development opportunities associated with the hub must be integrated with existing urban development”.
Furthermore, Dube Tradeport has been identified as a Metropolitan Node as well as an opportunity area within
the North SDP. The North SDP describes the Dube Tradeport as follows:
The establishment of the new King Shaka International Airport which will form an integral part of the national
logistics platform of the country and as such provide the base for the establishment of a new multi-
functional logistics and intermodal transportation node that will provide a range of business, logistics,
industry and service opportunities for the region and for the surrounding local areas.
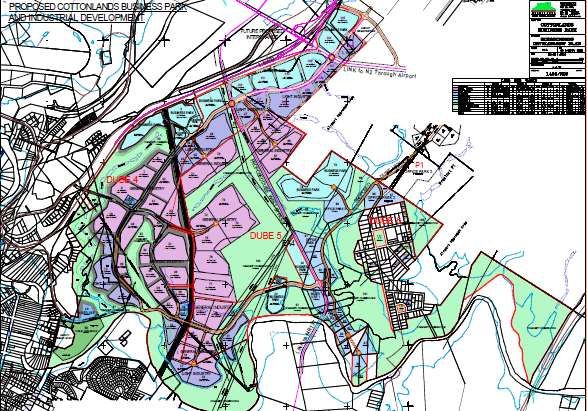
The actual site of the proposed development is indicated as a Future Business Park on the Composite Northern
SDP Map. This map, together with the location of the proposed site, is indicated below.
Page 13 of 62SEIA FOR DUBE TRADEPORT COTTONLANDS TRADEZONE 4
Map 5: Composite Northern SDP Map, 2013
Proposed
Site
Source: North Spatial Development Plan, 2013/2014
Page 14 of 62SEIA FOR DUBE TRADEPORT COTTONLANDS TRADEZONE 4
3 SOCIO-ECONOMIC PROFILE
This section focusses on the socio-economic profile of the study area. This socio-economic profile analysis fulfils
an important role in the indication of development potential within the relevant area. The socio-economic profile
trends are shown in the graphic below.
Figure 2: Socio-Economic Profile for Catchment Area, 2016
Source: Quantec, 2016
DEMOGRAPHICS
A population of approximately 497 500 is recorded within the catchment region, estimated to be residing in a
total of 151 265 households. This equates to 3.3 individuals per household, which is relatively low in density and
accumulates to 670 Households per square kilometre. Household growth rate is calculated to be 3.0% per annum
for periods between 2001 – 2011, Population growth is somewhat slower and has been calculated at by 1.8% per
annum, translating to more income earners and reduced number of residents per household.
EDUCATION
The population has a relatively high education level (with at least two-thirds of the population having some
secondary schooling or higher). A total of 7.0% of the population remain uneducated and have not attended
any form of schooling.
Page 15 of 62SEIA FOR DUBE TRADEPORT COTTONLANDS TRADEZONE 4
AGE PROFILE
Most people are between 15 and 19 years old, while a total of 69% of the population are of working age,
contributing towards a large and youthful labour force, which represents a high potential for employment for
upcoming developments.
EMPLOYMENT
The catchment area is characterised by low levels of unemployment (10.4%) compared to the rest of KwaZulu-
Natal (20.8%) and South Africa (24.3%).
Labour Force Participation Rate: 57.1%
Labour Absorption Rate 33.7%
HOUSEHOLD INCOME ANALYSIS
Most households in the study area earn a low to middle income ranging between R 9 601 to R 153 600 per annum
or R 800 to R 12 800 per month, with 13.7% of households earning no income at all.
ECONOMIC OVERVIEW
The following figure gives an indication of the year-on-year growth in gross domestic product (GDP) as gross value
added (GVA) at constant 2005 prices for the study area between 2006 and 2016. Growth pre-recession appears
to be highest exceeding 4.0% per annum, dropping to 0.5% during the recession, recovering strongly to 3.6% in
2011, thereafter gradually declining to 1.6% in 2015. It is anticipated that through the analysis of prevalent trends
that the GVA within the study area will grow by 2.6% within the current year (2016).
Figure 3: Year-on-year growth in GDP for study area, 2006 – 2016 (Projected)
Source: Quantec, 2016
Page 16 of 62SEIA FOR DUBE TRADEPORT COTTONLANDS TRADEZONE 4
The following figure indicates the economic contribution of each sector of the economy in the study area in 2015.
Figure 4: Economic Contribution (GVA) per Sector for the study area, 2015
Source: Quantec, 2016
The Finance sector was the largest contributor to the economy within the study area, generating a total
contribution of 26.9% to the economy. The Manufacturing sector contributed 18.3% while the Wholesale and
Retail Trade sector and the Community and Social sector contributed 15.8% and 13.0% respectively to the total
GDP. Of these aforementioned sectors, sub sector growth was highest in the Finance and Social services sectors.
Page 17 of 62SEIA FOR DUBE TRADEPORT COTTONLANDS TRADEZONE 4
4 GENERAL MARKET TRENDS
COMPLETED COMMERCIAL BUILDINGS
Statistics South Africa publishes a statistical release annually indicating selected building statistics of the private
sector as reported by local government institutions. The data set shows the total amount of new buildings that
was completed within a calendar year, providing insight into the growth and development within a municipal
area.
Historic Building Statistics (2004 – 2013)
The following figure indicates the total square metres of completed non-residential buildings for the Northern
eThekwini area (including uMhlanga, Tongaat and Verulam) between 2004 and 2013.
Figure 5: Historic Statistics – Completed Non-Residential Buildings (m2), Northern eThekwini, 2004 – 2013
150 000
Square Metres
100 000
50 000
0
2004 2005 2006 2007 2008 2009 2010 2011 2012 2013
Other Non-Residential 36 639 21 957 36 023 26 093 30 072 58 275 24 542 96 778 48 899 53 256
Office & Banking Space 18 061 40 017 17 424 3 213 39 068 38 363 99 022 32 797 18 802 60 377
Source: Statistics South Africa, 2016
From the figure above it is evident that the square metres of completed non-residential buildings peaked
between 2010 and 2011, while the square metres of completed office and banking space buildings peaked in
2010. A total of 60 377m2 of office and banking space was completed in 2013 which was considerably more than
the average of 36 714m2 per annum over the period.
The statistics for 2014 are currently not available, these have not been published by Statistics South Africa,
however more current and relevant information was found for 2015, these have been graphed in the figure and
section below.
Current Building Statistics (2015)
The statistics for completed buildings below appear promising, however it must be noted that the figure has been
further delineated to show additions and alterations in terms of value and square meterage.
Page 18 of 62SEIA FOR DUBE TRADEPORT COTTONLANDS TRADEZONE 4
Figure 6: Non-Residential Buildings Planned and Completed, 2015
Source: Statistics South
Africa, 2016
Overall only 65.1% of
buildings planned were
successfully completed,
however for non-
residential buildings the
area completed was
greater than that was
planned (112.7%)
indicating that a few of
the buildings planned in
2014 were only completed in 2015. However, the total value of construction completed in excess of what was
planned amounted to 29.0%, this was 16.3% more than the total area completed – indicating that construction
costs for development had increased drastically in these past 2 years. Only 20.5% of all alterations/additions
planned were actually completed.
It must be noted only 52.4 % of residential buildings such as houses, flats, apartments and other forms of dwellings
planned, were readily completed in 2015, this proves to be a positive statistic in the form of a growing economic
population, decreased amount of reliance upon breadwinners through an increased incoming and population
earning potential coupled with a decrease in people residing per household.
INTEREST RATES
The prime lending rate was increased from 8.5% p.a. to 9% p.a. in January 2014. This was the first increase in the
prime interest rate since early 2008. The interest rate was subsequently increased during July 2014 to 9.25% p.a.
and has further been increased during March 2016 to 10.50% where it currently remains at. The following figure
shows the change in the prime interest rate between 2006 and 2016.
Figure 7: Prime Interest Lending and Repo Rate, 2006 - 2016
Source: South African Reserve Bank, 2016
The figure above depicts a recovery in the
current term, replicating rates which were
experienced in 2010 (post-recession), with
periods of economic stability and further
recovery approaching.
Page 19 of 62SEIA FOR DUBE TRADEPORT COTTONLANDS TRADEZONE 4
INFLATION
Slight deflation was experienced in 2015, followed by rebound inflation entering 2016, where inflation has
remained more or less steady, peaking in the first quarter of 2016, deflating slightly in the second quarter as a
result of economic relief through enhanced investor support within South Africa.
Figure 8: Headline CPI, 2006– 2016
Source: Quantec, 2016
The headline CPI annual inflation rate in
August 2016 was 6.3%. This rate was 0.2%
lower than the corresponding annual
rate of 6.5% in July 2016. On average,
prices decreased by 0.08% between July
2016 and August 2016.
Figure 9: South African Consumer Price Index (Inflation) – September 2015 – August 2016
7,5% Source: Statistics South Africa, 2016
7,0%
7,0%
6,6% 6,5% 6,5% In South Africa, Consumer prices have
6,5%
6,5%
6,2% 6,3% increased by 1.8% over the past year up
6,0% to August 2016, which rests slightly lower
5,5% than the previous 5-month trend which
5,2% ranged from 6.5% -7.0%. All consumer
5,0%
4,8% sectors have experienced deflation and
4,5%
4,5% 4,6% some form of economic relief coupled
4,0% with the declining fuel price and
strengthening of the rand since February
2016.
THE FNB/BER BUILDING CONFIDENCE INDEX
The FNB/BER Building Confidence Index reveals the percentage of respondents that are satisfied with prevailing
business conditions in six sectors, namely architects, quantity surveyors, main contractors, sub-contractors
(plumbers, electricians, carpenters and shop fitters), manufacturers of building materials (cement, bricks and
glass) and retailers of building material and hardware.
Page 20 of 62SEIA FOR DUBE TRADEPORT COTTONLANDS TRADEZONE 4
The FNB/BER building confidence index can vary between zero (indicating an extreme lack of confidence) and
100 (indicating extreme confidence). It reveals the percentage of respondents that are satisfied with prevailing
business conditions in six sectors, namely architects, quantity surveyors, main contractors, sub-contractors
(plumbers, electricians, carpenters and shop fitters), manufacturers of building materials (cement, bricks and
glass) and retailers of building material and hardware. After falling for six consecutive quarters, the RMB/BER BCI
rose by 10 points to 42 in the third quarter. There are several reasons why the third quarter outcome must be
interpreted with care. Despite the bounce back in confidence, at 42 points, the BCI remained in net negative
terrain.
Figure 10: FNB BER Building Confidence Index, 2016 Q3
Source: Stellenbosch
University – FNB/BER,
2016
Most respondents
completed the
questionnaire after the
local elections, but
before the onset of the
most recent flare-up in
political uncertainty due to, among other factors, renewed questions about the future of the Minister of Finance.
While the rise in the BCI was widespread, the improvement in underlying business indicators was not. We would
therefore not take the latest BCI results to mean the faster pace of growth in the second quarter was sustained in
the third quarter.
Figure 11: FNB/BER Civil Confidence Index, 2016 Q3
Source: Stellenbosch University –
FNB/BER, 2016
The FNB/BER Civil Confidence Index
gained 11 points to register a level
of 52 in 2016 Q3. Confidence was
lifted by a notable improvement in
overall profitability due to less keen
tendering price competition and
continued (albeit subdued) growth
in construction activity.
Page 21 of 62SEIA FOR DUBE TRADEPORT COTTONLANDS TRADEZONE 4
5 OFFICE, RESIDENTIAL, RETAIL AND INDUSTRIAL TREND ANALYSIS
South Africa is not unique in changing property trends or requirements over time, property trends change globally
all the time in line with fluctuating economic conditions, generational needs and changing lifestyle demands.
South Africa does however have some unique conditions, or reasons, that have played a large role in changing
property trends. The following 4 types of land property development trends will now be scrutinised in more detail:
COMMERCIAL OFFICE SPACE TRENDS
National Trends
In 2015, office buildings transacted amounted to 71 which is almost double the 2014 amount of 37. Most of these
transactions however were portfolio sales to Delta Property Fund and Investec Property Fund Limited. Excluding
these portfolio sales, the amount of buildings sold would have resulted in a 19.0% decline from 2014. In 2015 total
investment amounted to R18.5 billion in business linked real estate of which R7.6 billion was spent in secondary
office investments which was a 70.0% growth in investments for the office sector. The Investec purchases alone
accounted for 36.0% of this value. Total business related investments grew by 34.0% year on year from 2014, with
offices driving much of the improvement in the year as it grew by 70.7%. In the long term, South Africa can expect
to see increasing demand for office space.
The total GLA transacted in 2015 increased from 277 636m² in 2014 to 733 058m² in 2015. The average Rand per
square metre value declined from R15 981/m² in 2014 to R10 331/m² in 2015. The decline in property values sold is
also visible in the increase of office yields at 10.5% in 2015 from 9.4% in 2014. For some time now there has been
an increasing preference for Grade-P accommodation among tenants, which has seen vacancies in Grade-A,
B and C buildings on the rise. This trend has long term implications for offices that have seen declining demand
and stagnant or declining rental rates, implying lower income1.
On aggregate, the South African national office vacancy rate continues to increase. In the fourth quarter of 2015,
commercial office vacancies stood at 10.5%, almost unchanged from the quarter before which registered a
vacancy rate of 10.6%2.
Provincial Trends
In 2011 KwaZulu-Natal’s Rands per m² reached a high over the five-year period between 2011-2015 of almost R15
000 and then fell in 2012 to almost R8 000. Since 2012 however, it has maintained steady growth reaching almost
R13 000 by 2015. In fact, KwaZulu-Natal has maintained the steadiest growth in contrast to both the Western Cape
and Gauteng and even South Africa as a whole which all displayed volatile growth in terms of Rands per m² for
office space. This can be seen in the figure below which indicates office investment values by province from
2011-2015.
1 JLL (2016), Commercial Real Estate Transaction Review: South Africa.
2 SAPOA (2016), Office Vacancy Report 2015: Q4.
Page 22 of 62SEIA FOR DUBE TRADEPORT COTTONLANDS TRADEZONE 4
Figure 12: Office Investment Value by Province
Source: Commercial Real Estate
Transaction Review: South Africa,
2016
In summary, given the properties
available in the market, investors
are seeking buildings with
potential for improvement, which
may require additional capital
spend for renovations and
upgrades. This is likely to
contribute to a further decline in property values and higher cap rates as buyers seek greater discounts to
allow for additional spend on purchased buildings. Location is likely to become more important than quality
for buyers in the prevailing market conditions.
The figure below reveals average office yields for the Western Cape, Gauteng, KwaZulu-Natal and the rest of
South Africa for consecutive years from 2013-2015.
Figure 13: Average Office Yields
Source: Commercial Real Estate Transaction Review: South Africa, 2016
eThekwini Trends
In 2014, the Durban CBD commercial office market remained stable in terms of both supply and demand. There
is a continuous move by business from south, west and central, to the northern region of eThekwini (Umhlanga
Newtown Centre, Ridgeside Umhlanga, La Lucia Ridge and, to a lesser extent, Westville). Umhlanga and La Lucia
are prime commercial office nodes for a range of differentiated use. Durban central areas like Morningside,
Glenwood and the Berea have also seen the demand from tenants leaving the CBD3.
3 Broll (2016), The Broll Report 2013/2014. Available at www.broll.com
Page 23 of 62SEIA FOR DUBE TRADEPORT COTTONLANDS TRADEZONE 4
The city anticipates the development of new commercial office market supply around Dube Trade Port and King
Shaka International Airport, boosted primarily by international trade and investment focus. Flooding the market
right now is the new development of small offices ranging from 150m2 to 300m2 competing in the traditional B-
Grade office arena. There is also a continuously growing trend for companies to own their corporate buildings in
Durban which spans somewhere between 1 000 m2 to 3 000m2 and up.
In the first quarter of 2016, eThekwini Municipality recorded an office vacancy rate of 10.9%, the third highest
vacancy rate of the five major Metropolitan Municipalities in the country, as illustrated in the figure below,
alongside.
Durban has also become one of the country’s leading nodes for green building. Because of the slow growth in
the general economy, rentals in this market have stagnated in recent years, ranging at about R140 to R145/m2.
Durban’s office nodes prime space achieved a gross rental of R65 to R100/m2, while Umhlanga and La Lucia
achieve as high as R135/m2 with a net lease escalating from 8% to10% and operating costs at 8% to 12%. In the
CBD, the Gross rentals are R45 to R50/m2 with operation costs and net lease escalation of 9%.
The figure below represents office vacancy rates by municipal level for quarter 2015: Q4.
Figure 13: Office vacancy rates by Municipality
20%
16,0%
15% 12,3%
10,9%
9,8%
10% 7,2%
5%
0%
City of Cape Town City of Johannesburg City of Tshwane eThekwini Nelson Mandela Bay
Source: SAPOA Office Vacancy Report, 2015: Q4, 2016
The star performer in Durban decentralized was Berea, where rentals were up by roughly 9%. Despite this
growth being from a low base, another possible boon to market rentals in this node is vacancy rates that have
in recent quarters been able to drop.
In contrast, vacancy rates in the premier office node of La Lucia have come under some upward pressure.
This might, of course, explain why rentals in this node could only grow by 1%. In Westway, market rentals were
about 3% below what they were a year ago4.
The two figures below show both nominal and real Grade-A office rentals in the decentralized Durban area.
4 Rode and Associates (2016: Q1), Rode’s Report
Page 24 of 62SEIA FOR DUBE TRADEPORT COTTONLANDS TRADEZONE 4
Figure 14: Nominal Durban Grade-A Office Rentals Figure 15: Real Durban Grade-A Office Rentals
Source: Rode Report, 2016
The table below gives an overview of the office stock that is available within the main office nodes within the
eThekwini Municipality. It is evident that the Durban CBD has the highest office stock available within the metro
followed by Umhlanga/La Lucia in the north. Umhlanga/La Lucia had a total of 273 068m2 of office stock at the
end of March 2016.
Table 2: SAPOA office stock (m2), Grades A+, A & B
Area Mar-2015 Jun-2015 Sep-2015 Dec-2015 Mar-2016
Berea 17 653 17 653 17 653 17 653 87 466
Ballito 28 468 76 455 28 468 32 068 31 768
Hillcrest/Gillits 3 451 31 417 31 417 31 417 31 417
Durban CBD 341 007 340 990 340 990 340 990 340 990
Umhlanga/La Lucia 279 229 274 001 286 122 356 051 322 620
Westville 194 897 199 519 202 784 203 107 209 409
Source: Rode Report (2016: Q2)
The following table gives an overview of the office vacancy rates within the main office nodes within the
eThekwini Municipality. From the table below it can be seen that the vacancy rates within Umhlanga/La Lucia
increased from 3.1% to 8.6% between March 2015 and March 2016. This is considerably lower than the vacancy
rates for the Durban CBD and Berea.
Table 3: SAPOA office vacancy factors (%), Grades A+, A & B
Area Mar-2015 Jun-2015 Sep-2015 Dec-2015 Mar-2016
Berea 11.7 11.6 7.5 7.0 8.3
Ballito 9.6 5.5 9.8 9.1 7.2
Hillcrest/Gillits 12.6 2.5 2.8 4.6 8.3
Durban CBD 32.8 14.2 12.6 13.3 11.4
Umhlanga/La Lucia 3.1 3.0 7.6 9.5 8.6
Westville 6.1 5.2 6.6 7.1 7.9
Source: Rode Report (2016: Q2)
The figure below indicates vacancy rates from 1999 to 2015 for the Westville, Berea and La Lucia/Umhlanga
areas.
Page 25 of 62SEIA FOR DUBE TRADEPORT COTTONLANDS TRADEZONE 4
Figure 14: Decentralized Durban Office Vacancies Grade-A+, A and B Combined
Source: Rode Report, 2016
The upward pressure on overall
vacancy rates was primarily due to
sharply rising vacancy rates in the
Durban city’s largest and trendiest
suburban office node of La
Lucia/Umhlanga. In the fourth
quarter of 2015, roughly 34.000 m²
of this node’s prime (Grade-A+, -A
& -B) office stock of about 360
000m² stood vacant, resulting in a vacancy rate of 9,5%. This is compared to the second quarter of 2015, when
the vacancy rate stood at a very low 3%5.
Lease and Purchase Patterns for Commercial Office Space
The table below shows the market rental rates for office buildings within eThekwini. The rental prices are the highest
in Umhlanga/La Lucia for all the grades, highlighting the trend of offices moving north within eThekwini.
Table 4: Market rental rates for office space (Rand’s per rentable m2 per month, gross leases)
Area Grade A+ Mean Grade A Mean Grade B Mean Grade C Mean
Durban CBD - 77.50 62.50 60.00
Durban Berea - 117.50 97.50 85.00
Essex Terrace 130.00 115.00 100.00 90.00
Westway 156.25 121.25 120.00 -
Umhlanga/La Lucia Ridge 165.00 137.50 122.50 105.00
Westville 120.00 112.50 105.00 95.00
Pinetown 95.00 85.00 70.00 52.50
Hillcrest/Kloof (Upper Highway) 127.50 110.00 90.00 75.00
Source: Rode Report, 2016: Q2
Common practice has been for specific landlords to offer a rent-free period where no rent is payable by the
tenant for an initial portion of the term of a lease in order to attract tenants. From the table below it can be seen
that the Durban CBD area, Westway and Umhlanga/La Lucia have a mean rent-free period of 3.0 months, while
Durban Berea and Hillcrest have a mean rent-free period of 2.0 months.
Table 5: Typical rent-free period in months (average periods on offer in 2016 Q2)
Area Mean Standard Deviation
Durban CBD 3.0 0.0
Durban Berea 2.0 -
Essex Terrace 3.5 0.7
5 Rode and Associates (2016: Q1), Rode Report
Page 26 of 62SEIA FOR DUBE TRADEPORT COTTONLANDS TRADEZONE 4
Westway 3.0 1.4
Umhlanga/La Lucia Ridge 3.0 1.4
Westville 4.0 0.0
Pinetown 3.0 1.7
Hillcrest/Kloof (Upper Highway) 2.0 1.7
Source: Rode Report, 2016: Q2
It was tabulated as per above that Westville has the longest rent free period of 4.0 months with standard
deviation of 0.0, what this signifies is that a longer rent free period is offered due to the lack of demand for
office space in this area, the nil deviation arises from the poor take up in this supply over the past few quarters
as well as the previous year.
RESIDENTIAL PROPERTY MARKET TRENDS
National Trends
Global and domestic economic conditions have resulted in a national Gross Domestic Product (GDP) growth
forecast of approximately 0.8% for 2016 and the national currency depreciating by around 21% since the
beginning of 20156. This is largely a result of global decline in commodity prices, national electricity shortages,
drought induced food inflation, and a risk-averse approach to emerging markets. Benchmark lending rates have
risen by 200 basis points in the last two years, 75 of these points being added to lending rates in the first quarter of
2016. The net effect of these interest rate hikes is a resultant increase in the prime lending rate which currently sits
at 10.50%, thus increasing the cost of borrowing for home-buyers and property investors. The residential property
market has been impacted by these domestic pressures and the environment of subdued growth. Residential
building activity regarding the planning phase started 2016 on a relatively low note with only marginal year-on-
year increases in the number of building plans approved for new housing units (3.2%).
The figure below displays yearly growth rates in national flat rentals in South Africa.
Figure 15: Yearly Growth in National Flat Rentals (2005-2015)
Source: Rode Report, 2016
Nationally, in the fourth quarter of 2015,
market rentals for flats were still up by a
yearly rate of 6%. Strong growth in flat
rentals in Cape Town (+9,6%). Cape Town,
followed by Pretoria where rentals were up
by 6%, Johannesburg and Durban
witnessed rentals grow by 5%7.
6 SARB (2016), SARB Monetary Policy Review
7 Rode and Associates (2016: Q1), Rode Report
Page 27 of 62SEIA FOR DUBE TRADEPORT COTTONLANDS TRADEZONE 4
Provincial Trends
Consumers affordability is under strain and this is proved by the reduced bond approval rates which has
decreased by 4.5% year-on-year from the second quarter of 2015. Lower approval rates reflect heightened
mortgage finance affordability strain on home purchasers as the cost of credit also increases (16 basis points on
the average interest rate in the second quarter of 2016).
The figure below reveals the House Price Index sourced from ABSA. The data extracted represents the purchase
prices and percentage changes for all middle class houses (new and old) in KwaZulu-Natal.
Figure 16: ABSA Average KwaZulu-Natal House Price Index, 2010-2016
25% R1 400 000
20% R1 200 000
Purchase Price (Rand Value)
15%
Percentage Change
R1 000 000
10%
R800 000
5%
R600 000
0%
Q1-2010 Q1-2011 Q1-2012 Q1-2013 Q1-2014 Q1-2015 Q1-2016R400 000
-5%
-10% R200 000
-15% R0
Year on Year % change Purchase Price
Source: Quantec, 2016
In the figure above, houses that fall within the middle segment are classified by its size (80-400 square metres) and
price (up to R3,6 million in 2012 base year prices). The middle segment comprises of three divisions as indicated
below:
Small: 80-140 square metres
Medium: 141-220 square metres.
Large: 221-400 square metres.
The figure above shows an upward trajectory of the purchase price from the fourth quarter of 2012 onwards with
an average quarterly percentage increase of 6.77% from 2010-2016 in KwaZulu-Natal. The emergence of a
financially stable black middle class had a tremendous impact on housing demand, encouraged by individual
tax reliefs, in the context of a growing economy.8
The figure below reveals the House Price Index sourced from FNB. The data extracted represents the average
purchase prices and percentage changes for all sized houses (new and old) in KwaZulu-Natal.
8 Global Property Guide (2016), Dramatic Fall in Rand Fails to Attract More Foreign Buyers to South Africa
Page 28 of 62SEIA FOR DUBE TRADEPORT COTTONLANDS TRADEZONE 4
Note: The FNB Provincial House Price Indices are fixed-weighted averages of their sub-indices, which are split by
room number and by sectional title versus freehold properties. The indices are lightly smoothed using a Hodrick-
Prescott smoothing function.
Figure 17: FNB Average House Price Index
Source: Quantec, 2016
10,00% R1 200 000
Average Purchase Price (Rand
9,00%
Percentage Change
8,00% R1 000 000
7,00% In May 2016, the FNB House Price Index
R800 000
6,00% reported a 7.4% year-on-year rate of
5,00% R600 000
Value)
4,00% increase. This is marginally faster than
3,00% R400 000
the 7.0% updated rate of the prior
2,00% R200 000
1,00% month. Just above zero percent real
0,00% R0
house price inflation would continue to
suggest a market still very well
balanced between supply and
Year on Year % Change Purchase Price
demand.
The figure below displays the number of units and the area (m²) of building plans passed in KwaZulu-Natal.
Figure 18: Building Plans Passed in KwaZulu-Natal, 2010-2014
10000 1000000
Area (s.q.m)
No. of units
5459
4936
5000 4227 4246 4299 500000
3217 3099
2221 2031 2202 2099 1681 2284
1660 1730
0 0
2010 2011 2012 2013 2014
Number of units Dwelling-houses Number of units Flats and townhouses
Number of units Dwelling-houses (additions and alterations) Area (sq.m.) Dwelling-houses
Area (sq.m.) Flats and townhouses Area (sq.m.) Dwelling-houses (additions and alterations)
Source: Quantec, 2016
From the figure above it is evident that there is a great tendency for residents to extend their existing houses. In
2014, 3 217 dwelling houses plans were passed and a slightly lower amount of 3 099 flats and townhouses plans
passed.
eThekwini Trends
Despite the subdued environment in the residential property market, house price growth in former black townships
grew strongly in the first half of 2015, outperforming the major Metropolitan suburban areas. The higher property
Page 29 of 62SEIA FOR DUBE TRADEPORT COTTONLANDS TRADEZONE 4
prices in townships resulted largely due to a significant slowing of the exodus of the black middle class into formerly
white suburbs, with higher price growth in the townships reflecting greater residential supply constraints relative
to demand9.
The FNB price Index notes that house price growth in formerly black townships saw a year-on-year increase of
11.9% in the first quarter of 2016, with an average estimated price of R356 390, making it, on average, the most
affordable area of the residential property market.
The figure below displays house price growth from 2000-2015 for major metro former black townships.
Figure 9: Major Metro Former Black Township House Price Growth
60%
50%
40%
30%
Year on year %
20%
10%
0%
Q1-2000 Q1-2003 Q1-2006 Q1-2009 Q1-2012 Q1-2015
-10%
-20% Major Metro Former Black Townships- year on year percentage change
Major Metro Average House Price Index- year on year percentage change
Source: FNB Property Barometer, 2016
The relative outperformance of the township residential market appears to lag behind the former white suburban
property market and is attributed to the following factors:
1. Increasing pressure being placed on household disposable income is driving buyers to consider more
affordable housing.
2. Lower income earners, with more limited financial resources, take longer to make big financial decisions
and require longer to financial prepare for a home purchase, than their higher income counterparts in the
Metropolitan markets.
The table below displays average standard flat and upmarket flat rentals in the surrounding areas of Durban for
the fourth quarter of 2015.
9 FNB Property Barometer (2016), Major Metro Former ‘Townships’ House Price Index Former “Township” Markets
Page 30 of 62SEIA FOR DUBE TRADEPORT COTTONLANDS TRADEZONE 4
Table 6: Average Flat Rentals for Standard and Upmarket Units in Durban
Unit Average Rands per Month as at Quarter 2015:4
Durban
Type Bachelor 1-Bedroom 2-Bedroom 3-Bedroom
Durban Average R3 155 R 3 737 R4 615 R5 542
Upper Highway: Kloof/ Hillcrest R3 400 R3 600 R4 200 R5 500
Pinetown area/ Queensburgh R2 675 R3 500 R4 225 R4 850
Westville area R2 600 R3 350 R4 450 R6 000
Central City (Including Lower Berea) R2 950 R3 250 R4 250 R5 500
Standard Units
Berea/ Morningside/ Glenwood R3 300 R3 950 R4 925 R5 750
South and North Beach R3 150 R3 850 R4 975 R5 925
Durban North/ La Lucia/ Umhlanga - - - -
North (Dolphin) Coast/ Ballito R4 500 R5 000 R7 000 R9 000
Montclaire/ Yellowwood Park R3 025 R3 625 R4 425 R4 500
Bluff area/ Durban South R3 300 R3 850 R4 325 R5 000
Durban South/ Amanzimtoti/ Warner Beach R3 300 R3 650 R3 975 R4 500
Durban Average R3 521 R4 408 R5 350 R7 301
Upper Highway: Kloof/ Hillcrest R3 700 R4 150 R5 200 R6 500
Pinetown area/ Queensburgh R3 000 R3 725 R4 350 R5 500
Westville area R3 500 R4 500 R5 000 R7 000
Central City (Including Lower Berea) R2 900 R3 525 R4 775 R7 000
Upmarket Units
Berea/ Morningside/ Glenwood R3 150 R4 425 R5 400 R7 250
South and North Beach R3 100 R4 250 R5 475 R8 000
Durban North/ La Lucia/ Umhlanga R4 000 R5 750 R7 000 R15 000
North (Dolphin) Coast/ Ballito R8 000 R8 500 R10 100 R15 000
Montclaire/ Yellowwood Park R3 000 R3 750 R4 500 R5 000
Bluff area/ Durban South R3 000 R3 800 R4 500 R5 000
Durban South/ Amanzimtoti/ Warner Beach R3 250 R3 800 R4 500 R5 500
Source: Rode Report, 2016
From the table above it is evident that it is most affordable to rent a bachelor flat in the Westville area (R2 600); a
one-bedroom flat in the Central City (R3 250); a two-bedroom flat in the Durban South/ Amanzimtoti/ Warner
Beach area (R3 975) or a three-bedroom flat in either Montclair/Yellowood Park or the Durban South/
Amanzimtoti/ Warner Beach area (R4 500). The most exclusive flats of all sizes can be found in the North Coast/
Ballito at a monthly rental of R8 000 for a bachelor flat, R8 500 for a one-bedroom flat, R10 100 for a two-bedroom
flat and R15 000 for a three-bedroom flat.
The figure below displays the number of units and the area (m²) of building plans passed in eThekwini.
Page 31 of 62SEIA FOR DUBE TRADEPORT COTTONLANDS TRADEZONE 4
Figure 19: Building Plans Passed in eThekwini, 2010-2014
400 000 4 000
3 171
2 878
2 488
Area (s.q.m)
No. of units
2 255 2 370
200 000 2 000
1 365 1 359
1 083 1 066 908 1 054
748 728 766 698
0 0
2010 2011 2012 2013 2014
No. of units Dwelling-houses No. of units Flats and townhouses
No. of units Dwelling-houses (additions and alterations) Area (sq.m.) Dwelling-houses
Area (sq.m.) Flats and townhouses Area (sq.m.) Dwelling-houses (additions and alterations)
Source: Quantec, 2016
From the figure above it is evident that there is a great tendency for residents of eThekwini to extend their existing
houses. This mimics the same trend seen in KwaZulu-Natal. In 2014, 698 dwelling houses plans were passed and
almost double this amount of 1 359 flats and townhouses plans were passed.
RETAIL PROPERTY MARKET TRENDS
National Trends
Despite the challenges of the consumer market, the performance of the retail sector has shown that there is
strong demand for retail accommodation given its strong earning potential which is also the reason why asset
holders have shown a preference to retain these properties. With the shortage in supply, investors showed a
willingness to pay a premium for retail accommodation in 2015. Total investment value in retail accommodation
increased by 48.0% year on year in 2015 to R5.7 billion.
The retail sector recorded a 47.8% rise in value, however, retail sales improvements were driven by portfolio sales,
with Investec’s purchase of a list of Zenprop and Griffin Holdings properties driving much of the growth. In 2015
GLA transacted increased to 451 750m² from 437 899m² in 2014, a 3.0% year on year increase. This contributed to
the value increasing to R12 693/m² in 2015 from R8 956/m² in 2014. The average yield in the sector improved to
9.0% in 2015 from 10.0% in 2014. Prime retail stock in prominent locations is currently very scarce in the market with
many of the property funds choosing to hold onto this stock, preferring to refurbish their properties to remain
competitive in the market where required10.
Provincial Trends
Gauteng and KwaZulu- Natal were both able to attain exponential increases in total investment value. Although
GLA and investment value was mostly concentrated in Gauteng and KwaZulu-Natal, it is interesting to note that
the total amount of properties traded was dominated by cities outside of the two provinces. Smaller regional or
10 JLL (2016), Commercial Real Estate Transaction Review: South Africa
Page 32 of 62SEIA FOR DUBE TRADEPORT COTTONLANDS TRADEZONE 4
community shopping centres (less than 25 000m2) in non-metropolitan areas outside of Gauteng, Western Cape
and KwaZulu-Natal accounted for 74.0% (29 buildings) of investment transactions in the retail sector, most of
which are buildings that formed part of a portfolio of properties purchased by Dipula Income Fund from the
Moolman Group11.
The Link Hills Shopping Centre which is situated in Waterfall, KwaZulu-Natal in a high growth residential area has a
larger GLA than average properties sold in the year 2015. The shopping centre is one of the few retail properties
on the market in a prime location.
The figure below displays retail investment values by province from 2011-2015.
Figure 20: Retail Investment Value by Province
Source: Commercial Real Estate
Transaction Review: South Africa,
2016
In Gauteng alone, the GLA value
increased to R11 690/m² from
R7 970/m², suggesting that investors
have been willing to pay a premium
for retail stock in the province, further
highlighting the importance of location in retail property investment decisions. Interestingly, GLA and investment
value was largely concentrated in Gauteng and KwaZulu-Natal in more densified areas considering the higher
risk of holding retail accommodation in less densified areas with a lower household income profile.
Figure 21: Average Retail Yields
Source: Commercial Real Estate Transaction Review: South Africa, 2016
eThekwini Trends
In eThekwini, the retail market is experiencing growth, with a number of new major malls or shopping centres
being opened, while others are under development. In Durban alone there are 130 shopping centres. The
structural changes in the existing catchments areas caused by a constantly changing urban form that reflects a
11 JLL (2016), Commercial Real Estate Transaction Review: South Africa
Page 33 of 62SEIA FOR DUBE TRADEPORT COTTONLANDS TRADEZONE 4
contemporary relationship between home, work, play and education have enhanced the level of development
and investment in the retail sector. In 2014, the retail warehousing market preformed well as it achieved a 20.1%
return followed by standalone retail shops at 17.7% and small shopping centres at 16.2%. eThekwini’s formal retail
space measures roughly 1.7 million square metres. This translates to 473 square metres per 1 000 people12.
INDUSTRIAL PROPERTY MARKET TRENDS
National Trends
In 2015, the demand for industrial properties in South Africa remained steady at a 7% increase in the amount of
buildings transacted. The total investment value of industrial property was R5.24 billion, a 22.0% increase from 2014
with the Investec, Equity Property Fund and Collins Group acquisitions accounting for over 78.0% of all investment
transactions in 2015. Of the total business related real estate investment of R18.5 billion in 2015, the industrial sector
accounted for R3.9 billion. The long term outlook of the country is likely to see demand for industrial
accommodation on the rise.
GLA in the industrial sector declined to 424,883m² from 909,738m² in 2015. The overall value per square metre sold
increased to R11 524/m² up from R8 524/m² in 2014. However, this was largely distorted by the strong improvement
in the value per square metre in the industrial sector from R4 716/m² in 2014 to R9 686m² in 2015. This is a substantial
deviation from the long term average of R4 300m² in this property asset class. The Investec-Zenprop deal,
concluded at a 7.5% yield, accounted for 27.0% of industrial investment value in the year, with some buildings
purchased at a value over R20 000/m².
Provincial Trends
Whilst there had been a much broader location spread of properties sold around South Africa in 2014, the
importance of location played a much larger role in 2015 as investment transactions concentrated mainly in
KwaZulu-Natal and Gauteng, with declining activity in the rest of South Africa. KwaZulu-Natal’s increased
investment activity in 2015 is the highest recorded level of transactions in the past three years from only five
industrial properties sold in 2014 to 11 in 2015. Long term potential in KwaZulu-Natal is mostly linked to port activity,
with the province providing the main entry and exit of imported and exported goods.
Investec Property Fund has been the main driver of industrial investment transactions, with the acquisition of the
Griffin Holdings property portfolio consisting of 22 properties, 18 of them being industrial properties in the Gauteng
region, as well as the acquisition of the Zenprop portfolio consisting of 11 industrial properties mainly in KwaZulu-
Natal. The majority of the properties acquired in KwaZulu-Natal are in the upmarket industrial node of Riverhorse
Valley, boasting prime stock with blue chip tenants such as Discovery, RTT, ABB and Adcock Ingram.
12 Property 24 (2016), Eleven New Shopping Centres Proposed for Pretoria East
Page 34 of 62SEIA FOR DUBE TRADEPORT COTTONLANDS TRADEZONE 4
The figure below shows industrial investment values by province from 2011-2015. Demand for industrial space has
gravitated towards prime light industrial units and large warehouses for the use of logistics, distribution and
warehousing.
Figure 22: Industrial Investment Value by Province
Source: Commercial Real
Estate Transaction Review:
South Africa, 2016
KwaZulu-Natal’s GLA value
settles at R11 200/m², which is
the highest value per square
metre of all the provinces.
Demand for industrial space
has gravitated towards prime light industrial units and large warehouses (5,000m² or above) for the use of logistics,
distribution and warehousing.13
The figure below reveals average industrial yields for the Western Cape, Gauteng, KwaZulu-Natal and the rest of
South Africa for consecutive years from 2013-2015.
Figure 23: Average Industrial Yields
Source: Commercial Real Estate Transaction Review: South Africa, 2016
13JLL (2016), Commercial Real Estate Transaction Review: South Africa
Page 35 of 62You can also read