Dust arriving in the Amazon basin over the past 7,500 years came from diverse sources
←
→
Page content transcription
If your browser does not render page correctly, please read the page content below
ARTICLE
                  https://doi.org/10.1038/s43247-020-00071-w                OPEN

                  Dust arriving in the Amazon basin over the past
                  7,500 years came from diverse sources
                  Juliana Nogueira 1 ✉, Heitor Evangelista1, Claudio de Morisson Valeriano 2,3, Abdelfettah Sifeddine4,
                  Carla Neto 2, Gilberto Vaz2, Luciane S. Moreira5, Renato C. Cordeiro5, Bruno Turcq4, Keila Cristina Aniceto6,
                  Artur Bastos Neto7, Gabriel Martins5, Cybelli G. G. Barbosa8, Ricardo H. M. Godoi8 & Marilia H. Shimizu9
1234567890():,;

                  A large amount of dust from the Sahara reaches the Amazon Basin, as observed with satellite
                  imagery. This dust is thought to carry micronutrients that could help fertilize the rainforest.
                  However, considering different atmospheric transport conditions, different aridity levels in
                  South America and Africa and active volcanism, it is not clear if the same pathways for dust
                  have occurred throughout the Holocene. Here we present analyses of Sr-Nd isotopic ratios of
                  a lacustrine sediment core from remote Lake Pata in the Amazon region that encompasses
                  the past 7,500 years before present, and compare these ratios to dust signatures from a
                  variety of sources. We find that dust reaching the western Amazon region during the study
                  period had diverse origins, including the Andean region and northern and southern Africa.
                  We suggest that the Sahara Desert was not the dominant source of dust throughout the vast
                  Amazon basin over the past 7,500 years.

                  1 LARAMG/DBB/IBRAG, Rio de Janeiro State University, Rio de Janeiro, Brazil. 2 LAGIR/FGEL, Rio de Janeiro State University, Rio de Janeiro, Brazil. 3 TEKTOS

                  Research Group, Rio de Janeiro, Brazil. 4 Center IRD France‐Nord, IRD‐Sorbonne University, (UPMC, Univ. Paris 06) ‐ CNRS/MNHN, LOCEAN Laboratory,
                  Bondy, France. 5 Department of Geochemistry, Fluminense Federal University, Niterói, Brazil. 6 Postgraduate Program in Geosciences, Federal University of
                  Amazonas, Manaus, Brazil. 7 La Salle University, Canoas, Brazil. 8 Department of Environmental Engineering, Federal University of Paraná, Curitiba, Brazil.
                  9 Center for Weather Forecasting and Climate, Studies, National Institute for Space Research, São Paulo, Brazil. ✉email: junogueira@id.uff.br

                  COMMUNICATIONS EARTH & ENVIRONMENT | (2021)2:5 | https://doi.org/10.1038/s43247-020-00071-w | www.nature.com/commsenv                                     1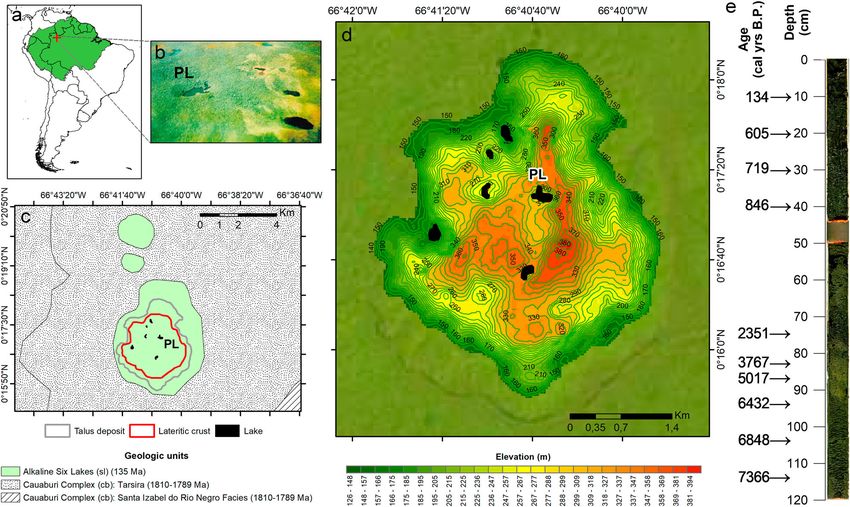
ARTICLE COMMUNICATIONS EARTH & ENVIRONMENT | https://doi.org/10.1038/s43247-020-00071-w
M
ineral dust plays an important role both in the climate ferruginous lateritic crust (Supplementary Fig. 1). As it is not
system1 and in the maintenance of ecosystems through connected to any important drainage system, the lake constitutes
the biogeochemical interactions of macro and micro- a nearly isolated system in terms of atmospheric precipitation and
nutrients that fertilize the oceans and continents2–11. Arid and dust accumulation, apart from local lateral inputs. According to
semi-arid regions are the main global dust sources, where parti- Köppen classification, the regional climate of Lake Pata is clas-
cles can be lifted into the atmosphere, transported, and deposited sified as equatorial (Af)25,26. The nearest weather station is
far away from their sources12. Once it has been accumulated in located in the town of São Gabriel da Cachoeira, 20 km away
lake sediment layers, dust acts as an archive of past atmospheric from Lake Pata. Climatic data from 1961 to 2018 were provided
dynamics, and thus, dust is likely to give information about the by the Brazilian National Institute of Meteorology (INMET) and
arid conditions in its source areas and the associated atmospheric can be found at http://www.inmet.gov.br. During this period, the
circulation patterns13–15. minimum recorded annual rainfall was 2201 mm (1986), the
Many authors suggest that Saharan dust contributes con- maximum was 3532 mm (1967), and the average annual rainfall
siderably to fertilizing the Amazon rainforest through nutrient was 2965 mm. The wet season ranges from mid-December to
exportation10,16,17. Nevertheless, due to uncertainties from lim- mid-May (with an average rainfall of 1697 mm), and the drier
ited existing geochemical databases of Fe (II), Fe (III), and P, and season (although not evident) occurs during August–November
precise estimates of atmospheric fluxes, causal relationship is not (with an average rainfall of 757 mm). Due to its privileged loca-
fully supported10,11,17–19. Some authors claim that an association tion, with a high degree of continental isolation and very low
between Saharan dust dispersion and the development of the human impact, Lake Pata can be considered a sensitive archive of
rainforest exists based on remote sensing evidence, which is a the equatorial paleoclimate, as previously suggested by palyno-
modern view. However, dust advection to the Amazon basin logical and geochemical studies27–37.
through time has changed due to shifts in the Intertropical Several works indicate mineral dust composition and miner-
Convergence Zone (ITCZ) and “Saharan green phases”20,21. It is alogy as reliable proxies for atmospheric circulation and dust-
reasonable that Saharan dust may impact the eastern Amazon emitting sources13,38. Current methods include a combination of
sector considering its close proximity and initial evidence10,22–24. geochemical fingerprints and numerical models to identify
Nevertheless, since the Amazon rainforest covers a vast area of potential emission sources. Among them, the radiogenic isotope
5500000 km² (between approximately 50°W and 80°W longitude composition of dust particles has been used as a robust method to
and 5°N and 17°S latitude), herein we investigate whether a search for provenance39. The isotopic ratios of Sr and Nd in the
Saharan dust signal/fingerprint is measurable in the greatly dis- crust are clearly different from those in the mantle, allowing their
tant region of the central-western Amazon sector during the lithological origins to be distinguished39. Two ratios are commonly
Holocene. To achieve this, we drilled a sediment core (hereafter used: 87Sr/86Sr and 143Nd/144Nd, where 87Sr is a decay product of
denoted as the LPTV-09 core) at one of the most remote, pristine, 87Rb, a long-lived radionuclide (half-life = 4.88 × 10¹⁰ years) and
and isolated locations of the Amazon region, the Lake Pata (LP) 143Nd derived from 147Sm (half-life = 1.06 × 10¹¹ years). These
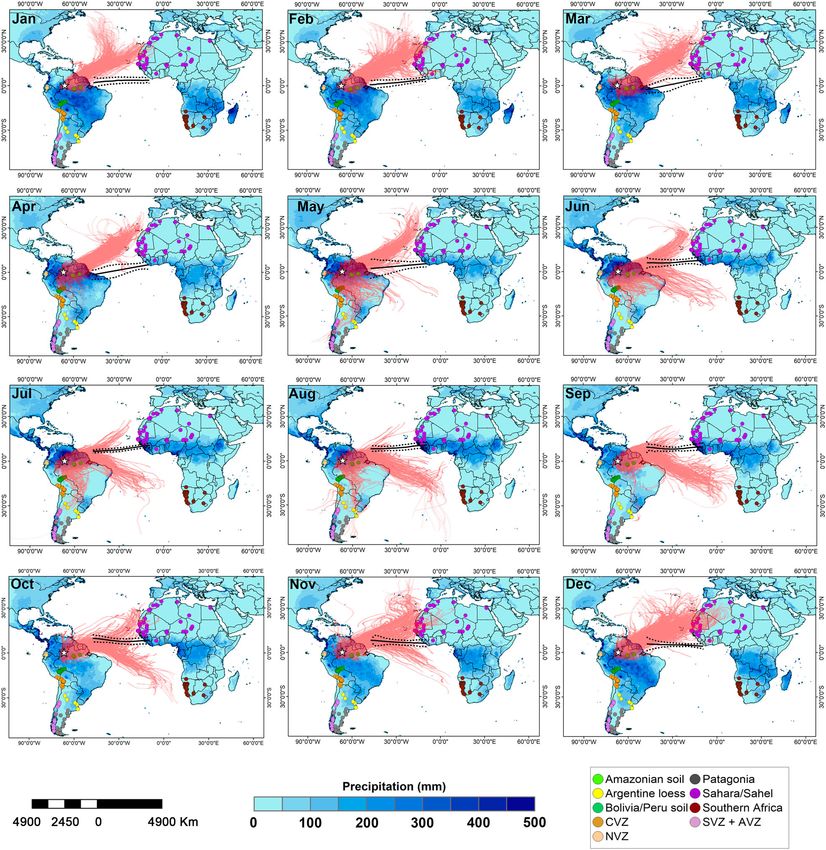
(Fig. 1). Lake Pata is situated 300 m above sea level and is part of nuclides are used as conservative fingerprints of sediment and dust
the Seis Lagos hill lacustrine complex, an inselberg capped by a provenance for the Pleistocene14,40, Holocene41, and modern
Fig. 1 Lake Pata geographical and geological characterization. a Lake Pata location (0°17′9.68″N, 66°40′36.18″W) in the Amazon rainforest (domain
based on GeoServer/Harvard University). b Aerial photography. c Geological domains for the study areas highlighting the Alkaline Six Lakes, dating to
135 Ma. d Hypsometric representation of Seis Lagos hill. e Lacustrine sediment core LPTV-09 and its age in calibrated years before present.
2 COMMUNICATIONS EARTH & ENVIRONMENT | (2021)2:5 | https://doi.org/10.1038/s43247-020-00071-w | www.nature.com/commsenv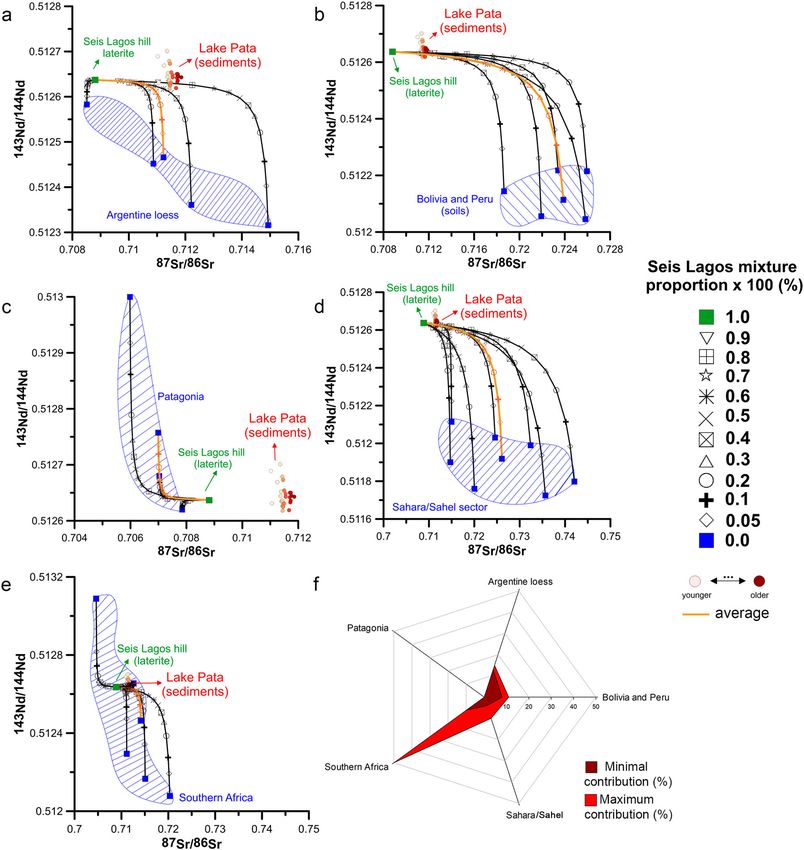
COMMUNICATIONS EARTH & ENVIRONMENT | https://doi.org/10.1038/s43247-020-00071-w                                                    ARTICLE

timescales42. In this way, these isotopic ratios may reflect the              corridor, typical of the austral winter months of July and August,
geological origins of the terrigenous aerosols being transported in          characterize a phenomenon known as “friagem”54, that causes the
the atmosphere39.                                                            most pronounced air temperature decrease in the Amazon basin.
   Precipitation and long-range dust transport to the Amazon                 North African advections take place between December and
basin are constrained by the positioning and intensity of the                April, which corresponds to the Amazonian wet season.
ITCZ, a low-pressure zone located around the equator where the               Currently, dust advection from the Sahara to the Amazon basin
northeast and southeast trade winds converge.                                takes place under two competing conditions: (1) a maximum dust
   Due to the higher solar radiation levels near the equator, the air        load to the Amazon basin due to the large desert region; and (2)
is forced to rise to the upper troposphere along the ITCZ, where it          prevailing moisture conditions in the Amazon basin that may
moves towards higher latitudes and slowly descends, leading to               favor dust deposition from the easter to western Amazon basin
large high-pressure areas in the subtropics. The latitudinal posi-           due to the precipitation distribution that encloses the entire
tion if the ITCZ varies seasonally. In South America, it is located          hydrological basin. Therefore, dust dispersion is constrained to
in its southernmost setting during austral summer, causing high              more inland advections as a result of a washout along with air
precipitation over the Amazon basin. In this season, Lake Pata               mass migration.
remains under the influence of the ITCZ, causing its maximum
water levels. Its minimum water levels are recorded during austral
                                                                             Methodology validation. To test Sr and Nd isotopic ratios as dust
winter, when the ITCZ migrates northward, reducing the amount
                                                                             fingerprinting methods, and therefore their usefulness in tracking
of precipitation falling in the region43.
                                                                             the origin of the air masses in the Amazon basin, we conducted a
   Seis Lagos hill is part of a Cretaceous carbonatite complex in
                                                                             validation experiment based on atmospheric sampling in the
which sediments were intensively modified due to the substantial
                                                                             Amazon basin. Sampling sessions were held in the facilities of the
local weathering. It is capped by a lateritic crust rich in rare-earth
                                                                             Amazon Tall Tower Observatory (ATTO), located 150 km north
elements exceeding 200 m in thickness31. The original ferro-
                                                                             of Manaus city. We analyzed aerosols collected at 80 m above the
carbonatite, which is rich in Sr, is only detectable below 230
                                                                             ground in two campaigns: one during the wet season and one
meters. The lake water level varies according to precipitation and
                                                                             during the dry season. The total aerosol fraction was collected in a
possibly never overflow due to percolation through fractures and
                                                                             quartz filter (during the 2013 dry season), and a 2.5 μm cutoff was
voids in the laterite31. Additional geological details of the site are
                                                                             used for particulate matter in polycarbonate filters (during the
provided in Supplementary Fig. 1.
                                                                             2012–2013 wet season). Each campaign provided blanks for
   In this work, we compiled a comprehensive Sr–Nd isotope
                                                                             analysis (Supplementary Table 1). Sr and Nd isotopic ratios were
database comprising the most important potential emission
                                                                             measured through a thermal ionization mass spectrometer
sources from Africa and South America, including Andean vol-
                                                                             (TIMS). For the corresponding sampling period, air mass back-
canic zones and Patagonia to compare their signatures with those
                                                                             ward trajectories were obtained with the HYSPLIT/NOAA model.
of Lake Pata Holocene sediments, which encompass the last 7500
                                                                             In parallel, we constructed a comprehensive Sr–Nd isotope
years. The results presented will demonstrate that, given the
                                                                             database (containing 253 entries) of potential dust-emitting sites
complexity of dynamic climatic factors during the Holocene, and
                                                                             indicated by the trajectory model, as displayed in Fig. 2 (Fig. 3a
the different climatic conditions in both the Amazon rainforest
                                                                             and Supplementary Data 1). Additionally, to infer the dust
and the potential dust sources, the Saharan dust impact cannot be
                                                                             activity at potential dust-emitting sources, we used the Aerosol
generalized as the main source for the entire Amazon rainforest
                                                                             Index (OMTO3d v003 – GIOVANNI/NASA) (Fig. 3b, c). Cou-
and that other dust source regions have important contributions.
                                                                             pling the air mass backward trajectories and the Aerosol Index
                                                                             spatial distribution, it was possible to identify the most likely dust
                                                                             source regions, as depicted in Fig. 3d. During the sampling per-
Results
                                                                             iod, the ATTO tower was under the influence of two major
Atmospheric scenarios for long-range dust influx at Lake Pata.
                                                                             potential dust-emitting sources: the Sahara/Sahel sector and
To recognize the atmospheric circulation patterns that could favor
                                                                             southern Africa. Nd isotopic ratios, represented as εNd (0), in the
dust reaching Lake Pata, we used the Lagrangian HYSPLIT
                                                                             aerosol samples collected in January and September changed
(HYbrid Single-Particle Lagrangian Integrated Trajectory)/NOAA
                                                                             considerably (from −6.3 to −12.3) corresponding to changes in
(National Oceanic and Atmospheric Administration) model44,45.
                                                                             the patterns of the air mass backward trajectories and their cor-
This model allows the investigation of air mass migrations and has
                                                                             responding dust activity areas (Supplementary Table 2). Com-
been successfully used for aerosol dispersion46–49. Here, we used
                                                                             paring our aerosol data with the isotopic inventory, it is clear that
monthly backward air mass trajectories at a mid-boundary layer
                                                                             the εNd (0) parameter effectively distinguishes the southern
height for the last 30 years, with Lake Pata as the endpoint. The set
                                                                             African dust signature from the Sahara/Sahel pattern. A full
of superimposed trajectories reveals three main patterns and
                                                                             description of this method is described in the literature55. For the
associated potential sources: from December to April, air masses
                                                                             time periods of the experiments conducted at the ATTO, the Sr
are predominately from North Africa and the Sahara/Sahel region;
                                                                             isotope data derived from mineral dust were too low to be
from July to September, two different source regions, southern
                                                                             detected after the removal of the seawater component.
Africa (primarily) and the eastern Andes, were detected; and
transitions period from May to June and October to November
show air masses advecting from both northern and southern                    Sr–Nd isotopes of the Lake Pata sediment core. The complete
sources. As expected, due to the equatorial location of the lake,            Sr–Nd isotope database of this work (n = 27), which comprises
these patterns are modulated by the position of the trade                    the core sediments and the hill lateritic crust, is presented in Fig. 4
winds10,22,43,50,51.                                                         (Sr–Nd isotope data, with errors, corresponding to their respec-
   During austral winter, when the ITCZ is located farther north,            tive core depths are presented in Supplementary Data 2). The
both the South Atlantic Anticyclone52 and the cold front                     chronological model for the LPTV-09 core is shown in Supple-
frequency53 are notably stronger. In South America, during                   mentary Table 3 and Supplementary Fig. 2. The core spans the
austral winter, air masses advection along the eastern Andean                period from 2014 to 7366 years B.P. The Lake Pata sediment core
face, coming from subtropical and subpolar latitudes, frequently             exhibits a narrow isotopic limit, where εNd (0) varies between
reach western Amazonia, as represented in Fig. 2. This migration             −0.4 and 1.2, while the 87Sr/86Sr ratio ranges from 0.711021 to

COMMUNICATIONS EARTH & ENVIRONMENT | (2021)2:5 | https://doi.org/10.1038/s43247-020-00071-w | www.nature.com/commsenv                             3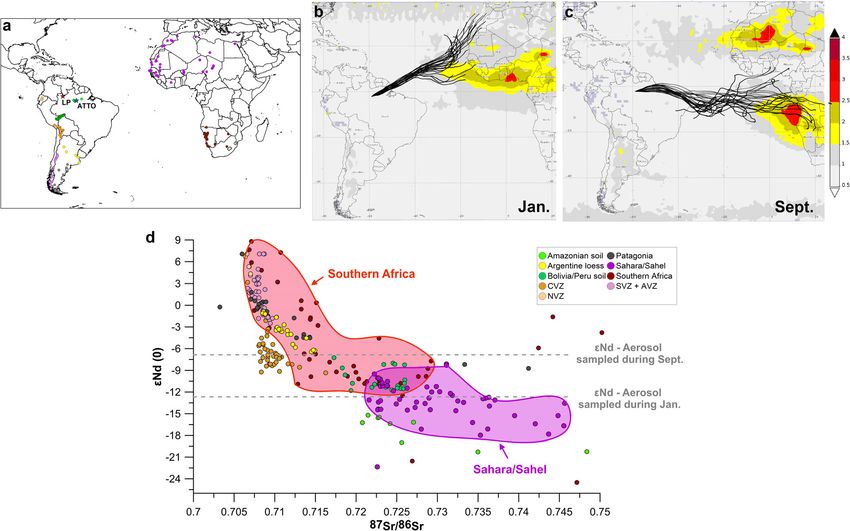
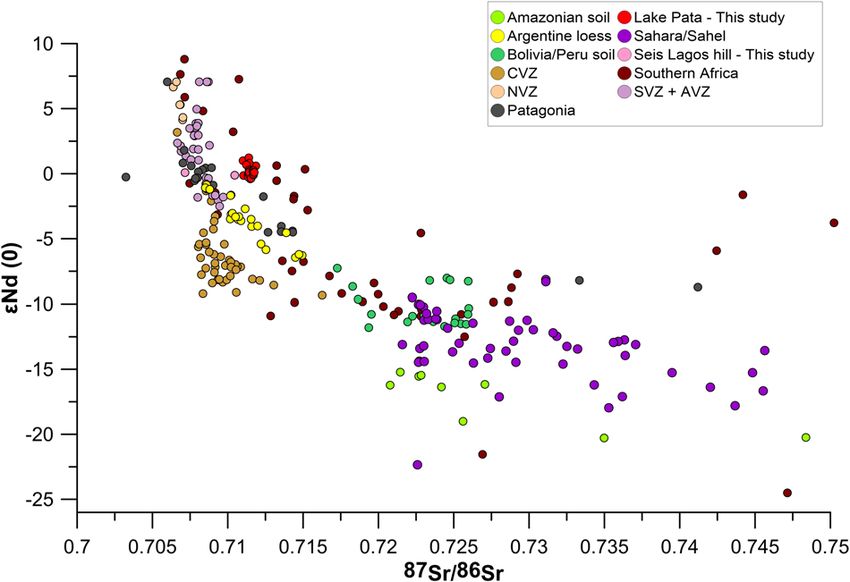
ARTICLE                                               COMMUNICATIONS EARTH & ENVIRONMENT | https://doi.org/10.1038/s43247-020-00071-w

Fig. 2 The current climatology of air masses arriving at Lake Pata along with precipitation, ITCZ dynamics, and potential dust source areas. Backward
air mass trajectory for the last 30 years reaching Lake Pata (red lines). The star indicates the location of Lake Pata, and the black continuous and dashed
lines represent the ITCZ historical average and 2σ standard deviation, respectively, modeled for the period between 1975 and 2013 based on OLR data102.
The blue colors over the continents represent the annual precipitation pattern based on GPCC Precipitation 0.5 degree monthly long-term mean V2018 Full
Reanalysis database for 1891 to 2016 (http://gpcc.dwd.de/)103.

0.711859. For the lateritic crust of Seis Lagos hill, which includes           are related to their older geologic ages. In contrast, and more
the lake bed, εNd (0) varies from −0.4 to 0.6, and the 87Sr/86Sr               comprehensively, southern African soils present a wide isotopic
ratio varies between 0.706564 and 0.712375, reflecting the juve-                range, displaying both juvenile and crustal sediment signatures.
nile, mantle-derived character of the complex. This is quite                      In the Sr–Nd isotopic diagram (Fig. 4 and Supplementary
similar to volcanic ash isotopic signatures—from the Andean                    Fig. 3), the Lake Pata data appear partially embedded in the
Central Volcanic Zone (CVZ), the Northern Volcanic Zone                        domain of several sources as a result of more than one isotopic
(NVZ), and the Southern Volcanic Zone (SVZ) + the Austral                      contribution, despite the strong influence of the local lateritic
Volcanic Zone (AVZ)—and from the southern South America                        crust. The Lake Pata sediments are a mixture of eroded material
region, the Patagonia and Argentine loess—characterized by high                lateritic from the crust that enters the lake by runoff and
εNd (0) and low 87Sr/86Sr ratios. On the other hand, intensively               atmospheric dust deposits. The geomorphology and the uniform
reworked soils from the Amazon, Sahara, and Sahel regions                      lithology of Lake Pata favor a near-constant sediment isotopic
display higher 87Sr/86Sr ratios and more negative εNd (0), which               signature supply. This characteristic is evidenced by the analysis

4            COMMUNICATIONS EARTH & ENVIRONMENT | (2021)2:5 | https://doi.org/10.1038/s43247-020-00071-w | www.nature.com/commsenv
COMMUNICATIONS EARTH & ENVIRONMENT | https://doi.org/10.1038/s43247-020-00071-w                                                      ARTICLE

Fig. 3 Methodological validation comparing radiogenic isotopes measured in aerosol filters in the eastern Amazon with active dust-emitting sources
and backward air mass trajectories for the sampling period. a Potential source areas for dust exportation along with Lake Pata (LP, red star) and the
ATTO (blue star) locations. b, c represent the Aerosol Index data and the backward trajectories for the ATTO sampling period of January and September,
respectively. d Comparison between the εNd (0) from air dust filters from January and September at the ATTO—gray dashed lines—and potential sources.
Areas in red and purple represent the isotope domain for South Africa and the Sahara/Sahel regions, respectively, according to potential dust sources
inferred from the data shown in b and c. Note: The sea salt Sr imprint was not removed, and the discrimination was based only on the Nd isotope data.

                                                                               mixed. However, if the elemental concentrations and radiogenic
                                                                               isotopic for both Sr and Nd are known, then for each source term,
                                                                               it is possible to infer their contribution by using the classic binary
                                                                               mixing model and applying Faure’s equation56 (Fig. 5 and
                                                                               Supplementary Data 3, 4). Using this method, we established the
                                                                               Seis Lagos hill laterite as a fixed end-member and used the
                                                                               postulated dust source contributors as the second extreme.
                                                                               Isotopic mixing curves are expressed by hyperbolic functions
                                                                               linking the mean values of the postulated sources. To be more
                                                                               accurate in searching for mixing percentages, we employed
                                                                               hyperbolic functions for the regions indicated by the backward
                                                                               trajectories in Fig. 2 both for the average isotopic values and for
                                                                               the entire range of the existing data at each domain, obtaining the
                                                                               minimum, average and maximum mixing probabilities. In this
                                                                               way, we evaluated all potential emitting regions individually, that
                                                                               is (1) the Sahara/Sahel sector; (2) Southern Africa; (3) Bolivia/
Fig. 4 Sr and Nd isotopic ratios for potential source areas and Lake Pata      Peru; (4) Patagonia, and (5) the Argentine loess.
and Seis Lagos hill (this study). Errors bars for the generated data are not       Our results suggest that the atmospheric deposition of long-range
visible in this scale but are provided in Supplementary Data 2 and             dust material from arid/semi-arid zones occurred during the mid-to-
Supplementary Fig. 3.                                                          late Holocene in central-western Amazon in measurable amounts.
                                                                               These dust materials were derived from sources in the Sahara/Sahel,
of lateritic crust samples with standard deviations of 0.000007 for            southern Africa, Bolivian/Peruvian soils, and the Argentine loess.
εNd (0) and 0.002329 for Sr isotopic ratios. Therefore, the                    Mixture levels varied from ~4 to 10% for the Sahara/Sahel sector, ~8
recognition of an exogenous atmospheric contribution in the                    to 11% for Bolivian/Peruvian soils, ~10 to 50% for southern Africa,
sediment composition was based on the deviations observed from                 and 13 to 15% for the Argentine loess. Although the Patagonia
the lateritic crust signal, which are taken as baseline data.                  region was initially assumed to be a potential source based only on
   Sediments from different sources with specific radiogenic                    the modeled atmospheric dynamics, no isotopic signal of such a
signatures result in a “mixed signature” material when naturally               component was detected for the long-term.

COMMUNICATIONS EARTH & ENVIRONMENT | (2021)2:5 | https://doi.org/10.1038/s43247-020-00071-w | www.nature.com/commsenv                               5
ARTICLE                                              COMMUNICATIONS EARTH & ENVIRONMENT | https://doi.org/10.1038/s43247-020-00071-w

Fig. 5 Binary mixing curves56 between the Seis Lagos hill lateritic crust, where Lake Pata is inserted, and the different possible dust sources.
a Argentine loess, b Bolivian/Peruvian soils, c Patagonia, d Sahara/Sahel sector, and e southern Africa. The diagram in f summarizes the minimum and
maximum estimated contributions for each area, indicating a mixture between the Seis Lagos hill laterite signal with contributions of ~4–10% for Sahara/
Sahel sector, ~8–11% for Bolivian/Peruvian soils, ~10–50% for Southern Africa, and 13–15% for Argentine loess.

Discussion                                                                   north and south, soils of the central Andes, and Argentine loess as
The northerly air advections that take place in southern South               potential contributors, with southern Africa being even more
America during the austral winter season (July–August in Fig. 2)             important than the Sahara Desert for this sector of the Amazon
are known mechanisms associated with polar cold fronts that                  basin during the mid-to-late Holocene.
reach the western Amazon region and they are potential                          In addition to the use of radiogenic isotopes to identify dust
mechanisms that transport dust to the western Amazon region                  sources, the Holocenic changes in the εNd at Lake Pata are also
since they originate in the neotropical (primary and reworked)               important in this context. The εNd data show that 55% of our
loess domain, which covers a large part of Argentina north of 30°            database falls below the 95% confidence level of the local lateritic
S. Additionally, due to the proximity of Andean bare soils to the            isotopic imprint, which may indicate an atmospherically-derived
western Amazon basin, a signal of this site was evident at our               inflow. The εNd values presented in Fig. 6b tend to be higher after
study site.                                                                  4 kyr B.P., suggesting the influence of a persistent mixture of
   One interesting finding arising from our work is that, contrary            more juvenile sources (with higher εNd values). From the pos-
to many reports that claim the Sahara Desert as the unique source            tulated sources investigated in this study, this influence could be
of dust reaching the Amazon basin10,16,17,19,22,24,57,58, our data           derived only from southern Africa, the NVZ, the SVZ, and the
depict a more complex scenario. On long-term timescales, the                 AVZ, as depicted in Fig. 4. The literature reports juvenile values
sedimentary record at Lake Pata points to African deserts, both              of εNd for ash material from several volcanic events59. Therefore,

6           COMMUNICATIONS EARTH & ENVIRONMENT | (2021)2:5 | https://doi.org/10.1038/s43247-020-00071-w | www.nature.com/commsenv
COMMUNICATIONS EARTH & ENVIRONMENT | https://doi.org/10.1038/s43247-020-00071-w ARTICLE
sources (Fig. 6c). In this case, the African radiogenic signature
tends toward progressively more negative values with time. This
behavior clearly contrasts with the increasing trend of εNd values
observed at Lake Pata, even though this period represents the
humid-dry transition between the humid phase and drier phases
of the Sahara Desert62.
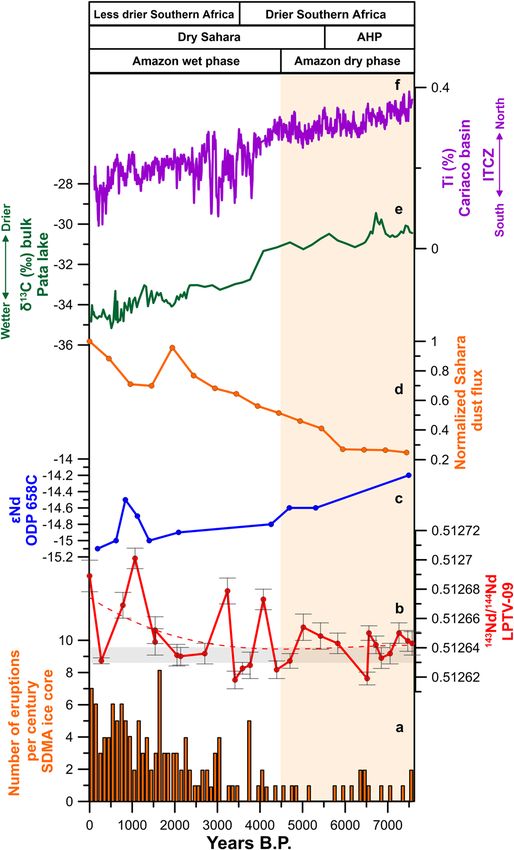
Simplified estimation of the total Saharan dust load at Lake
Pata since the mid-Holocene is presented in Fig. 6d (for details,
see Supplementary Fig. 4). To estimate the dust flux reaching
Lake Pata from the Saharan within the last 7.5 kyr B.P., we have
proposed a linear method using the relationship between modeled
dust flux at the African margin ocean surface, close to the Sahara
Desert (averaging three model outputs for the modern dust
flux5,63,64) and modern dust deposition at the sea bottom65 for
the corresponding site. Dust fluxes for sections of the sediment
cores for 6 yr B.P. and the Last Glacial Maximum (LGM) were
also taken into account and compared with modeled dust flux64
at 6 kyr B.P. and the LGM63. The estimation suggests that the
Saharan dust flux to Lake Pata during the mid-Holocene
decreased up to five times compared to the present contribu-
tion, which is coincident with the African Humid Period
(14.8–5.5 kyr B.P.)66. Time series “e” and “f” in Fig. 6 show that
the Cariaco basin possesses the opposite hydrological regime in
comparison to the Lake Pata site. The decreasing δ13C values at
Lake Pata are related to wetter conditions29, while the decrease in
Ti (%) in the Cariaco basin is related to drier conditions20. Thus,
during the mid-Holocene drought event in the Amazon
basin27,67–70 between ~7.5 and 4.5 kyr when the Atlantic ITCZ
was slightly displaced to the north71,72, the lateral sediment flux
at Lake Pata reached a minimum.
Variations in the local isotopic signal in our data suggest a
mixture of different dust sources reaching Lake Pata. Potential
dust sources were postulated taking into consideration (1) the
observation of favorable conditions related to atmospheric
transport between the arid region and the central-western Ama-
zon, (2) the relative intensity of dust emissions at the sources, and
(3) the local climatic conditions at Lake Pata as favorable con-
Fig. 6 Multiproxy comparison outlining the aerosol exportation scenario ditions for dust deposition. Between 7.5 and 5.5-4.5 kyr B.P., wet
and paleoclimatic conditions on the central and southern Atlantic conditions prevailed in northern Africa73–75 and, thus, its
sectors. a Number of eruptions per century recorded at the SDMA ice core importance as a potential dust source area is limited65. During
in Marie Byrd Land (West Antarctica)60; b 143Nd/144Nd data of Lake Pata this period, few deviations from the local εNd isotopic signature
with its error bars. The dashed red line represents the data trend. The were observed for Lake Pata, indicating few contributions from
horizontal gray bar represents the Seis Lagos hill crustal isotopic signal; any allochthonous source. Additionally, although drier conditions
c εNd data of a marine sediment core from the North African continental prevailed in southern Africa until ~3.5 kyr B.P.76–78, the increase
shelf61; d Normalized Saharan dust flux modeled based on the previous in the meridionality of the trade winds79,80 caused inefficiency in
publications5,63,64; e δ13C from Lake Pata bulk sediment29; f Ti the transatlantic transport of dust exported by that area, as also
concentration in the Cariaco Basin20. AHP African Humid Period. The indicated by the wind vectors derived from simulations from
vertical red bar represents the Amazonian dry period. CMIP5 multi-model (Supplementary Fig. 5). For the austral
summer mid-Holocene simulations from this model, it is also
possible to see a predominance in advections coming from
one explanation for the continuous increase in εNd is the influ- southern South America, contrarily to what it is observed during
ence of the Andean, and probably global, volcanic impact. To the modern period when air mass come predominantly from
evaluate the consistency of this hypothesis, we compared the εNd northern Africa.
time series with a detailed volcanic record time series, retrieved After 4.5 kyr B.P., increases in the trend and variability of εNd
from the Antarctic ice core at the WAIS (West Antarctica Ice values are observed, indicating an intermittent contribution of
Sheet) Divide/Marie Byrd Land60, which details the time other sources to the lake, such as the ones depicted in Fig. 5f
sequence of major volcanic eruptions. Many of the volcanic (Argentine loess, Bolivian and Peruvian soils, Sahara/Sahel sector
events that comprise the ice core database60 refer to Chilean and southern Africa). Wet conditions characterize the Amazo-
volcanic eruptions and therefore potentially impact the Amazon nian hydrology during the late Holocene as a consequence of the
basin. Figure 6a depicts a very similar trend between the number southward shift, expansion, and intensification20 of the Atlantic
of eruptions recorded in Antarctica per century and the εNd ITCZ, as well as an enhanced South American Monsoon System
values at Lake Pata since the mid-Holocene (Fig. 6b). Addition- (SAMS). During the same period, the Sahara became a well-
ally, from a time perspective, we compared the εNd values of Lake established dust source, similar to the modern scenario that
Pata with those of the Eastern Atlantic ODP 658C sediment would be favorable to the delivery of dust. However, the Saharan
core61, which is representative of mixed northern African dust εNd fingerprint (as recorded from the ODP 658C sediment
COMMUNICATIONS EARTH & ENVIRONMENT | (2021)2:5 | https://doi.org/10.1038/s43247-020-00071-w | www.nature.com/commsenv 7ARTICLE COMMUNICATIONS EARTH & ENVIRONMENT | https://doi.org/10.1038/s43247-020-00071-w
core61) tended to become more negative with time in contrast to curve and the WAIS Divide/Antarctica volcanic record during the
the Lake Pata isotopic imprint. mid-to-late Holocene.
From the several paleorecords comparing the climate vari- In summary, our findings indicate that the changes in the
abilities of the Central Amazon basin and Cariaco basin81–83, it is radiogenic signal in the Lake Pata sediment record, which includes
evident that the ITCZ latitudinal shifts and width variations the last 7.5 kyr B.P., are the result of combined sources modulated
modulate the dry and wet climate regimes in the Amazon basin. by local and global climatic conditions, especially latitudinal shifts,
In this context, trade wind positioning influences the amount of possible width variations and intensification of the ITCZ and the
dust being transported from the Sahara to the Amazon basin. In atmospheric dynamics over the southern Atlantic Ocean. Our
the Holocene scenario, the present-day ITCZ position is com- data, taken from a remote inland site within the Amazon basin,
pared to the south, which explains the actual wet conditions indicates that the Saharan dust influence over the Amazon basin is
observed in most of the Amazon hydrological basin20. most likely geographically limited and consequently, that the
The issue of the Sahara Desert fertilizing the Amazon basin has fertilizing issue cannot be generalized to the entire basin. These
been discussed for decades. Nevertheless, there has never been a conclusions indicate that the fertilization issue of the Amazon
consensus. The terra firme dense tropical rainforest covers the rainforest is a more complex multifactorial issue.
majority of this region and is characterized by its soils with low
natural chemical fertility. For fertilization, vegetation relies Methods
mainly on the recycling of local organic matter and on nutrient Sediment coring. A lacustrine sediment core, LPTV-09 (0°17′9.68″ N, 66°40′
input through both wet and dry deposition84,85. In this sense, 36.18″ W), from Lake Pata yielded a detailed record of climatic change during the
Reichholf11 and Swap et al.10 claim that the emergence and Holocene, providing a record of the last 7573 years. The coring was conducted in
2009 using a Colinvaux–Vohnout piston corer37. The core was sliced into 1-cm
development of the Amazon rainforest have been influenced not layers at the Institut de Recherche pour le Développement (IRD), Bondy, France.
only by changes in the amount of local precipitation but also by Age measurements (of 13 samples) were performed at the Laboratoire de Mesure
the atmospheric nutrient influx to the basin. Research on the du Carbone 14 (LMC14)—UMS 2572 (CEA/DSM, CNRS, IRD, IRSN, Ministère de
atmosphere over the Amazon basin encompasses its composition la Culture et de la Communication). Ages were calibrated using the IntCal 13
calibration curve93 and the chronology curve was constructed using Bacon94.
and physical and chemical processes86–89. Currently, northern Details can be found in Nascimento et al.29. Permission for fieldwork #20276-1 at
Africa is believed to be the origin of the air masses that bring such the Neblina National Park was granted by the SISBIO/ICMBIO/MMA/Brazil.
nutrients. However, these assumptions are based mainly on
satellite images and dispersion models, with few in situ mea- 87Sr/86Sr and 143Nd/144Nd analysis. The chronology of this core is based upon
surements or specific geochemical signatures indicating their twelve radiocarbon dates from the retrieved sediment organic matter. The core was
origins10,11,19,22,90. Yet, when analyzing surface material in the sliced into 1-cm intervals and analyzed at 1-10-cm intervals (for a total of
northeastern Amazon basin, Abouchami et al.1 did not find a 26 samples) for the 87Sr/86Sr and 143Nd/144Nd isotopic compositions. A TRITON
Thermal Ionization Mass Spectrometer (Thermo Scientific) was used at the LAGIR
Sahara fingerprint. (Laboratory of Geochronology and Radiogenic Isotopes) at UERJ, Rio de Janeiro
In this work, we do not rule out the Sahara dust as an State University. Additionally, samples of the lateritic crust that forms Lake Pata
important player in the fertilization of the Amazon rainforest. were also analyzed according to the following analytical procedure.
However, in our study, we show that this relationship is probably All chemical procedures were performed in cleanrooms under positive air
pressure using HEPA air filters. Acids were twice distilled in sub-boiling mode, and
not valid for the entire hydrological basin, since, although there is prefiltered and deionized water from a Milli-Q purifier was used. All containers
a residual fingerprint of Sahara dust, other sources, such as were Teflon made by Savillex. Each sample was weighed (~25 mg) and digested
southern African and Argentine loess, seem to be more dominant during two cycles: the first one lasted for three days using a mixture of 48% HF and
for more continental inland portions of the Amazon basin. Pre- HNO3 6 N (12:1) and the second one lasted for two days using HCl 6 N. The
vious works address the fertilization issue only on the basis of a separation and collection of Sr were carried out with HCl 2.5 N and rare-earth
elements (REEs) with HCl 6 N using ion-exchange columns filled with Bio-Rad
modern database19,90 and do not consider the fact that the AG50W-X8 (100-200 mesh) cation exchange resin. For the extraction of Nd from
rainforest evolution dates as far back as the Pleistocene, including the other REEs, a second column with LN Eichrom resin (50–100 μm) was used
periods when the Sahara was greener than it is today (the African with HCl 0.18 N. After hot plate evaporation, Sr and Nd were deposited separately
Humid Period) and when a load of dust reaching the Amazon onto previously degassed Re filaments in a double-filament setup using 1 μl of
H3PO4 1 N as the ionization activator. The deposited material was subjected to an
basin was much lower21. Herein, we do not discard the possibility initial current of 1.5 A for evaporation of water and acid and then subjected to a
that fertilization occurs at sites closer to the Atlantic Ocean, current of ~2 A for 3 s to achieve final drying.
subject to a higher dust load16,91. We base our conclusions on a The TIMS spectrometric analyses of Sr were performed in static mode, with an
Holocene analysis of Sr–Nd isotopic ratios as tracers of dust arrangement of five Faraday collectors, obtaining a minimum of 100 measurement
cycles. The evaporation filament was subjected to a current of 1800–2300 mA,
provenance. More recently, daily measurements of mineral dust while the ionization filament remained fixed at a current of 3200 mA. For Nd
and PM10 carried on trade winds between 2002 and 2017 in analyses, an array of eight Faraday collectors was used, with a minimum of 160
French Guiana indicated that the deposition rates in the Amazon measurements. The evaporation filament was subjected to a current of 1800–2300
basin, although significant, are substantially smaller than rates mA, while the ionization filament remained fixed at a current of 4500 mA. The
measured 87Sr/86Sr and 143Nd/144Nd isotopic ratios were normalized using the
from the previous studies92. In this sense, the deposition rates are natural ratios of 88Sr/86Sr = 8.3752 and 146Nd/144Nd = 0.7219, respectively. The
greater over the northern and northeastern regions of South average 87Sr/86Sr ratios for the standard NBS987 and 143Nd/144Nd for the JNdi-1
America and lower in central Amazonia; this behavior is attrib- standard in LAGIR are 0.710235 ± 9 and 0.512115 ± 6, respectively. The Nd blanks
uted to the wet removal of dust during transport through the were below 1000 pg, with an average of 500 pg. For convenience, the 143Nd/144Nd
rainy regions of the ITCZ. ratios are expressed as εNd(0) = ((143Nd/144Nd/0.512638) − 1) × 104, expressing
deviation from the isotopic ratio of the CHondritic Uniform Reservoir - CHUR95.
In contrast to the modern high dust loads reaching the eastern The results are displayed within 2σ analytical uncertainties in Supplementary
Amazon basin, from the isotopic method, we have estimated Data 2.
smaller contributions of the Sahara/Sahel dust signal during the
last 7.5 kyr B.P., ranging from ~4 to ~10%. Contributions from Sr grain-size effect correction. The grain-size effect is observed in 87Sr/86Sr ratios
southern Africa (~10–50%), Bolivian/Peruvian soils (~8–11%), for carbonate-free sediment samples96. Thus, to minimize this effect, we applied Sr
and, finally, Argentine loess (~13–15%) also accounted for the isotope data correction factors according to the work of Dash96, Gaiero97, and
isotopic signal at western Amazon. It is also possible that dust/ash Neto98. For the North African and Sahara/Sahel sectors, databases were corrected
by data from Dash96, in which we used a factor of 0.0080 for the 87Sr/86Sr data (we
from volcanism may occasionally be deposited at the Lake Pata subtracted this factor from the data). The same procedure was performed on South
site, as revealed by the coincident trends observed in the local εNd African data (correction factor of 0.0013). For South America, we used the
8 COMMUNICATIONS EARTH & ENVIRONMENT | (2021)2:5 | https://doi.org/10.1038/s43247-020-00071-w | www.nature.com/commsenvCOMMUNICATIONS EARTH & ENVIRONMENT | https://doi.org/10.1038/s43247-020-00071-w ARTICLE
Patagonian curve (a factor of 0.0026). For Amazonian soils, we used an average Received: 21 May 2020; Accepted: 20 November 2020;
value from the three curves (a factor of 0.0039). This correction was applied to data
of bulk sediments or soil samples with grain sizes larger than 50 μm. For the laterite
Sr data, no correction was needed since this is a local source. Typical aerosol size
modes over the Amazon basin are 1.4 μm for the fine fraction and 7.9 μm for the
coarse fraction88. The correction values corresponding to the amplitudes of the
87Sr/86Sr data taken from 2- and 50-μm grain sizes encompass the maximum
References
variability in grain-size dependence. The results are displayed in Supplementary 1. Abouchami, W. et al. Geochemical and isotopic characterization of the bodélé
Fig. 6. depression dust source and implications for transatlantic dust transport to the
Amazon basin. Earth Planet. Sci. Lett. 380, 112–123 (2013).
Aerosol analysis. Aerosol filters have a special importance because they allow an 2. Chin, M., Rood, R. B., Lin, S.-J., Müller, J.-F. & Thompson, A. M. Atmospheric
isotope signature analysis in the study area before aerosols are deposited and sulfur cycle simulated in the global model GOCART: model description and
undergo chemical modification. Using isotopic ratio analysis on filters in con- global properties. J. Geophys. Res. Atmos. 105, 24671–24687 (2000).
junction with backward air mass trajectories with HYSPLIT (HYbrid Single- 3. Cwiertny, D. M., Young, M. A. & Grassian, V. H. Chemistry and
Particle Lagrangian Integrated Trajectory)44,45 and UV aerosol index data99,100, we photochemistry of mineral dust aerosol. Annu. Rev. Phys. Chem. 59, 27–51
can better understand and interpret the aerosol dynamics in the study area. For this (2008).
approach, one polycarbonate filter and one quartz filter were used for sampling at 4. Haywood, J. Radiative properties and direct radiative effect of Saharan dust
the Amazon Tall Tower Observatory (ATTO) site, an 80 m-high tower located in measured by the C-130 aircraft during SHADE: 1. Solar spectrum. J. Geophys.
the eastern Amazon basin (2°8′38.82″ S, 58°59′59.52″ W), during the wet season in Res. 108, 1–16 (2003). SAH 4.
2012–2013 and the dry season in 2013, respectively. According to Ben-Ami et al.90, 5. Jickells, T. D. et al. Global iron connections between desert dust, ocean
mineral dust takes ~8–12 days to cross the Atlantic Ocean. Thus, the analyses were biogeochemistry, and climate. Science 308, 67–71 (2005).
based on the average AI in the regions of interest (African continent—Atlantic 6. Kumar, A. et al. A radiogenic isotope tracer study of transatlantic dust
Ocean—South America) 12 days before the aerosol sampling period. Filters were transport from Africa to the Caribbean. Atmos. Environ. 82, 130–143 (2014).
acid digested following the procedures of Gioia et al.101: 2 mL (48%) of HF and 7. Maher, B. A. et al. Global connections between aeolian dust, climate and ocean
0.5 mL of HNO3 6 N for 3 days at 120–130 °C on a hot plate. Before complete
biogeochemistry at the present day and at the last glacial maximum. Earth Sci.
evaporation, we added 1 mL of HNO3 6 N to ensure that all the HF was eliminated.
Rev. 99, 61–97 (2010).
After evaporation, we added 2 mL of HCl 6 N and heated the solution for two more
8. Ozer, P., Laghdaf, M. B. O. M., Lemine, S. O. M. & Gassani, J. Estimation of air
days under the conditions previously described. Following total evaporation, the
quality degradation due to Saharan dust at Nouakchott, Mauritania, from
extraction of Sr and Nd was carried out as previously described. Sr and Nd isotope
results, displayed within 2σ analytical uncertainties, and filter retrieval information horizontal visibility data. Water Air Soil Pollut. 178, 79–87 (2006).
can be found in Supplementary Table 1. Two blank aerosol filters of the same type 9. Usher, C. R., Michel, A. E. & Grassian, V. H. Reactions on mineral dust. Chem.
as those used for the ATTO aerosol samples were analyzed. No measurable Nd or Rev. 103, 4883–4939 (2003).
Sr signal was observed from the polycarbonate of the filters. In the quartz filter, 10. Swap, R., Garstang, M., Greco, S., Talbot, R. & Kallberg, P. Saharan dust in the
only the Sr signal was observed, but with low signal intensity. Amazon Basin. Tellus B 44, 133–149 (1992).
11. Reichholf, J. H. Is Saharan dust a major source of nutrients for the Amazonian
Rain Forest? Stud. Neotrop. Fauna Environ. 21, 251–255 (1986).
Potential isotope database sources. Potential source areas of mineral dust 12. Knippertz, P. Mineral Dust (Springer, Netherlands, 2014).
exportation to the study site were inferred by a 30-year monthly analysis of 13. Aarons, S. M., Aciego, S. M. & Gleason, J. D. Variable HfSrNd radiogenic
backward air mass trajectories using the HYSPLIT/NOAA model available at isotopic compositions in a Saharan dust storm over the Atlantic: Implications
https://www.ready.noaa.gov/HYSPLIT_traj.php. Trajectories were calculated using for dust flux to oceans, ice sheets and the terrestrial biosphere. Chem. Geol.
the NCEP/NCAR reanalysis database for a 200-h analysis. The coordinates and
349–350, 18–26 (2013).
altitude of Lake Pata were taken as the endpoint of the trajectories, taking into
14. Delmonte, B. et al. Comparing the Epica and Vostok dust records during the
account a model vertical velocity and a mid-boundary layer height. Combined with
last 220,000 years: Stratigraphical correlation and provenance in glacial
the Intertropical Convergence Zone (ITCZ) seasonal behavior and based on 39
periods. Earth Science Rev. 66, 63–87 (2004).
years of Outgoing Longwave Radiation (OLR) monthly average analysis102, we
15. Grousset, F. E., Rognon, P., Coudé-Gaussen, G. & Pédemay, P. Origins of peri-
obtained a pattern of the air mass trajectories over the Amazon basin reaching its
western sector. Finally, extensive literature research was conducted to build a Saharan dust deposits traced by their Nd and Sr isotopic composition.
substantial isotope database for these areas to compare with the isotopic results Palaeogeogr. Palaeoclimatol. Palaeoecol. 93, 203–212 (1992).
from sediment core LPTV 09 and thus retrieve information on the origin areas of 16. Yu, H. et al. The fertilizing role of African dust in the Amazon rainforest: a
the deposited material. The final database is displayed in Supplementary Data 1. first multiyear assessment based on data from Cloud-Aerosol Lidar and
Infrared Pathfinder Satellite Observations. Geophys. Res. Lett. 1–8. https://doi.
org/10.1002/2015GL063040 (2015).
Binary mixing model. Based on the binary mixture model56, we have modeled 17. Bristow, C. S., Hudson-Edwards, K. A. & Chappell, A. Fertilizing the Amazon
curves for different mixing hypotheses between Seis Lagos hill and a type of iso- and equatorial Atlantic with West African dust. Geophys. Res. Lett. 37, L14807
topic domain value, including an average value, for potential dust source material (2010).
identified by the backward trajectories. The equation used for the mixture is shown 18. Andreae, M. O. et al. Can Saharan dust explain extensive clay deposits in the
below:
Amazon Basin? Radiogenic isotopes as tracers of transatlantic transport.
RiA XA f þ RiB XB f Mineral. Mag. 77, 551–635 (2013).
RiM ¼ ; 19. Koren, I. et al. The Bodélé depression: a single spot in the Sahara that provides
XA f þ XB ð1 f Þ
most of the mineral dust to the Amazon forest. Environ. Res. Lett. 1, 014005
where R is the isotopic ratio for element i, with concentration X of components (2006).
(end-members) A and B. The f-value in this equation represents the proportion of 20. Haug, G. H. Southward migration of the intertropical convergence zone
component A for the mixture M. The complete database used for the mixture through the holocene. Science 293, 1304–1308 (2001).
curves is provided in Supplementary Data 3 and 4.
21. Palchan, D. & Torfstein, A. A drop in Sahara dust fluxes records the northern
limits of the African humid period. Nat. Commun. 10, 3803 (2019).
Modeled total Saharan aerosol load at Lake Pata. For this estimation, we 22. Formenti, P. et al. Saharan dust in Brazil and Suriname during the large-scale
acquired the modern average dust flux both at the Lake Pata latitude and longitude biosphere-atmosphere experiment in Amazonia (LBA) - Cooperative LBA
and at the northern African margin based on the previous models5,63,64. We also Regional Experiment (CLAIRE) in March 1998. J. Geophys. Res. 106, 14919
acquired the dust flux model for the past 6 kyr64, the Last Glacial Maximum (LGM)63, (2001).
and the dust deposition estimation in the North African margin from marine sedi- 23. Rizzolo, J. A. et al. Soluble iron nutrients in Saharan dust over the central
ment cores65. We observed a good correlation (R2 = 0.93) between the estimated Amazon rainforest. Atmos. Chem. Phys. 17, 2673–2687 (2017).
aerosol and dust deposited in marine sediment cores, which allowed us to estimate 24. Ben-Ami, Y. et al. Transport of Saharan dust from the Bodélé Depression to
how much of this dust flux would reach the Lake Pata site during the last ~7 kyr. For the Amazon Basin: a case study. Atmos. Chem. Phys. Discuss. 10, 4345–4372
complementary curves, see Supplementary Fig. 4. (2010).
25. Köppen, Wladimir, Geiger, R. Handbuch der Klimatologie: Das geographische
Data availability System der Klimate (Verlag von Gebrüder Borntraeger, 1936).
The data generated for this paper are available at https://www.ncdc.noaa.gov/paleo- 26. Kottek, M., Grieser, J., Beck, C., Rudolf, B. & Rubel, F. World map of the
search/study/30893. The authors declare that the data supporting the findings of this Köppen-Geiger climate classification updated. Meteorol. Zeitschrift 15,
study are available within the paper and its supplementary information files. 259–263 (2006).
COMMUNICATIONS EARTH & ENVIRONMENT | (2021)2:5 | https://doi.org/10.1038/s43247-020-00071-w | www.nature.com/commsenv 9ARTICLE COMMUNICATIONS EARTH & ENVIRONMENT | https://doi.org/10.1038/s43247-020-00071-w
27. Bush, M. B., De Oliveira, P. E., Colinvaux, P. A., Miller, M. C. & Moreno, J. E. 57. Kaufman, Y. J. et al. Dust transport and deposition observed from the Terra-
Amazonian paleoecological histories: one hill, three watersheds. Palaeogeogr. Moderate Resolution Imaging Spectroradiometer (MODIS) spacecraft over
Palaeoclimatol. Palaeoecol. 214, 359–393 (2004). the Atlantic Ocean. J. Geophys. Res. D Atmos. 110, 1–16 (2005).
28. Bush, M. B. et al. Holocene fire and occupation in Amazonia: records from 58. Talbot, R. W. et al. Aerosol chemistry during the wet season in Central
two lake districts. Philos. Trans. R. Soc. Lond. B Biol. Sci. 362, 209–218 (2007). Amazonia: the influence of long-range transport. J. Geophys. Res. 95,
29. Nascimento, M. N. et al. Vegetation response to climatic changes in western 16955–16969 (1990).
Amazonia over the last 7,600 years. J. Biogeogr. 46, 2389–2406 (2019). 59. Hawkesworth, C. J. et al. 143Nd/144Nd,87Sr/86Sr, and incompatible element
30. Bush, M. B., Miller, M. C., De Oliveira, P. E. & Colinvaux, P. A. Orbital forcing variations in calc-alkaline andesites and plateau lavas from South America.
signal in sediments of two Amazonianlakes. J. Paleolimnol 27, 341–352 (2002). Earth Planet. Sci. Lett. 42, 45–57 (1979).
31. Cordeiro, R. C. et al. Biogeochemical indicators of environmental changes 60. Kurbatov, A. V. et al. A 12,000 year record of explosive volcanism in the Siple
from 50Ka to 10Ka in a humid region of the Brazilian Amazon. Palaeogeogr. Dome Ice Core, West Antarctica. J. Geophys. Res. 111, D12307 (2006).
Palaeoclimatol. Palaeoecol. 299, 426–436 (2011). 61. Cole, J. M., Goldstein, S. L., deMenocal, P. B., Hemming, S. R. & Grousset, F.
32. Santos, G. M. et al. Chronology of the atmospheric mercury in Lagoa Da Pata E. Contrasting compositions of Saharan dust in the eastern Atlantic Ocean
Basin upper Rio Negro region of Brazilian Amazon. Radiocarbon 43, 801–808 during the last deglaciation and African Humid Period. Earth Planet. Sci. Lett.
(2001). 278, 257–266 (2009).
33. Barbosa, J. et al. 14C-AMS as a tool for the investigation of mercury 62. Skonieczny, C. et al. African humid periods triggered the reactivation of a
deposition at a remote Amazon location. Nucl. Instrum. Methods Phys. Res. large river system in Western Sahara. Nat. Commun. 6, 6–11 (2015).
Sect. B Beam Interact. Mater. Atoms 223–224, 528–534 (2004). 63. Muhs, D. R., Budahn, J. R., Prospero, J. M., Skipp, G. & Herwitz, S. R. Soil
34. Van Der Hammen, T. & Hooghiemstra, H. Neogene and quaternary history of genesis on the island of Bermuda in the quaternary: the importance of African
vegetation, climate, and plant diversity in Amazonia. Quat. Sci. Rev. 19, dust transport and deposition. J. Geophys. Res. Earth Surf. 117, 1–26 (2012).
725–742 (2000). 64. Egerer, S., Claussen, M., Reick, C. & Stanelle, T. The link between marine
35. Anhuf, D. et al. Paleo-environmental change in Amazonian and African sediment records and changes in Holocene Saharan landscape: simulating the
rainforest during the LGM. Palaeogeogr. Palaeoclimatol. Palaeoecol. 239, dust cycle. Clim. Past 12, 1009–1027 (2016).
510–527 (2006). 65. McGee, D., deMenocal, P. B., Winckler, G., Stuut, J. B. W. & Bradtmiller, L. I.
36. D’Apolito, C., Absy, M. L. & Latrubesse, E. M. The Hill of Six Lakes revisited: The magnitude, timing and abruptness of changes in North African dust
new data and re-evaluation of a key Pleistocene Amazon site. Quat. Sci. Rev. deposition over the last 20,000 yr. Earth Planet. Sci. Lett. 371–372, 163–176
76, 140–155 (2013). (2013).
37. Colinvaux, P. A., de Oliveira, P. E., Moreno, J. E., Miller, M. C. & Bush, M. B. 66. Shanahan, T. M. et al. The time-transgressive termination of the African
A long pollen record from lowland Amazonia: forest and cooling in glacial humid period. Nat. Geosci. 8, 140–144 (2015).
times. Science 274, 85–88 (1996). 67. Prado, L. F., Wainer, I., Chiessi, C. M., Ledru, M.-P. & Turcq, B. Mid-
38. Grousset, F. E. et al. Antarctic (Dome C) ice-core dust at 18 k.y. B.P.: isotopic Holocene climate reconstruction for eastern South America. Clim. Past
constraints on origins. Earth Planet. Sci. Lett. 111, 175–182 (1992). Discuss. 8, 5925–5961 (2012).
39. Grousset, F. E. & Biscaye, P. E. Tracing dust sources and transport patterns 68. Absy, M. L. et al. Mise en évidence de quatre phase d’ouverture de la forêt
using Sr, Nd and Pb isotopes. Chem. Geol. 222, 149–167 (2005). dens le sud-est de l’Amazonie au cours des 60000 derniéres années. Première
40. Basile, I. et al. Patagonian origin of glacial dust deposited in East Antarctica comparaison avec d’autres régions tropicales. C. R. Acad. Sci. Paris 2, 673–678
(Vostok and Dome C) during glacial stages 2, 4 and 6. Earth Planet. Sci. Lett. (1991).
146, 573–589 (1997). 69. Mayle, F. E. & Power, M. J. Impact of a drier Early-Mid-Holocene climate
41. Delmonte, B. et al. Aeolian dust in the Talos Dome ice core (East Antarctica, upon Amazonian forests. Philos. Trans. R. Soc. Lond. B Biol. Sci. 363,
Pacific/Ross Sea sector): Victoria Land versus remote sources over the last two 1829–1838 (2008).
climate cycles. J. Quat. Sci. 25, 1327–1337 (2010). 70. Sifeddine, A. et al. Variations of the Amazonian rainforest environment: a
42. Delmonte, B. et al. Modern and Holocene aeolian dust variability from Talos sedimentological record covering 30,000 years. Palaeogeogr. Palaeoclimatol.
Dome (Northern Victoria Land) to the interior of the Antarctic ice sheet. Palaeoecol. 168, 221–235 (2001).
Quat. Sci. Rev. 64, 76–89 (2013). 71. McGee, D., Donohoe, A., Marshall, J. & Ferreira, D. Changes in ITCZ location
43. Prospero, J. M., Glaccum, R. A. & Nees, R. T. Atmospheric transport of soil and cross-equatorial heat transport at the Last Glacial Maximum, Heinrich
dust from Africa to South America. Nature 289, 570–572 (1981). Stadial 1, and the mid-Holocene. Earth Planet. Sci. Lett. 390, 69–79 (2014).
44. Rolph, G., Stein, A. & Stunder, B. Real-time environmental applications and 72. Shimizu, M. H., Sampaio, G., Venancio, I. M. & Maksic, J. Seasonal changes of
display sYstem: READY. Environ. Model. Softw. 95, 210–228 (2017). the South American monsoon system during the Mid-Holocene in the
45. Stein, A. F. et al. NOAA’s HYSPLIT atmospheric transport and dispersion CMIP5 simulations. Clim. Dyn. 54, 2697–2712 (2020).
modeling system. Bull. Am. Meteorol. Soc 96, 2059–2077 (2015). 73. deMenocal, P. et al. Abrupt onset and termination of the African Humid
46. Alonso-Pérez, S., Cuevas, E., Querol, X., Guerra, J. C. & Pérez, C. African dust Period: rapid climate responses to gradual insolation forcing. Quat. Sci. Rev
source regions for observed dust outbreaks over the Subtropical Eastern North 19, 347–361 (2000).
Atlantic region, above 25°N. J. Arid Environ. 78, 100–109 (2012). 74. Kropelin, S. et al. Climate-driven ecosystem succession in the Sahara: the past
47. Zielhofer, C. et al. Millennial-scale fluctuations in Saharan dust supply across 6000 years. Science (80-) 320, 765–768 (2008).
the decline of the African Humid Period. Quat. Sci. Rev. 171, 119–135 (2017). 75. Ritchie, J. C., Eyles, C. H. & Haynes, C. V. Sediment and pollen evidence for
48. Escudero, M. et al. Determination of the contribution of northern Africa dust an early to mid-Holocene humid period in the eastern Sahara. Nature 314,
source areas to PM10 concentrations over the central Iberian Peninsula using 352–355 (1985).
the Hybrid Single-Particle Lagrangian Integrated Trajectory model 76. Tyson, P. D. Late-Quaternary and Holocene palaeoclimates of southern
(HYSPLIT) model. J. Geophys. Res. 111, D06210 (2006). Africa: a synthesis. South Afr. J. Geol. 102, 335–349 (1999).
49. McGowan, H. & Clark, A. Identification of dust transport pathways from Lake 77. Thomas, D. S. G., Stokes, S. & Shaw, P. A. Holocene aeolian activity in the
Eyre, Australia using Hysplit. Atmos. Environ. 42, 6915–6925 (2008). southwestern Kalahari Desert, southern Africa: significance and relationships
50. Perry, K. D., Cahill, T. A., Eldred, R. A., Dutcher, D. D. & Gill, T. E. Long- to late-pleistocene dune-building events. Holocene 7, 273–281 (1997).
range transport of North African dust to the eastern United States. J. Geophys. 78. Wanner, H. et al. Mid- to Late Holocene climate change: an overview. Quat.
Res. 102, 225–238 (1997). Sci. Rev. 27, 1791–1828 (2008).
51. Prospero, J. M. Long-term measurements of the transport of African mineral 79. Farmer, E. C., deMenocal, P. B. & Marchitto, T. M. Holocene and deglacial
dust to the southeastern United States: implications for regional air quality. J. ocean temperature variability in the Benguela upwelling region: implications
Geophys. Res. Atmos. 104, 15917–15927 (1999). for low-latitude atmospheric circulation. Paleoceanography 20, 1–16 (2005).
52. Cabos, W. et al. The South Atlantic Anticyclone as a key player for the 80. Wündsch, M. et al. Holocene environmental change along the southern Cape
representation of the tropical Atlantic climate in coupled climate models. coast of South Africa – Insights from the Eilandvlei sediment record spanning
Clim. Dyn. 48, 4051–4069 (2017). the last 8.9 kyr. Glob. Planet. Change 163, 51–66 (2018).
53. Lupo, A. R., Nocera, J. J., Bosart, L. F., Hoffman, E. G. & Knight, D. J. South 81. Cheng, H. et al. Climate change patterns in Amazonia and biodiversity. Nat.
American cold surges: types, composites, and case studies. Mon. Weather Rev. Commun. 4, 1411 (2013).
129, 1021–1041 (2001). 82. Apaéstegui, J. et al. Hydroclimate variability of the northwestern Amazon
54. Reinke, R. Das Klima Amazoniens. Dissertation, University of Tübingen, Basin near the Andean foothills of Peru related to the South American
1962. Monsoon System during the last 1600 years. Clim. Past 10, 1967–1981 (2014).
55. Kumar, A. et al. Seasonal radiogenic isotopic variability of the African dust 83. Silva Dias, P. L., Turcq, B., Silva Dias, M. A. F., Braconnot, P. & Jorgetti, T. in
outflow to the tropical Atlantic Ocean and across to the Caribbean. Earth Past Climate Variability in South America and Surrounding Regions Vol. 14
Planet. Sci. Lett. 487, 94–105 (2018). (eds Francoise, V., Sylvestre, Florence, S. & Myriam, K.) 259–281 (Springer,
56. Faure, G. Principles of Isotope Geology (Wiley, 1986). 2009).
10 COMMUNICATIONS EARTH & ENVIRONMENT | (2021)2:5 | https://doi.org/10.1038/s43247-020-00071-w | www.nature.com/commsenvYou can also read