EDITORS - JTAR. All Rights Reserved
←
→
Page content transcription
If your browser does not render page correctly, please read the page content below

Journal of Teacher Action Research 1

    JTAR                                            EDITORS

Journal of Teacher Action Research - Volume 7, Issue 2, 2021
     practicalteacherresearch.com, ISSN # 2332-2233
                © JTAR. All Rights Reserved
JTAR
Journal of Teacher Action Research
Volume 7, Issue 2, 2021

Determining the Effects of Cooperative Problem-Solving in a High School Physics    4
Setting on the Students’ Confidence, Achievement, and Participation
Sarah M. Gagermeier

Improving High School Students’ Understanding of Quadrilaterals by Using           20
Pre-Constructed Diagrams of Geogebra
Kelly A. Steffen
Matthew S. Winsor

Social Imagination Project: Fostering Empathy in Pre-Service Teachers by Reading   40
Children’s Books Featuring Characters Who Have Disabilities
Shelly Furuness
Kellie J. Esteves

Engaging With Play-Based Learning                                                  56
Rebecca Anderson
Herbert Thomas

Revisiting School Science Curriculum Through School Gardening Participatory        69
Action Research Project in Nepal
Kamal Prasad Acharya
Chitra Bahadur Budhathoki

Using PREP, a Primary Reading Engagement Program, to Motivate Primary              90
Struggling Readers
Jeannie Votypka

Teaching Mathematics with Music to Young Children and Connecting Families          114
Smita Guha
JTAR
                                        About the Journal

 Founded in 2013, the Journal of Teacher Action Research (ISSN: 2332-2233) is a peer-reviewed online
journal indexed with EBSCO that seeks practical research that can be implemented in Pre-Kindergarten
   through Post-Secondary classrooms. The primary function of this journal is to provide classroom
                  teachers and researchers a means for sharing classroom practices.

The journal accepts articles for peer-review that describe classroom practice which positively impacts
 student learning. We define teacher action research as teachers (at all levels) studying their practice
  and/or their students' learning in a methodical way in order to inform classroom practice. Articles
   submitted to the journal should demonstrate an action research focus with intent to improve the
                                           author’s practice.

                                          Editorial Team

                                               Co-Editors
      Gilbert Naizer, Ph.D.                                                April Sanders, Ph.D.
    Texas A&M University-Commerce                                        Texas A&M University-Commerce

                                             Associate Editors
          Laura Isbell, Ph.D.               Tami Morton, Ph.D.                 Susan Williams
     Texas A&M University-Commerce       Texas A&M University-Commerce   Texas A&M University-Commerce

                                     Production Editor and Webmaster
                                            Chase Young, Ph.D.
                                         Sam Houston State University

                                www.practicalteacherresearch.com
THE JOURNAL OF TEACHER ACTION RESEARCH                               20

IMPROVING HIGH SCHOOL STUDENTS’
UNDERSTANDING OF QUADRILATERALS
BY USING PRE-CONSTRUCTED DIAGRAMS
ON GEOGEBRA
Kelly A. Steffen
St. Joseph-Ogden High School

Matthew S. Winsor
Illinois State University

Abstract The purpose of this action research study was to discover a method for helping secondary students
understand the properties and relationships of special quadrilaterals. Students are more likely to work from their
concept image of a geometric shape rather than a memorized definition when asked to recall the shape’s
properties in order to solve given problems. Giving students opportunities to experience and explore examples of
each shape helps to refine and build students’ concept images of each special quadrilateral. In order to give
students the opportunity to enhance their understanding of special quadrilaterals via exploration, we created a
unit of study which employed pre-constructed diagrams created on Geogebra. We wished to discover what kind of
effect working in a dynamic environment with scaffolded activities might have on students’ understanding of
special quadrilaterals. Comparing pre- and post-assessment data from three separate classes (n = 67 students)
showed that students’ overall understanding of special quadrilaterals increased as a result of the intervention
activities. However, not all students reached the same level of understanding by the end of the unit. The
exploration-based structure of the unit allowed individualized instruction. Thus, regardless of students’ prior
knowledge, the activities from the unit provided each individual with an opportunity to grow in their
understanding of special quadrilaterals.

Keywords: teacher action research, high school geometry, Geogebra, special quadrilaterals

Introduction

Students usually rely on specific geometric examples to make sense of geometric theorems and
definitions (Cunningham & Roberts, 2010; Fujita & Jones, 2007; Tall & Vinner, 1981).
Unfortunately, when studying the properties of and relationships between special
quadrilaterals, teachers often present students with definitions of each quadrilateral at the
beginning of the unit without letting students explore the quadrilaterals themselves. Teachers
then require students to verify the definitions and deduce any additional properties of each
quadrilateral not mentioned in the definition (Salinas, Lynch-Davis, Mawhinney, & Crocker,

Journal of Teacher Action Research - Volume 7, Issue 2, Spring 2021, , ISSN # 2332-2233 © JTAR. All Rights

THE JOURNAL OF TEACHER ACTION RESEARCH                               21

2014). Unfortunately, students are rarely successful in applying memorized definitions to solve
problems involving quadrilaterals (Cunningham & Roberts, 2010). Therefore, it seems that
teachers must adjust their approach for helping students gain a conceptual understanding of
quadrilaterals.

One reason for teachers to avoid teaching quadrilaterals without student exploration is the
students’ level of geometric reasoning, commonly referred to as their van Hiele level (Van
Hiele, 1959/2004). Van Hiele emphasized that students must progress linearly through the
earlier stages of geometric understanding before being able to engage in formal deductive
reasoning, which is the highest van Hiele level (Crowley, 1987; Lai & White, 2012). Therefore, in
order for students to understand a particular special quadrilateral, they must explore concrete
examples of the shape to recognize the properties of the figure (Battista, 2007). Through the
process of viewing multiple examples of a particular special quadrilateral, students begin to
form a working definition of the given geometric shape.

I experienced this first hand during my first few years of teaching. As a new teacher, I assumed
that all of my high school geometry students had a basic understanding of each special
quadrilateral. As a class, we wrote down the properties of each shape. I required students to
memorize these properties and then immediately moved into trying to teach formal deductive
proofs involving the properties of special quadrilaterals. At the conclusion of the unit, I always
found myself frustrated. Most students could not see relationships between special
quadrilaterals nor complete formal proofs with quadrilaterals on their own. After a few years of
observing students’ difficulties with quadrilaterals, it seemed that students never truly
understood the properties of each special quadrilateral. This challenge motivated me to
discover a different way to help students understand quadrilaterals and their properties.
Therefore, the aim of this action research study is to employ a research-based teaching method
to help students better understand quadrilaterals.

My research question is as follows:
      In what ways, if at all, do students show growth in their geometric understanding of
      special quadrilaterals both during and after completing guided explorations of dynamic
      quadrilateral constructions?

Literature Review

van Hiele Levels of Understanding. In the 1950s, Pierre van Hiele noted that students learn
geometry in a linear progression. According to van Hiele, a student must advance through five
levels of thinking in order to fully understand a geometric system (Van Hiele, 1959/2004). These
five levels are now known as van Hiele Levels of Geometric Thought. The descriptions of each
van Hiele level stay relatively consistent throughout most research. Table 1 summarizes the
descriptions that have been commonly used amongst researchers (Battista, 2007; Crowley,
1987; Fujita & Jones, 2007; Gutierrez, Jaime, & Fortuny, 1991; Lai & White, 2012).

Journal of Teacher Action Research - Volume 7, Issue 2, Spring 2021, , ISSN # 2332-2233 © JTAR. All Rights
THE JOURNAL OF TEACHER ACTION RESEARCH                               22

Table 1: Descriptions of van Hiele Levels

       VAN HIELE LEVEL                                                     DESCRIPTION

       PRE-RECOGNITION (LEVEL 0)                                           Students are unable to identify many
                                                                           common shapes.

       VISUAL (LEVEL 1)                                                    Students are able to identify shapes
                                                                           according to their appearance.

       DESCRIPTIVE/ANALYTIC (LEVEL 2)                                      Students are able to characterize
                                                                           shapes by their properties.

       ORDER/RELATIONAL (LEVEL 3)                                          Students are able to form definitions
                                                                           and establish relationships between
                                                                           shapes.

       FORMAL DEDUCTION (LEVEL 4)                                          Students are able to develop and apply
                                                                           theorems within an axiomatic system.

       RIGOR (LEVEL 5)                                                     Students are able to apply geometric
                                                                           concepts to various mathematical
                                                                           systems.

As can be seen in Table 1, student-understanding of a geometric topic starts with informal
conceptualization based on previous knowledge and experiences. As students are given
opportunities to examine geometric concepts, their understanding ultimately progresses
toward a formal property-based system (Battista, 2007). Van Hiele stressed the importance of
teachers matching instructional design to meet the van Hiele level(s) of their students (van
Hiele, 1959/2004). For example, students at a van Hiele Level 1 are not ready to use a book
definition of parallelogram to deduce properties of a parallelogram. Rather, it may be more
successful for these students to view multiple examples of parallelograms with the goal of
determining what all of the examples have in common (Lai & White, 2012). Teachers must help
students construct knowledge that will allow them to progress toward being able to reason
deductively (Jones, 2000). Students cannot be expected to prove geometric properties if they
cannot first identify the properties.

Journal of Teacher Action Research - Volume 7, Issue 2, Spring 2021, , ISSN # 2332-2233 © JTAR. All Rights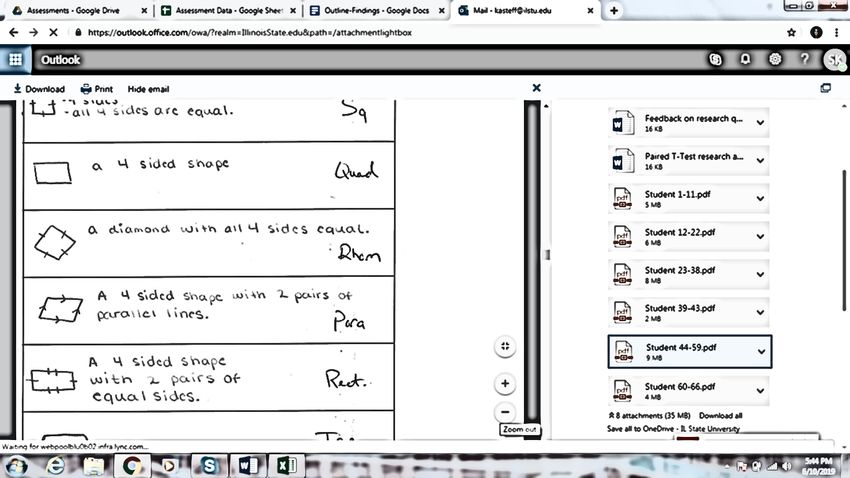
THE JOURNAL OF TEACHER ACTION RESEARCH                               23

Teachers must be aware of their students’ geometric thinking levels in order to design proper
instruction. Traditionally, van Hiele levels have been measured by the number of correct
answers on a multiple-choice test (Gutierrez, Jaime, & Fortuny, 1991; Hollebrands, 2007;
Kutluca, 2013; Usiskin, 1982; Wang & Kinzel, 2014). However, not all researchers consider van
Hiele levels to be discrete (Battista, 2007; Gutierrez, Jaime, & Fortuny, 1991). For example,
when a student transitions from one level to the next, she may demonstrate thinking from both
van Hiele levels. Because of the fluid nature of van Hiele levels, analyzing students’ responses to
open-ended questions may be more effective in determining students’ van Hiele levels.

The average high school geometry student is at a van Hiele Level 2 (Jones, 2000). At Level 2,
students can identify properties of shapes but do so on the basis of visual examples. Therefore,
students need multiple representations of geometric objects in order to increase their van Hiele
level (Crowley, 1987; Lai & White, 2012). As students become more familiar with the properties
of individual shapes, they will begin to notice relationships amongst different shapes. Students
who identify connections between objects are at a van Hiele Level 3. For example, a student at
Level 3 can deduce that a rectangle can be called a parallelogram due to having all of the
properties of a parallelogram (Fujita & Jones, 2007).
Students’ Understanding of Quadrilaterals. This study is focused on teaching special
quadrilaterals to high school geometry students. There exists a hierarchy of related geometric
characteristics between certain quadrilaterals that allows students to explore conjectures to
identify the hierarchical relationships (Salinas, Lynch-Davis, Mawhinney, & Crocker, 2014).
Before entering geometry, many high school students possess prior knowledge of certain
quadrilaterals, which comes from visual examples and/or previous encounters with the shape,
commonly referred to as a concept image (Cunningham & Roberts, 2010; Fujita & Jones, 2007;
Tall & Vinner, 1981). The concept image differs from a formal definition (also known as concept
definition) of the shape and serves as the foundation for a students’ mathematical engagement
with the object.

Because students are more likely to work from their concept image of a geometric object,
teachers should not ask students to memorize the formal definition of each special
quadrilateral in order to derive the properties of each shape. Teachers can facilitate revisions of
students’ concept images by having students explore examples and non-examples of the object
in order to achieve concept attainment, the authentic formation of a correct description of the
concept being explored (Cunningham & Roberts, 2010; Salinas, Lynch-Davis, Mawhinney, &
Crocker, 2014). Students must reach concept attainment for each type of special quadrilateral
before they can identify hierarchical relationships (Salinas, Lynch-Davis, Mawhinney, & Crocker,
2014).

In order for students to notice hierarchical relationships, they need to compare and contrast
the properties of each specific type of quadrilateral (Salinas, Lynch-Davis, Mawhinney, &
Crocker, 2014). It is critical for students to notice the properties that remain consistent
throughout most types of quadrilaterals. For example, parallelograms, rhombi, rectangles, and
squares all have two pairs of parallel opposite sides. However, differences between

Journal of Teacher Action Research - Volume 7, Issue 2, Spring 2021, , ISSN # 2332-2233 © JTAR. All Rights
THE JOURNAL OF TEACHER ACTION RESEARCH                               24

quadrilaterals occur when constraints are made to a set of properties in order to create a new
type of quadrilateral (DeVilliers, 1994). For example, in order to create a rhombus, the
additional constraint of having four congruent sides must be added to the set of properties for
a parallelogram. Hierarchical definitions allow certain types of quadrilaterals to fall into
multiple, overlapping subsets (DeVilliers, 1994). Hierarchical definitions prove to be more
advantageous for learners once they progress to a van Hiele Level 4 because it reduces the
amount of work to prove quadrilateral properties due to certain quadrilaterals being subsets of
others.

Using DGS as an Instructional Tool. Dynamic geometry software (DGS) allows users to construct
geometric objects (e.g. points and lines) as well as manipulate the objects to view geometric
relationships between various parts of the construction (Erez & Yerushalmy, 2006; Kutluca,
2013; Poon & Wong, 2017). There are many brands of DGS available to teachers (Kurtz,
Middleton, & Yanik, 2005). DGS supports inquiry-based learning by providing students multiple
examples of the same constructed figure via dragging vertices of the figure while maintaining
the constructed properties of the figure (Hollebrands, 2007; Obara & Jiang, 2009; Poon &
Wong, 2017). Geometric exploration helps students at lower van Hiele levels progress toward
deductive reasoning (Crowley, 1987).

Students must use their prior knowledge to construct figures with DGS (Battista, 2007).
However, students at lower van Hiele levels will not know the essential properties required to
accurately construct each type of quadrilateral. One way to address this challenge is to provide
students preconstructed diagrams, which allow them to view, measure, and manipulate the
components of the preconstructed geometric object (Battista, 2007; Poon & Wong, 2017).
Activities involving pre-constructed diagrams ask students to make conjectures about
properties of the figure and then to confirm their conjectures (Erez & Yerushalmy, 2006;
Hollebrands, 2007) Through this exploration process via DGS, students gain the conceptual
knowledge that may not have been accessible via lecture and memorization of definitions
(Obara & Jiang, 2009). Activities must guide students to the desired outcome of the exploration
(Jones, 2000; Kutluca, 2013). This scaffolding will provide students with an opportunity to
develop and/or refine their concept image of the geometric object being studied.

Teachers must also be aware of potential student miscues. As students manipulate a pre-
constructed object on DGS, they must realize that a pre-constructed diagram will represent a
given geometric shape regardless of how it is manipulated (Battista, 2007; Erez & Yerushalmy,
2006). The geometric properties that remain unchanged via manipulation of the diagram are
the critical attributes of the object (Erez & Yerushalmy, 2006; Hollebrands, 2007; Jones, 2000).
If students can find the critical attributes of a pre-constructed diagram, they will be able to then
advance in their van Hiele level.

Once students have identified critical attributes of quadrilaterals, DGS can guide students
towards recognizing that certain quadrilaterals can be given multiple classifications (Erez &
Yerushalmy, 2006). In this process, students identify that there are certain attributes that
various quadrilaterals share. For example, students can manipulate a rhombus in DGS to look

Journal of Teacher Action Research - Volume 7, Issue 2, Spring 2021, , ISSN # 2332-2233 © JTAR. All Rights
THE JOURNAL OF TEACHER ACTION RESEARCH                               25

like a square because both squares and rhombi have four congruent sides. It should be noted
that rhombi are not required to have four right angles, which allows students to manipulate a
rhombus in DGS to look like a square. DGS acts as a tool for students to make meaningful
connections between the various quadrilaterals.

Not all students will be at the same van Hiele level in a class therefore DGS allows for
individualized instruction (Fujita & Jones, 2007). Working on DGS with well-structured activities
can allow students to work at their own pace and at their own level of geometric thinking.
Students who need more support will have the ability to review multiple examples of the
quadrilateral, discuss what they are finding with a peer, and receive support from the teacher.
Extension problems can be written for students who work at a faster pace.

Methodology

Research Design. This action research study employed a mixed methods approach. In order to
determine if dynamic geometry software (DGS) helped students’ increase their van Hiele level
of quadrilaterals, pre- and post-assessment data was compared. Various studies have measured
the impact that DGS had on student-learning by using a similar approach (Johnson-Gentile,
Clements, & Battista, 1994; Kutluca, 2013; Pitta-Pantazi & Christou, 2009). In particular, this
study measured each student’s van Hiele level of understanding quadrilaterals before and after
the designed unit centered around student-explorations of pre-constructed diagrams on DGS.
In addition to quantitatively comparing students pre and post van Hiele scores as well as pre
and post free-write scores, we also examined students’ definitions of the various quadrilaterals
in order to describe the changes that occurred, if any.

Study Participants. This study was conducted at a rural high school in central Illinois. The
students in this study were from three different sections of the regular (as opposed to
accelerated) geometry course. Each section met every school day for a 50-minute class period.
The textbook used for this course was Core Connections Geometry by the CPM Educational
Program. All three sections were taught by the same teacher, who was also the main
researcher in this study. A total of 63 students participated in the study: 28 females and 35
males. Of these 63 students, there were twelve 9th graders, forty-three 10th graders, seven 11th
graders, and one 12th grader. Participants in this study were a diverse group of learners that
represented a variety of grades and ability levels.

Instrumentation. Two assessments were given both before and at the conclusion of a six-day
unit on quadrilaterals. The first assessment was an adapted version of Usiskin’s (1982) “van
Hiele Level of Geometric Understanding Test”. Several studies (Hollebrands, 2007; Kutluca,
2013; Wang & Kinzel, 2014) have used Usiskin’s (1982) “van Hiele Level of Geometric
Understanding Test” to measure the van Hiele levels of participants. In order to examine
students’ understanding of special quadrilaterals, we used a subset of Usiskin’s (1982) test
questions that related to quadrilaterals. The Usiskin (1982) test provides an overall assessment
of students’ van Hiele levels.

Journal of Teacher Action Research - Volume 7, Issue 2, Spring 2021, , ISSN # 2332-2233 © JTAR. All Rights
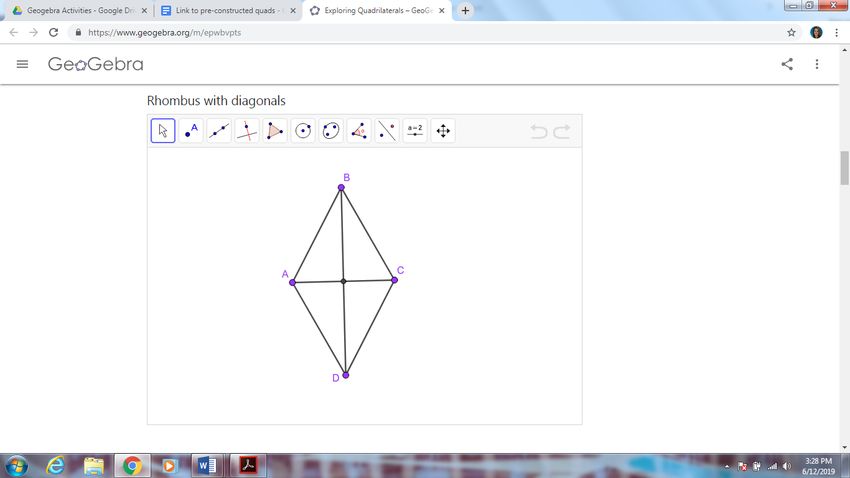
THE JOURNAL OF TEACHER ACTION RESEARCH                               26

The second assessment was a free-write about each special quadrilateral studied during the
unit. Because researchers have found that a student’s van Hiele level may differ from topic to
topic (Gutierrez, Jaime, & Fortuny, 1991), we asked students to share their concept image for
each special quadrilateral in order to detect subtle changes in students’ van Hiele levels. Each
free-write response was given a van Hiele level rating based on a rubric adapted from Gutierrez,
Jaime, and Fortuny (1991). Because students studied seven different shapes, they received
seven separate van Hiele level scores on the free-write.

Procedures. This study took place during a six-day unit on quadrilaterals (namely trapezoids,
parallelograms, rhombi, rectangles, squares, kites, and general quadrilaterals). We decided that
six days was sufficient for students to thoroughly examine the different quadrilaterals.
Moreover, given the curriculum requirements placed on us by the school district, six days was
the largest number of days we could afford to dedicate to the unit on quadrilaterals. Before the
unit began, students individually completed the multiple choice and free-write assessments.
Students who were classified at the same van Hiele level were then partnered to work
together. Placing students in homogenous pairs eliminated some variability when trying to
determine the impact that DGS had on students’ van Hiele levels. Pairing students also
addressed the limited number of computers available for student use.

After receiving instruction about the goals of the unit, students worked in pairs through each
guided activity. Each pair of students worked for roughly forty-five minutes each day on the
guided activities. Every activity required students to manipulate the pre-constructed diagrams
using DGS on the computer (see Figure 1) in order to make observations about the shape with
their partner. For example, students moved vertex B to vary the appearance of the rhombus to
determine which geometric properties remained constant.

Figure 1: Sample pre-constructed rhombus on DGS used for the activities

Journal of Teacher Action Research - Volume 7, Issue 2, Spring 2021, , ISSN # 2332-2233 © JTAR. All Rights
THE JOURNAL OF TEACHER ACTION RESEARCH                               27

Each activity had extension questions for students who completed their work early. The
extension questions focused on trapezoids and kites, figures which do not receive much
attention in textbooks. At the end of Activity 2, students produced a definition for each type of
quadrilateral. Students’ responses provided a formative assessment that helped the teacher
measure progress mid-way through the study.

On the final day(s) of the unit, students shared their definitions of each quadrilateral with the
class. The class then worked to synthesize their classmates’ definitions in order to establish a
class definition of each quadrilateral. Students also proposed hierarchical relationships between
quadrilaterals. On the final day of the study, students took the two post-assessments.

Data Analysis

van Hiele Level Test. The multiple choice pre-/post-assessments were scored using the method
found in Usiskin (1982) in order to assign each student a van Hiele level (see Figure 2). We then
compared the mean scores of the pre and posttest using a one-tailed paired t-test (Cheraq &
Shahvarani, 2017; Fields, 2005; Hsu & Lachenbruch, 2005). Our hypotheses are as follows:
HO: µd = 0.
HA: µd ¹ 0

We chose to use an a-level of 0.10 because we were implementing the activities described
above for the first time with a relatively small number of students and felt that (p < 0.10) would
give us a sense of the potential of the activities for improving students van Hiele levels
(Schumm, Pratt, Hartenstein, Jenkins, & Johnson, 2013; Taylor, 2020).

 Scoring the Test (Usiskin, 1982):
      •     Each group of 5 consecutive questions represents a van Hiele level.
      •     If a student answers 3 or more questions from the group of 5 correctly, the
            student is considered to have achieved the corresponding van Hiele level.
      •     A student cannot “skip” a van Hiele level. Therefore, the first time a student
            misses 3 or more questions from a group of 5 questions, their van Hiele level
            has been set.

Figure 2: Scoring procedures for multiple choice pre-/post-assessments

Free-write Assessment. Each of the seven responses on a student’s free-write assessment was
assigned a van Hiele level based on the adapted rubric from Gutierrez, Jaime, and Fortuny
(1991) (See Figure 3). Scoring was completed separately by two different researchers in order
to minimize any bias and assure validity. We analyzed the data in two ways. First, we used a
one-tailed paired t-test to compare the pre- and post-scores for each quadrilateral. We set our

Journal of Teacher Action Research - Volume 7, Issue 2, Spring 2021, , ISSN # 2332-2233 © JTAR. All Rights
THE JOURNAL OF TEACHER ACTION RESEARCH 28
alpha at 0.10 and our null hypothesis was that for each quadrilateral, the means for the pre-
and post-free-write would be the same.
Next, we used the constant comparative method (Glaser & Strauss, 1967) to identify subtle
patterns in the changes between pre- and post-free-write assessments. We hoped to be able to
describe patterns of change (or lack of change) for the various quadrilaterals given the complex
nature of students’ transitions between different van Hiele levels (Battista, 2007; Gutierrez,
Jaime, & Fortuny, 1991).
Level 0 (pre- -Student leaves description blank
recognition) -Nothing in the description is correct
Level 1 -Student describes the visual appearance of the shape (“It looks like”)
(recognition) -Student only draws an accurate picture of the shape (without
geometric markings representing properties)
-Student’s entire written description includes only irrelevant geometric
attributes
Level 2 -Student uses correct geometric properties to describe the shape
(Descriptive) (although some properties may be incorrect or left out)
-Student describes the shape in isolation of the other special
quadrilaterals
Level 3 (Relational) -Student uses correct inclusive classification or explains how a given
shape is related to the other from the unit
-Student mentions all of the necessary properties of the shape (and all
additional properties are accurate with no mistakes)
Figure 3: Rubric for scoring the free-write pre-/post-assessments
Figure 4 shows examples of student responses to the term parallelogram along with their van
Hiele level rating. We transcribed students’ answers to the right for the reader to be able to
understand students’ writing. No details in Student A’s response (Level 0) were correct. Student
B’s response (Level 1) focused on the visual appearance of a stereotypical parallelogram as well
as provided a basic diagram of the shape. Although Student C (Level 2) and D’s (Level 3)
responses look very similar due to each listing several properties of parallelograms, Student D’s
response also included relationships parallelograms have with other special quadrilaterals.
Student A have 8 side but at different
lengths
van Hiele Level 0
Student B Slanted square
van Hiele Level 1
Journal of Teacher Action Research - Volume 7, Issue 2, Spring 2021, , ISSN # 2332-2233 © JTAR. All RightsTHE JOURNAL OF TEACHER ACTION RESEARCH 29
A shape with 2 pairs of çç sides
opposite sides and angles are =
Student C
diagonals do not bisect angles or
van Hiele Level 2
each other but do cross
quadrilateral w/ 2 prs of ççsides
Student D opp Ð’s =
van Hiele Level 3 sometimes – square, rectangle,
kite, rhombus always –
quad/trap
Figure 4: Sample student-responses for “parallelogram” representing each van Hiele Level
Results
The students’ average overall van Hiele level for quadrilaterals before the unit was (M = 1.54,
SD = 1.01) and after the unit was (M = 1.78, SD = 1.30). The results of the paired t-test showed t
(62) = 1.56, p = 0.062. We therefore rejected the null hypothesis that the pre and posttest
means were the same. Therefore, it seems that the intervention given between the pre-test
and post-test had an effect in helping students increase their overall van Hiele levels. Given the
more general nature of the van Hiele level test, we decided to examine each quadrilateral for
changes between the pre- and post-implementations of the free-write assessment.
In order to quantify the changes in van Hiele levels for each quadrilateral, we used a one-tailed
paired t-test to see if there was a significant difference between the pre- and post-scores of
students’ definitions. Our null hypothesis was that there would be no difference between the
pre- and post-scores. Table 2 contains the 63 students’ average van Hiele levels for each
quadrilateral as well as the p-value for the one-tailed paired t-test and the Cohen’s D score to
determine effect size (Fritz, Morris, & Richler, 2012). Again, we set our alpha level at 0.10.
Table 2: Comparison of average score on free-write assessment
COMPARISON OF AVERAGE SCORE ON FREE WRITE PRE-TEST AND POST-TEST (N=63)
SHAPE Pre-Test Post-Test P-value Cohen’s D
SQUARE 1.98 2.41 p < 0.0000 d = 1.38
RECTANGLE 1.89 2.33 p < 0.0000 d = 1.08
Journal of Teacher Action Research - Volume 7, Issue 2, Spring 2021, , ISSN # 2332-2233 © JTAR. All RightsTHE JOURNAL OF TEACHER ACTION RESEARCH 30 QUADRILATERAL 1.60 2.37 p < 0.0000 d = 1.02 PARALLELOGRAM 1.56 2.21 p < 0.0000 d = 1.12 KITE 1.46 1.81 p < 0.0000 d = 0.62 TRAPEZOID 1.43 2.17 p < 0.0000 d = 1.00 RHOMBUS 1.22 2.22 p < 0.0000 d = 1.47 Given that the p-value for each shape was p < 0.0000, we can reject the null hypothesis that there was no significant difference in the scores. Further, as can be seen in Table 2, Cohen’s effect size value for each shape suggests that there was a significant effect from the activities in the unit when comparing pre- to post-test performances on the free-write assessments. Note that a score equal to one indicates that the difference between the pre- and post-scores is one full standard deviation. This is considered a large effect size (McLeod, 2019). Each student’s pre/post free-write was then compared to determine how many students showed growth. Each student could show an increase in van Hiele levels for up to seven quadrilaterals. As noted in Table 3, 34.92% of the students showed an increase in score for three out of the seven quadrilaterals, which was the most frequent occurrence. Only two students (3.17%) increased their score on all seven shapes. However, 82.54% of the students increased their score for at least three out of the seven shapes after completing the exploration activities. Table 3: Frequency of increase in score on free-write exam FREQUENCY OF INCREASE IN SCORE WHEN COMPARING FREE-WRITE PRE-TEST AND POST- TEST (N=63) NUMBER OF SHAPES THAT STUDENT Number of students Percentage of the INCREASED SCORE ON showing this increase sample studied 7 SHAPES 2 3.17% 6 SHAPES 6 9.52% 5 SHAPES 12 19.05% 4 SHAPES 10 15.87% 3 SHAPES 22 34.92% 2 SHAPES 8 12.70% 1 SHAPE 3 4.76% Journal of Teacher Action Research - Volume 7, Issue 2, Spring 2021, , ISSN # 2332-2233 © JTAR. All Rights
THE JOURNAL OF TEACHER ACTION RESEARCH                               31

 0 SHAPES                                                     0                                            0.00%

Although all students increased in at least one score on the free-write assessment, we were
also interested in the cases when students’ scores did not increase. In fact, out of the 441
quadrilateral definitions we examined (seven definitions per student times 63 participants),
44.67% of the responses were rated the same van Hiele level (See Table 4). Of the scores that
did not change, 87.31% were scored at a van Hiele Level 2.

Table 4: Frequency of cases when a free-write response score was maintained

 LEVEL OF UNDERSTANDING WHEN SCORE WAS MAINTAINED FROM PRE-
 TEST TO POST-TEST (N=197)

 LEVEL OF UNDERSTANDING                                  Frequency                             Percentage

 LEVEL 0                                                 3                                     1.52%

 LEVEL 1                                                 15                                    7.61%

 LEVEL 2                                                 172                                   87.31%

 LEVEL 3                                                 7                                     3.55%

Given the majority of unchanged van Hiele levels were at a Level 2, we were curious to see if
there was potential growth within the van Hiele Level 2. Figure 5 below shows the Level 2 rating
from our rubric for the free-write (Gutierrez, Jaime, & Fortuny, 1991).

 Level 2                     -Student uses correct geometric properties to describe the shape
 (Descriptive)               (although some properties may be incorrect or left out)
                             -Student describes the shape in isolation of the other special
                             quadrilaterals
Figure 5: van Hiele level two (adapted from Gutierrez, Jaime, & Fortuny, 1991)

We used the constant comparative method (Glaser & Strauss, 1967) to classify the 172 cases of
students who remained at van Hiele Level 2. We arrived at two categories: shows growth within
Level 2 and does not show growth within Level 2. Figure 6 provides how we categorized the 172
student responses. We found that 82 out of the 172 responses showed growth within a Level 2.
Note that students who showed growth within a Level 2 added to their knowledge of the
particular quadrilateral but were still unable to identify hierarchical relationships between
different quadrilaterals, which would classify the response as a van Hiele level 3.

 Rubric for Sorting Free-Write Responses that Maintained a Level 2 Score from Pre- to Post-
 Test

Journal of Teacher Action Research - Volume 7, Issue 2, Spring 2021, , ISSN # 2332-2233 © JTAR. All Rights
THE JOURNAL OF TEACHER ACTION RESEARCH 32
Category 1: Shows growth within Level 2 Category 2: Does not show growth within
Level 2
-Student listed additional properties of the -Student’s pre- and post-test response were
shape on the post-test identical
-Student eliminated listing irrelevant -Student may have added additional
properties of the shape on the post-tests properties of the shape on the post-test,
however, did not include the essential
-Students showed a shift in focus to characteristic(s) that sets the shape apart
relationships the shape had with other from the other special quadrilaterals
shapes, however, the explanations were
incomplete
Figure 6: Categorical classification for sorting Level 2 free-write responses
In order to give us a more complete description of student growth, we sought to describe
patterns in the type of growth between the pre- and post-free-write assessment. We noticed
that there were different types of growth occurring with our students. Each pre/post definition
fell into one of four groups described below in Table 5.
Table 5: Categorization of how free-write definitions changed from pre- to post-assessment
TYPE OF GROWTH DESCRIPTION OF GROWTH
HIGH LEVEL 1 TO Student’s pre definition focuses on the look of the figure (e.g. it looks
LOW LEVEL 2 like a diamond). Student’s post definition shifts to listing a few
characteristics of the figure (e.g. it has parallel sides).
LOW LEVEL 2 TO Student’s pre definition lists a few characteristics of the figure (e.g. it
HIGH LEVEL 2 has parallel sides). Student’s post definition shifts to an extensive list
of characteristics of the figure. The post definition does not mention
hierarchical relationships with other quadrilaterals (e.g. a square is a
rectangle with equal sides).
HIGH LEVEL 2 TO A The student’s pre definition has an extensive list of characteristics of
LEVEL 3 the quadrilateral without mentioning hierarchical relationships with
other quadrilaterals. Student’s post definition shifts to the
hierarchical relationships with other quadrilaterals (e.g. a square is a
rectangle with equal sides).
NO GROWTH Student’s definition did not change.
SHOWN
Journal of Teacher Action Research - Volume 7, Issue 2, Spring 2021, , ISSN # 2332-2233 © JTAR. All RightsTHE JOURNAL OF TEACHER ACTION RESEARCH 33
As can be seen in Table 6, when assigning all 441 responses to a group, responses were
somewhat evenly divided at around 25% representation for each group.
Table 6: Grouping free-write responses based on the growth shown
GROWTH SHOWN IN COMPARING STUDENT PRE-/POST-TEST FREE WRITE
RESPONSES (N=441)
TYPE OF GROWTH Frequency Percentage
HIGH LEVEL 1 TO 109 24.72%
LOW LEVEL 2
LOW LEVEL 2 TO 82 18.59%
HIGH LEVEL 2
HIGH LEVEL 2 TO 126 28.57%
LOW LEVEL 3
NO GROWTH 124 28.12%
SHOWN
Figure 6 shows examples representing each type of growth described in the table above. Before
the unit, Student E described a rectangle on the basis of the appearance (Level 1) but ended the
unit describing a non-exhaustive list of its properties (low Level 2). Student F began the unit
where Student E ended (low Level 2) but listed more properties of a rectangle by the end of the
unit (high Level 2). Finally, Student G entered the unit understanding most properties of the
rectangle (high Level 2) and as a result of the intervention ended the unit recognizing the
hierarchical relationships the rectangle had with other special quadrilaterals (entering Level 3).
Student E: High level 1 to low Level 2
Student
F: Low
Level 2
to High Level 2
Student G: High Level 2 to Low Level 3
Figure 7: Examples of student pre-/post-test responses falling into each growth group
Journal of Teacher Action Research - Volume 7, Issue 2, Spring 2021, , ISSN # 2332-2233 © JTAR. All RightsTHE JOURNAL OF TEACHER ACTION RESEARCH 34 Discussion When reflecting on the findings, three pieces of data support the fact that students’ knowledge of quadrilaterals increased due to participating in the guided exploration activities of the pre- constructed dynamic shapes on Geogebra. First, students showed a significant increase in van Hiele level scores on the multiple-choice assessment. Additionally, there was a significant difference between students’ pre- and post-definitions for every quadrilateral. Finally, when looking at progress for individual students, all participants increased their knowledge for at least one quadrilateral from the unit: emphasizing that a majority of students increased their van Hiele level for at least three quadrilaterals. As with any activity implemented for the first time, we found that several questions arose from the results. One trend we observed was students’ van Hiele levels were not the same for each quadrilateral. On average, the participants had a stronger understanding of squares and rectangles as compared to all other special quadrilaterals. When the free-write pre-assessment was administered, many of the students skipped immediately to the questions that asked them to share their knowledge of the “square” and “rectangle” before attempting to write about any other shape. In many cases, these two written responses were scored higher than the responses for the five remaining shapes. However, after working through the unit and then taking the post-assessment, the students in the study showed less growth for squares and rectangles as compared to the other special quadrilaterals. We hypothesize that students may have lacked motivation in furthering their understanding of squares and rectangles because they believed their pre-existing concept image of these two shapes was sufficient. Another trend we noticed was common misconceptions for certain quadrilaterals. The frequency of these misconceptions prompted researchers to wonder about how students experienced the quadrilaterals in previous lessons. First, many students claimed that a trapezoid must be isosceles, in other words, that the two non-parallel sides were congruent. Although the default setting for the pre-constructed dynamic trapezoid used in Geogebra was not isosceles, it seemed that students’ pre-existing concept image of a trapezoid was so deeply rooted that students were unable to overcome this misconception. Although students had difficulty with trapezoids, the intervention did help students correct some misconceptions. In particular, many students entered the unit thinking that rhombi and parallelograms have “slanted” sides whereas rectangles and squares have “horizontal” and “vertical” sides. Given that quadrilaterals are usually presented in textbooks with one side serving as the base, students’ erroneous definitions seem reasonable. Students were able to overcome their misconceptions while using the tools on Geogebra because of the ability to orient the quadrilateral in any direction. One finding that surprised us was that some students achieved a lower post van Hiele level rating. We wondered if the activity caused cognitive conflict within the student. In the pre-test, students may have provided memorized definitions that would receive a higher van Hiele Journal of Teacher Action Research - Volume 7, Issue 2, Spring 2021, , ISSN # 2332-2233 © JTAR. All Rights
THE JOURNAL OF TEACHER ACTION RESEARCH                               35

rating. Participating in student-led exploration that emphasized justifications of student claims
may have caused students to question their memorized definition. As a result, the van Hiele
level decreased because students were providing their own definition driven by a concept
image instead of a memorized definition.

Conclusion

The motivation behind this research study was realizing that a high school geometry curriculum
did not match students’ van Hiele levels. Textbook activities attempted to promote formal
deductive reasoning without providing foundational knowledge necessary to arrive at formal
deductive reasoning. Results from this study seem to show that students can progress towards
formal deductive reasoning via exploration and analysis of preconstructed quadrilaterals. This
study also adds to the body of literature (Kutluca, 2013; Obara & Jiang, 2009) on the capabilities
of DGS to help students transition through the stages of learning geometric content.

The findings also generated more questions as well as observations for how to improve the
implementation of the geometry unit discussed in this paper. First, we observed that we need
checkpoints in the activities in order to hold students responsible for their work as well as serve
as formative feedback for the teacher. We also realized that we had unintentionally created a
learning ceiling with the activities. The designed activities were not written to help students
move beyond a van Hiele Level 3. Therefore, in the future, we hope to add activities that will
allow the students at a van Hiele level 3 to move into a van Hiele Level 4 which focuses on
deductive understanding of quadrilaterals.

Although we hoped for greater student growth, we feel that adjusting the activities and
implementation of the unit could potentially bring about even greater improvement in high
school students’ understanding of quadrilaterals. It is our hope that teachers will try out these
activities in their high school geometry classrooms and help improve this geometric unit that
pairs inquiry-based learning with technology.

Journal of Teacher Action Research - Volume 7, Issue 2, Spring 2021, , ISSN # 2332-2233 © JTAR. All Rights
THE JOURNAL OF TEACHER ACTION RESEARCH                               36

About the Authors

Kelly A. Steffen is a mathematics teacher at St. Joseph-Ogden High School in St. Joseph, Illinois.
She teaches algebra, geometry, and calculus to 9th-12th grade students. Kelly believes that
interactive technology can be an effective tool to promote exploratory learning and assist
students in discovering mathematical concepts. Kelly holds a BS in Mathematics for Secondary
Education from Indiana State University and a Master’s Degree in Mathematics from Illinois
State University. Email: steffenk@sjo.k12.il.us

Matthew S. Winsor is an associate professor in the mathematics department at Illinois State
University. His main foci are preparing preservice teachers to be effective in the mathematics
classroom and helping inservice teachers study their own practice in order to learn and grow as
a teacher. Having five children of his own serves as inspiration for Matthew’s work. Email:
mwinsor@ilstu.edu

Journal of Teacher Action Research - Volume 7, Issue 2, Spring 2021, , ISSN # 2332-2233 © JTAR. All Rights
THE JOURNAL OF TEACHER ACTION RESEARCH                               37

                                                               References

Battista, M. T. (2007). The development of geometric and spatial thinking. In F. K. Lester (Ed.), Second
         handbook of research on mathematics teaching and learning (pp. 843–908). Charlotte, NC:
         Information Age.

Cheraq, Pari & Shahvarani, Ahmad. (2017). An Investigation on the impact of using problem-based
        trainings in the in-service courses on the teachers' performance and capabilities, by relying on
        the elementary sixth grade mathematics book (case study: the city of Ahvaz). Mathematics
        Education Trends and Research. 2017. 12-23. 10.5899/2017/metr-00092.

Crowley, M. (1987). The van Hiele model of the development of geometric thought. In M. Lindquist
       (Ed.), Learning and teaching geometry, K-12 (pp. 1–16). Reston, VA: NCTM.

Cunningham, R. F., & Roberts, A. (2010). Reducing the mismatch of geometry concept definitions and
       concept images held by pre-service teachers. Issues in the Undergraduate Mathematics
       Preparation of School Teachers, 1.

DeVilliers, M. (1994). The role and function of a hierarchical classification of quadrilaterals. For the
         Learning of Mathematics. 14(1) 11 – 18.

Erez, M. M., & Yerushalmy, M. (2006). “If you can turn a rectangle into a square, you can turn a square
        into a rectangle…” Young students experience with the dragging tool. International Journal of
        Computers for Mathematical Learning, 11, 271–299.

Fields, A. (2005). Discovering statistics using SPSS. Beverly Hills: Sage Publications, 541.

Fritz, Morris, & Richler (2012). Effect size estimates: Current use, calculations, and interpretation.
        Journal of Experimental Psychology, 141, 2–18.

Fujita, T., & Jones, K. (2007). Learners’ understanding of the definitions and hierarchical classification of
         quadrilaterals: towards a theoretical framing. Research in Mathematics Education, 9, 3–20.

Glaser, B. G., & Strauss, A. L. (1967). The discovery of grounded theory: Strategies for qualitative
        research. New Brunswick, NJ: Aldine Transaction.

Gutierrez, A., Jaime, A., & Fortuny, J. (1991). An alternative paradigm to evaluate the acquisition of the
        van Hiele levels. Journal for Research in Mathematics Education, 22, 237–251.

Hollebrands, K. (2007). The role of a dynamic software program for geometry in the strategies high
        school mathematics students employ. Journal for Research in Mathematics Education, 38, 164–
        192.

Hsu, H., & Lachenbruch, P. A. (2005). Paired t test. Encyclopedia of Biostatistics, 6.

Journal of Teacher Action Research - Volume 7, Issue 2, Spring 2021, , ISSN # 2332-2233 © JTAR. All Rights
THE JOURNAL OF TEACHER ACTION RESEARCH 38
Johnson-Gentile, K., Clements, D., & Battista, M. (1994). Effects of computer and noncomputer
environments on students’ conceptualizations of geometric motions. Journal of Educational
Computing Research, 11, 121–140.
Jones, K. (2000). Providing a foundation for deductive reasoning: Students' interpretations when using
dynamic geometry software and their evolving mathematical explanations. Educational Studies
in Mathematics, 44, 55–85.
Kurtz, T. L., Middleton, J. A., & Yanik, H. E. (2005). A taxonomy of software for mathematics instruction.
Contemporary Issues in technology & Teacher Education. 5(2), 123 – 137.
Kutluca, T. (2013). The effect of geometry instruction with dynamic geometry software; Geogebra on
van Hiele geometry understanding levels of students. Educational Research and Reviews, 8,
1509–1518.
Lai, K., & White, T. (2012). Exploring quadrilaterals in a small group computing environment. Computers
and Education, 59, 963–973.
McLeod, S. A. (2019, July 10). What does effect size tell you? Simply psychology. Retrieved from
https://www.simplypsychology.org/effect-size.html
Obara, S., & Jiang, Z. (2009). Using dynamic geometry software to investigate midpoint quadrilateral.
The Electronic Journal of Mathematics and Technology, 3.
Pitta-Pantazi, D., & Christou, C. (2009). Cognitive styles, dynamic geometry and measurement
performance. Educational Studies in Mathematics, 70, 5–26.
Poon, K., & Wong, K. (2017). Pre-constructed dynamic geometry materials in the classroom – how do
they facilitate the learning of ‘similar triangles’? International Journal of Mathematical
Education in Science and Technology, 48, 735–755.
Salinas, T., Lynch-Davis, K., Mawhinney, K., & Crocker, D. (2014). Exploring quadrilaterals to reveal
teachers’ use of definitions: Results and implications. Australian Senior Mathematics Journal, 28,
50–59.
Schumm, W. R., Pratt, K. K., Hartenstein, J. L., Jenkins, B. A., & Johnson, G. A. (2013) Determining
statistical significance (alpha) and reporting statistical trends: controversies, issues, and facts.
Comprehensive Psychology, 2, 10.
Tall, D., & Vinner, S. (1981). Concept image and concept definition in mathematics with particular
reference to limits and continuity. Educational Studies in Mathematics, 12, 151–169.
Taylor, Courtney. (2020, February 11). What Level of Alpha Determines Statistical Significance?
Retrieved from https://www.thoughtco.com/what-level-of-alpha-determines-significance-
3126422
Usiskin, Z. (1982). Van Hiele Levels and Achievement in Secondary School Mathematics. Chicago:
University of Chicago, Department of Education.
Journal of Teacher Action Research - Volume 7, Issue 2, Spring 2021, , ISSN # 2332-2233 © JTAR. All RightsTHE JOURNAL OF TEACHER ACTION RESEARCH 39
van Hiele, P. M. (2004). The child's thought and geometry. In T. P. Carpenter, J. A. Dossey, & J. L. Koehler
(Eds.), Classics in mathematics education research (pp. 61–66). Reston, VA: National Council of
Teachers of Mathematics. (Reprinted from "The child's though and geometry," 1959/1985,
English Translation of Selected Writings of Dina van Hiele-Geldof and Pierre M. van Hiele, 243–
252.)
Wang, S., & Kinzel, M. (2014). How do they know it is a parallelogram? Analyzing geometric discourse at
van Hiele level 3. Research in Mathematics Education, 16, 288–305.
Journal of Teacher Action Research - Volume 7, Issue 2, Spring 2021, , ISSN # 2332-2233 © JTAR. All RightsYou can also read