Electric Vehicle Life Cycle Cost Analysis - ROSA P
←
→
Page content transcription
If your browser does not render page correctly, please read the page content below

Electric Vehicle Life Cycle Cost Analysis

                                               Richard Raustad
                                    Electric Vehicle Transportation Center
                                         Florida Solar Energy Center
                                             1679 Clearlake Road
                                            Cocoa, FL 32922-5703
                                            rraustad@fsec.ucf.edu

                                                         Submitted as:
                                     Final Research Project Report
                        EVTC Project 6 – Electric Vehicle Life Cycle Cost Analysis

                                                          Submitted to:
                                                Ms. Denise Dunn
                                Research and Innovative Technology Administration
                                          1200 New Jersey Avenue, SE
                                             Washington, DC 20590
                                           E-mail: denise.dunn@dot.gov
                                          Contract Number: DTRT13-G-UTC51
                                        EVTC Report Number: FSEC-CR-2053-17
                                                         February 2017

The contents of this report reflect the views of the authors, who are responsible for the facts and the accuracy of the information
presented herein. This document is disseminated under the sponsorship of the U.S. Department of Transportation’s University
Transportation Centers Program in the interest of information exchange. The U.S. Government assumes no liability for the
contents or use thereof.

                                                                  1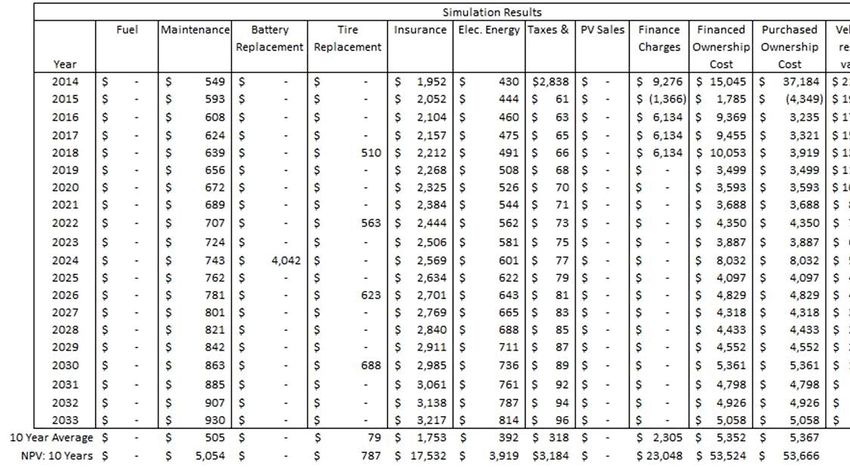
Acknowledgements

This report is a final research report for the Electric Vehicle Life Cycle Cost Analysis project of the
Electric Vehicle Transportation Center (EVTC) at the University of Central Florida (UCF). The Electric
Vehicle Transportation Center is a University Transportation Center funded by the Research and
Innovative Technology Administration of the U.S. Department of Transportation. The EVTC is a
research and education center whose projects prepare the U.S. transportation system for the influx of
electric vehicles into a sustainable transportation network and investigate the opportunity these
vehicles present to enhance electric grid modernization efforts. The EVTC is led by UCF's Florida
Solar Energy Center partners from UCF’s Departments of Electrical Engineering and Computer
Science and Civil, Environmental and Construction Engineering, the University of Hawaii, and
Tuskegee University.

The objective of the Electric Vehicle Life Cycle Cost Analysis project was to compare total life cycle
costs of electric vehicles, plug-in hybrid electric vehicles, hybrid electric vehicles, and compare with
internal combustion engine vehicles. The analysis has considered both capital and operating costs in
order to present an accurate assessment of lifetime ownership costs. The analysis also included
vehicle charging scenarios of photovoltaic (solar electric) powered charging and workplace charging.
The work was conducted by Richard Raustad, Principle Investigator, and Philip Fairey of the Florida
Solar Energy Center.

                                                    2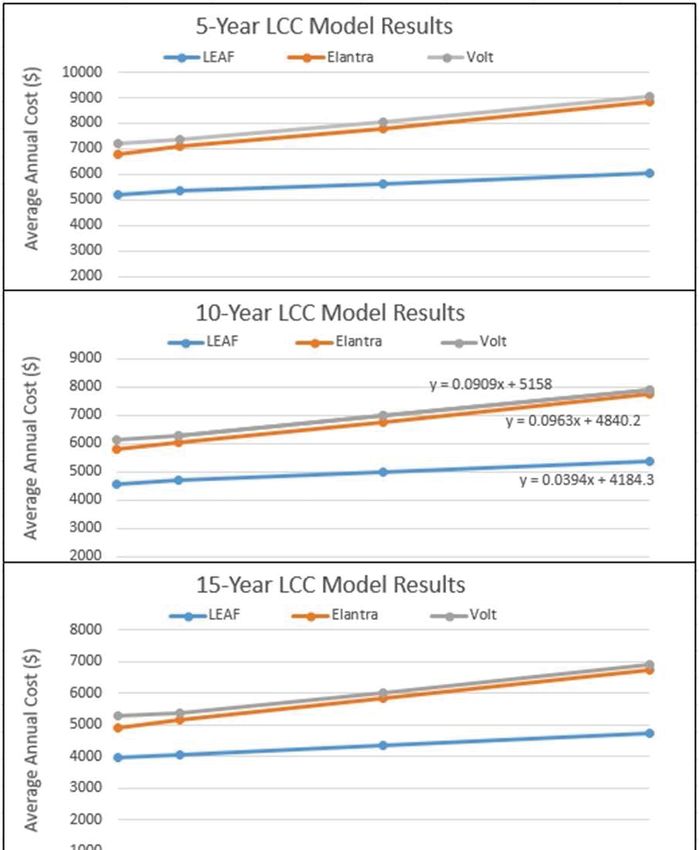
Final Research Project Report

                        Electric Vehicle Life Cycle Cost Analysis
                                             Richard Raustad
                                  Electric Vehicle Transportation Center
                                               January 2017

Abstract
This project compared total life cycle costs of battery electric vehicles (BEV), plug-in hybrid electric vehicles
(PHEV), hybrid electric vehicles (HEV), and vehicles with internal combustion engines (ICE). The analysis
considered capital and operating costs in order to present an equal comparison of differing vehicles. The
analysis also included photovoltaic (PV) and workplace charging options. The overall goal was to define the
total vehicle cost of ownership over 5, 10, 15, and 20 year life expectancies. The developed life cycle cost
computer program will allow any individual to compare life cycle costs of any vehicle.

Research Results
This project had three objectives as follows:
    1. To develop a life cycle cost (LCC) model for automotive vehicles that accurately evaluates electric
       vehicle types,
    2. To allow for any user to download and use the developed LCC model, and
    3. To evaluate photovoltaics (PV) as a power option for electric vehicles.

The details of the developed LCC model and it applications were presented in an EVTC technical report --
Raustad, R., Fairey, P. (2014). “Electric Vehicle Life Cycle Costs Assessment.” Electric Vehicle Transportation
Center, FSEC-CR-1984-14. For completeness of this document the EVTC report is presented in Appendix 1.
The developed LCC model will compare ownership costs, on a present value and an annual cost basis, of plug-
in hybrid electric vehicles (PHEV) and battery electric vehicles (BEV) as compared to conventional internal
combustion engine (ICE) vehicles for an average number of miles driven per year. The analysis used actual
2014 cost values for 16 production vehicles all sold in the United States. The LCC model includes the vehicle
costs of purchase price with federal incentives, if any, salvage value, fuel consumption (electricity and liquid
fuel), tires, insurance, maintenance, state tax and financed interest payments. The vehicles considered are hybrid
electric vehicles, PHEVs, and BEVs as compared to ICEs using gasoline, ethanol, or diesel. It is noted that the
traction battery replacement costs for electric vehicles were difficult to ascertain, but were included in the
analysis by replacing the batteries in the 11th year in order to investigate the battery impact on overall costs.
Economic factors used in the LCC include differing rates for inflation, discount, and fuel escalation and battery
degradation in the electric vehicles to account for battery energy depletion over time. The LCC was performed
over a 5-, 10-, or 15-year lifetime period.
Results were presented for the specific case of 12,330 miles driven per year and for the selected economic
factors. These LCC results show that even with higher first costs, battery powered vehicles are lower in cost to
conventional ICE vehicles. Using the two lowest-cost variant vehicles, a Nissan Leaf and a Hyundai Elantra, the
Leaf's 5-year annual cost including salvage value is $5,360/year compared to the Hyundai at $7,076/year. The

                                                         3
results for the 10-year lifetime show the Leaf at $4,683/year and the Hyundai at $6,040/year. These results are
primarily due to lower fuel cost of electricity versus gasoline, which for the Leaf is $3,919 while the Hyundai
gasoline cost is $10,931 for the 10-year period. A comparison of two other popular plug-in electric vehicles, the
Chevrolet Volt and Toyota Prius, shows higher values for both vehicles; over a period of 10 years, the Volt is
$6,286/year and the Prius is $6,156/year.
The results for the case where the government incentive of $7,500 is deleted also show the LCC values for a
Leaf over a 10-year period is less than the Hyundai when salvage value is considered. The Leaf is $5,369/year
compared to the Hyundai at $6,040/year. For a 5-year period, this result is also true where the Leaf is
$6,733/year and the Hyundai is $7,076/year.
The results for the case where the vehicles are owned for 5 years are shown in the below Figure 1. These results
show the lowest cost option is the Chev Spark followed by the Nissan Leaf.

                                   Figure 1. 5-Year Financed Ownership Cost

Impacts/Benefits
The results provide consumers with the requisite information needed to make an informed financial decision
regarding the purchase of personal transportation using LCC cost comparisons. Although electric vehicle
technology is higher in first cost, the operating and maintenance cost savings provide lower life cycle costs than
conventional vehicles (for those vehicles that are reasonably priced). The analysis also shows that a PV system
of about 4 kW in size would supply the required electrical energy for an EV traveling the yearly miles assumed.

                                                        4
Appendix 1 -- Raustad, R., Fairey, P. (2014). “Electric Vehicle Life Cycle Costs Assessment.” Electric Vehicle
Transportation Center, FSEC-CR-1984-14

                                                      5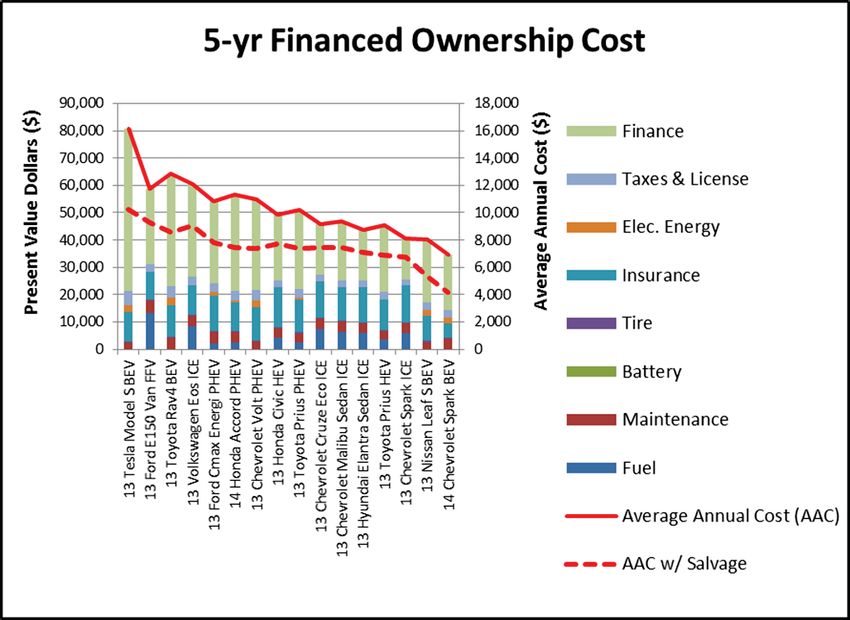
Electric Vehicle Life Cycle Cost
                      Assessment
                                           Richard Raustad
                                              Philip Fairey
                                      Florida Solar Energy Center
                                         1679 Clearlake Road
                                        Cocoa, FL 32922-5703
                                     E-mail: rraustad@fsec.ucf.edu

                                                 Submitted to
                                      Ms. Denise Dunn
                      Research and Innovative Technology Administration
                                1200 New Jersey Avenue, SE
                                   Washington, DC 20590
                                E-mail: denise.dunn@dot.gov

                               Contract Number: DTRT13-G-UTC51
                             EVTC Report Number: FSEC-CR-1984-14
                                         September 2014

The contents of this report reflect the views of the authors, who are responsible for the facts and the accuracy of
the information presented herein. This document is disseminated in the interest of information exchange under
the sponsorship of UCF and the U.S. Department of Transportation’s University Transportation Centers
Program. UCF and the U.S. Government assumes no liability for the contents or use thereof.
Table of Contents
Table of Figures.............................................................................................................................................................ii
Table of Tables ..............................................................................................................................................................ii
I.      Abstract .............................................................................................................................................................1
II.     Introduction.......................................................................................................................................................2
III.    Model Assumptions ..........................................................................................................................................3
    3.1    Vehicle Information .....................................................................................................................................3
    3.2    Daily Mileage...............................................................................................................................................3
    3.3    Calculating Daily Driving Distances............................................................................................................4
    3.4    Calculating Electric, Gas, or Flex Fuel Consumption ..................................................................................5
    3.5    Vehicle Trade-in or Salvage Value ..............................................................................................................7
    3.6    Traction Battery Degradation.......................................................................................................................8
    3.7    Economic Factors.........................................................................................................................................8
    3.8    Other Operating Costs..................................................................................................................................9
IV.     Results.............................................................................................................................................................10
    4.1    Simulation Results for Vehicle Traveling 12,330 Miles/Year ...................................................................13
    4.2    Simulation Results for Vehicle Traveling 10,000, 20,000 and 30,000 Miles.............................................15
    4.3    Impact of Federal Incentives ......................................................................................................................17
    4.4    Simulation Program Input Parameters and Example..................................................................................17
    4.5    Photovoltaics Provide Zero-Energy Transportation...................................................................................17
IV.     Conclusions.....................................................................................................................................................19
V.      Acknowledgments...........................................................................................................................................20
REFERENCES ............................................................................................................................................................21
APPENDIX A – PEVs Qualified for IRS Tax Credit (IRC-30D) ...............................................................................22
APPENDIX B – Calculating Annual Fuel Based Mileage ..........................................................................................23
APPENDIX C – Calculating Electric, Gas, or Flex Fuel Consumption ......................................................................24
APPENDIX D – Edmunds.com True Cost to Own Results ........................................................................................25

                                                                  Table of Figures
Figure 1. Vehicle Depreciation Rate over the First 5 Years of Ownership ...................................................................7
Figure 2. LCC Vehicle Depreciation Assumption .........................................................................................................8
Figure 3. PEV Traction Battery Cost Estimate............................................................................................................10
Figure 4. LCC 5-Year Simulation Results of Annual Costs/Year ...............................................................................14
Figure 5. LCC Analysis for 5-, 10-, and 15-Year Ownership......................................................................................16
Figure 6. PV Array Sizes for PEV Zero-Emission Vehicles .......................................................................................19

                                                                   Table of Tables
Table 1. Vehicle Information for LCC Analysis ...........................................................................................................3
Table 2. Driving Statistics .............................................................................................................................................4
Table 3. PHEV Annual Mileage Calculations ...............................................................................................................5
Table 4. Electric, Gas, or Flex Fuel Consumption Calculations for PHEV Vehicle Example ......................................6
Table 5. Economic Impact Factors ................................................................................................................................9
Table 6. LCC Model Inputs .........................................................................................................................................11
Table 7. Simulation Results for a 2013 Nissan LEAF.................................................................................................12
Table 8. 10-Year LCC Simulation Results in Present Value Dollars ($).....................................................................13
Table 9. Average Annual Cost by Number of Simulation Years.................................................................................15
Table 10. LCC Input Values and Vehicle Example Calculations ...............................................................................18

                                                                                      ii
I.   Abstract
This report has three objectives: to develop a life cycle cost (LCC) model for automotive vehicles that
accurately evaluates electric vehicle types, to allow for any user to download and use the developed
LCC model, and to evaluate photovoltaics (PV) as a power option for electric vehicles. The most
important part of the work is the LCC model that compares ownership costs, on a present value and an
annual cost basis, of plug-in hybrid electric vehicles (PHEV) and battery electric vehicles (BEV) as
compared to conventional internal combustion engine (ICE) vehicles for an average number of miles
driven per year. The analysis uses actual cost values for 16 production vehicles all sold in the United
States. The LCC model includes the vehicle costs of purchase price with federal incentives, if any;
salvage value; fuel consumption (electricity and liquid fuel); tires; insurance; maintenance; state tax;
and financed interest payments. The vehicles considered are hybrid electric vehicles, PHEVs, and
BEVs as compared to ICEs using gasoline, ethanol, or diesel. It is noted that the traction battery
replacement costs for electric vehicles are difficult to ascertain, yet they are included in the analysis by
replacing the batteries in the 11th year in order to investigate the battery impact on overall costs.
Economic factors used in the LCC include differing rates for inflation, discount, and fuel escalation
and battery degradation in the electric vehicles to account for battery energy depletion over time. The
LCC is performed over a 5-, 10-, or 15-year lifetime period.

For the specific case of 12,330 miles driven per year and for the selected economic factors, the LCC
results show that even with higher first costs battery powered vehicles are lower in cost to
conventional ICE vehicles. Using the two lowest-cost variant vehicles, a Nissan Leaf and a Hyundai
Elantra, the Leaf's 5-year annual cost including salvage value is $5,360/year compared to the Hyundai
at $7,076/year. The results for the 10-year lifetime show the Leaf at $4,683/year and the Hyundai at
$6,040/year. These results are primarily due to lower fuel cost of electricity versus gasoline, which for
the Leaf is $3,919 while the Hyundai gasoline cost is $10,931 for the 10-year period. A comparison of
two other popular plug-in electric vehicles, the Chevrolet Volt and Toyota Prius, shows higher values
for both vehicles; over a period of 10 years, the Volt is $6,286/year and the Prius is $6,156/year.

The results for the case where the Leaf government incentive of $7,500 is deleted also show the LCC
values for a 10-year period that the Leaf is less than the Hyundai when salvage value is considered.
The Leaf is $5,369/year compared to the Hyundai at $6,040/year. For a 5-year period, this result is
also true where the Leaf is $6,733/year and the Hyundai is $7,076/year.

The other objective of the work is the LCC simulation program that can be downloaded and used by
any individual with his or her own miles driven and vehicle cost data. The program with the input for
three example vehicles is presented. The third objective is the application of PV power, which was
assessed to determine the size of a PV array located in Florida that would completely supply power for
electrical needs of a vehicle using a traction battery. For a 10-year period, the array size was
determined to be 2.38 kW for the Nissan Leaf.

                                                     1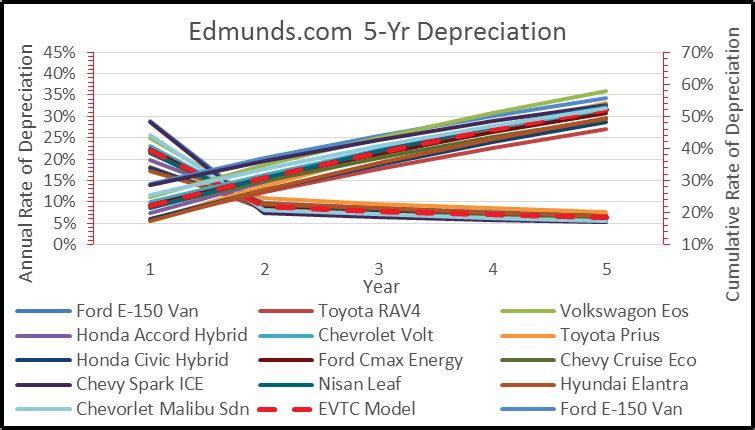
II. Introduction
Electric vehicles (PEV), defined in this report as either plug-in or total battery electric, have gained
widespread attention since the introduction of these vehicles only four years ago. These vehicles were
of course not the first of their kind [1], but given sharp increases in fuel prices PEVs have certainly
captured the attention of the general public. Sales of PEVs have increased dramatically and have
outpaced the rate and number of hybrid vehicle sales over their introductory years. There are currently
thirteen PEV manufacturers producing one or more models. This has expanded consumer choice to the
current 18 PEV options. The purchase price of PEVs is greater than conventional or even hybrid
vehicles due to the traction battery size.

Federal incentives have helped reduce purchase price associated with PEVs. Beginning in 2010, a
federal tax credit [2] of $2,500 to $7,500 became available for purchasers. For vehicles purchased after
December 31, 2009, a tax credit of $2,500 is available for a vehicle that draws energy from a traction
battery of at least 5 kilowatt hours (kWh) capacity with an additional credit of $417 for each kWh of
battery capacity in excess of 5 kWh. The total allowable credit is $7,500 for a vehicle with a battery
size of 16.05 kWh or greater. The credit begins to phase out for a manufacturer when 200,000
qualifying vehicles have been sold for use in the United States. As of this report’s publication date,
there are no published congressional actions to reduce or eliminate the tax credit, and no manufacturer
is approaching the 200,000 cumulative vehicles sales figure. For additional information, see IRS
Notice 2009-89. A list of qualified vehicles is available in Appendix A.

Many vehicle cost models have been used to predict total life cycle costs (LCC) for transportation
vehicles. Two of these models are the U.S. Department of Energy’s (DOE) vehicle cost calculator and
EPRI’s total cost of ownership model [3, 4]. The U.S. Department of Energy’s vehicle cost of
ownership calculator is a web-based tool that compares a wide range of vehicle types. The model
includes cost of fuel; operating and maintenance costs; and insurance, license, and registration fees.
However, the DOE calculator does not include cost of a replacement battery for PEVs because of
uncertainty in expected life and future cost associated with battery replacement.

Alexander and Davis [4] at EPRI reported that for PEVs, driving patterns and commute distance play a
crucial role in deciding if the switch to a PEV makes economic sense. In their analysis, the cost of tire
replacements, insurance, repair costs, and salvage value were not included due to lack of data or
modeling judgment. These are not necessarily bad modeling assumptions given that newer vehicles do
not have a sufficient history to provide reliable cost data for repairs and salvage value.

Although the purchase price of PEVs is perceived to be high compared to conventional counterparts,
the operating and maintenance costs are low compared to even the most economical compact cars.
Given the current markets, state and federal incentives, and lower operating and maintenance costs,
what are the true LCCs of PEVs? This study investigates this question along with other economic
factors that impact the LCCs of vehicle ownership.

                                                    2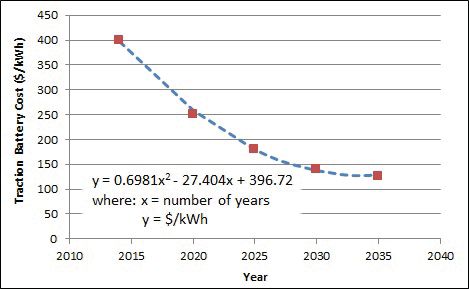
III. Model Assumptions
3.1      Vehicle Information
The vehicles chosen for analysis are conventional internal combustion engine (ICE) or flex fuel (FFV),
plug-in hybrid electric (PHEV), hybrid electric (HEV), and battery electric (BEV) in today’s
marketplace. The model year is selected as 2013; however, for two of the selected vehicles that were
not yet available in 2013, the 2014 year model was used. High-end luxury and low-cost automobiles
are included for comparative purposes. The following vehicle information is used as input to the LCC
model.

Table 1 shows the manufacturer’s suggested retail price (MSRP), as reported by Edmunds.com [5] at
the time the analysis was conducted. These values are used as the vehicle purchase price as well as the
range and fuel efficiencies from Edmunds. Note the traction battery size is also included for PEVs.

                              Table 1. Vehicle Information for LCC Analysis
                                                                      Range        MPGe /     Battery
  Year          Make              Model           MSRP       Type
                                                                    Elec./Ext.      MPG       (kWh)
  2013      Tesla             Model S            $ 69,900     BEV     230 / -       120 / -     60
  2013      Toyota            Rav4               $ 50,660     BEV     107 / -       76 / -     27.4
  2013      Chevrolet         Volt               $ 42,355    PHEV    38 / 380      98 / 37     16.5
  2014      Honda             Accord             $ 40,570    PHEV    13 / 570      115 / 46     4.4
  2013      Volkswagen        Eos                $ 35,840     ICE     - / 350       - / 26       -
  2013      Ford              CMax Energi        $ 35,340    PHEV    19 / 522      88 / 36      7.6
  2013      Toyota            Prius              $ 33,113    PHEV    12 / 540      95 / 50      4.4
  2013      Nissan            Leaf S             $ 31,415     BEV      75 / -       115 / -     24
  2013      Ford              E150 Van           $ 29,150     FFV     - / 495        - / 15      -
  2014      Chevrolet         Spark              $ 28,570     BEV      82 / -       119 / -     21
  2013      Toyota            Prius              $ 25,861    HEV      - / 500        - / 50     1.3
  2013      Honda             Civic              $ 25,150    HEV      - /500        - / 43      1.3
  2013      Chevrolet         Malibu Sedan       $22,960      ICE    - / 482        - / 28       -
  2013      Hyundai           Elantra Sedan      $ 19,685     ICE     - / 300       - / 33       -
  2013      Chevrolet         Cruze Eco          $ 19,440     ICE     - / 300        - / 32      -
  2013      Chevrolet         Spark              $ 15,860     ICE     - / 300       - / 33       -
Note: MPGe, miles per gallon equivalent; MPG, miles per gallon

3.2 Daily Mileage
In order to perform meaningful comparisons and calculations, the number of miles per year that the
vehicle is driven must be specified. For this analysis, two cases were considered:

    1. An average U.S. DOT daily mileage rate was evaluated and then used.
    2. Comparison of vehicles for the cases of driving 10,000, 20,000, and 30,000 miles per year.

                                                          3
Average Daily Mileage for Calculations
Driving statistics chosen for this study were taken as the average number of miles (12,330 miles) from
the alternative fuels data center [6]. These miles are shown in Table 2. The mileage inputs are divided
into local travel and commute travel. Local daily travel of 33.9 miles represents various household
errands. Commute daily travel of 34 miles represents regular travel to and from work and weekday
errands. Travel is further divided into the percentage of city and highway driving. For flex-fueled
vehicles, the volume-based percent flex fuel used is also a model input. Taken together, these daily trip
statistics represent the average driver traveling a total annual mileage of 12,330 miles per year.
The first five rows are model inputs while the last four rows are calculated. An input for the number of
PEV charges per day is included where electric-only driving range would be doubled when charging
twice per day or halved if charging every other day. This study assumed that vehicles would be
charged once per day.
Table 2. Driving Statistics
Driving Statistics
Local Commute
Miles: 33.9 Miles: 34
Days: 118 Days: 245
Percent City: 50.0% Percent City: 75.0%
% Flex: 80.0% % Flex: 10.0%
Charges per Day: Once Charges per Day: Once
City: 2000.0 City: 6247.5
Highway: 2000.0 Highway: 2082.5
Maximum Daily Commute (mi): 34
Annual Driving Distance (mi): 12330
Note: The descriptors in italics are used in subsequent appendices.
3.3 Calculating Daily Driving Distances
For vehicle types other than PHEVs, the daily local or commute driving distances are taken directly
from Table 2. For PHEV cars, the total electric driving range is used to determine fuel use. The
difference between the daily driving distance and the distance traveled on electric energy provides the
daily liquid fuel driving distance. Thus, the PHEV case is shown in Table 3. The impact of battery
degradation is included in this study. Battery degradation will increase the long-term fuel needs by
requiring more liquid fuel.
4Table 3. PHEV Annual Mileage Calculations
Fuel Efficiency Data: Efficiency Mileage Total Miles:
Gas City MPG (MPGc): 42 965
Gas Highway MPG (MPGh): 38 475 1440
Electric City kWh/mi: 0.22 7283
Electric Highway kWh/mi: 0.26 3608 10890
Flex Fuel City MPG (MPGFFc): 14 0
Flex Fuel Highway MPG (MPGFFh): 20 0 0
Total: 12330
Note: The values in Table 3 emulate the Alternative Fuels Data Center Vehicle Cost Calculator fuel
volume calculations. Mathematical calculations for each category’s mileage are shown in Appendix B.
3.4 Calculating Electric, Gas, or Flex Fuel Consumption
The LCC model calculates gas or diesel, flex fuel, and electricity fuel consumption by using the
efficiency values of Table 1 and the mileage of Table 2. The special case of a PHEV requires the use
of the efficiency and mileage values given in Table 3. More-detailed calculations using operating
efficiency are described in Table 6 (Section IV). In order to understand the type of calculations
performed, an example calculation for a PHEV vehicle starting in Year 1 and ending in Year 20 is
presented in Table 4.
Note in Table 4 that the battery range in energy and miles (columns 4 and 5) is shown to decrease with
time due to battery degradation. The calculations of fuel consumption per year are completed for each
vehicle type and in the top left portion show annual city and highway gas, flex, or electric use based on
the vehicle’s fuel type. The LCC model will select the required inputs from Table 2. Using the
previous example for a gasoline-supplemented PHEV assuming an electric driving range of 30 miles,
the annual gas consumption for city driving would be the quotient of 965 miles and 42 mpg city fuel
efficiency yielding a total of 22.97 gallons of fuel per year. Annual highway fuel use is calculated
similarly as 12.5 gallons. As a check, the fuel use associated with local and commute driving is also
calculated to ensure that fuel use totals for each calculation method agree (i.e., city/highway vs.
local/commute). The local and commute calculations are somewhat more involved and are shown in
Appendix C in equation form.
The top center of the table shows the simplified calculations for daily electrical energy use calculated
using the driving statistics shown in Table 2 and the electrical fuel efficiency shown in Table 3 (e.g.,
Local Electric Energy = 33.9 miles * 50% city * 0.22 kWh/mi + 33.9 miles * (1 - 50% city) * 0.26
kWh/mi = 8.14 kWh).
The top right of the table shows simple calculations (e.g. Local Miles * Local Days) for total mileage
verification and efficiency for PHEV and BEV only as total energy used for year 1 divided by total
mileage.
5Table 4. Electric, Gas, or Flex Fuel Consumption Calculations for PHEV Vehicle Examp
6The far right of the Table 4 body shows PHEV gas miles traveled using liquid fuel after depleting
energy stored in the traction battery. Since a battery degradation factor is used to adjust traction battery
range, these mileage calculations are used in the detailed analysis instead of the fuel use calculations at
the top left of the table.
Total annual electric energy use and liquid fuel costs are then calculated. Fuel costs for gasoline,
diesel, and flex fuel are straightforward calculations based on the total volume of fuel consumed and
the price per gallon for the specific fuel type. Daily local and commute energy use are calculated in a
manner similar to liquid fuel where the distance, percent city, and efficiency are used to determine the
amount of energy consumed for both local and commute travel. For BEV, if the trip length exceeds the
traction battery range, a daily energy shortage value is calculated. Daily electrical energy shortage is
calculated only for BEV vehicle types and assumes that the vehicle must charge somewhere along the
travel path to complete the journey.
3.5 Vehicle Trade-in or Salvage Value
The vehicle trade-in or salvage value can be difficult to ascertain given that different vehicle models
depreciate at different rates and future material prices vary. The vehicles studied here were entered in
the Edmonds.com True Cost to Own® model to determine any noticeable trend in trade-in estimates.
Given the vehicles total cash price, as reported on the Edmunds.com website for Orlando, Florida, the
percent annual depreciation was calculated for the first 5 years of vehicle ownership. The largest
difference in depreciation occurs during the first year of ownership where depreciation rates vary from
17% to 29% for the vehicles studied. For years 2 through 4, the depreciation rates are much more
similar. At year 5, the depreciation rates are nearly equal and range between 5% and 8% for all
vehicles. The cumulative depreciation also shows that the out-year depreciation rate is very similar
among different vehicle types as indicated by the nearly parallel lines offset mainly by the first-year
differences. For this study, the average depreciation rate is used and is highlighted in Figure 1.
Appendix D shows an example data set used for all vehicles.
Figure 1. Vehicle Depreciation Rate over the First 5 Years of Ownership
7Using the previously described average depreciation rates, the out-year depreciation rates were
assumed to gradually decrease to a point where 1.5% of the purchase price remained after 20 years of
ownership (e.g., $450 for a $30,000 vehicle purchase price). This gives a potential advantage to
expensive vehicles and a likely disadvantage to low-cost vehicles, given that the end-of-life salvage
value is actually based on scrap material prices at the time of salvage. This advantage or disadvantage
is relatively small compared to the LCCs of transportation vehicles and is not deemed significant in
this analysis. Figure 2 shows the vehicle depreciation curve and corresponding equation used in the
calculations.
Figure 2. LCC Vehicle Depreciation Assumption
3.6 Traction Battery Degradation
For PHEVs and BEVs, the replacement cost of the traction battery can have a significant impact on
LCC. Some analysts have made assumptions that the traction battery may not need replacement during
the useful life of the vehicle [7] while others assume the manufacturer’s warranty sufficiently
characterizes the expected battery lifetime [8]. A review of these and other estimates of battery life
leads to a conclusion that a traction battery is viable for use in electrified vehicles with advanced
battery management systems for a period exceeding 4,400 battery charge/discharge cycles [9]. This
number of charge/discharge cycles would translate to a battery life of 12 years for a vehicle that
required daily charging. For analysis purposes, an 11-year battery life will be used to compare over a
15-year ownership period (in one result, the battery is replaced in the 11th year).
3.7 Economic Factors
The LLC economic factors used include the general inflation rate, the fuel escalation rates, the
monetary discount rate, and a purchase price interest rate covering the car loan. The economic factors
and their selected values are shown in Table 5. These factors are well described in literature.
8Table 5. Economic Impact Factors
General Inflation Rate 2.53 %
Discount Rate 4.53 %
Vehicle Purchase Rate 4.04 %
Fuel Escalation Rates:
Gasoline 1.7 %
Ethanol 1.7 %
Electricity 3.42 %
3.8 Other Operating Costs
The cost of maintenance and insurance are difficult to quantify for various reasons. Some vehicle
owners may perform regular maintenance on their own vehicles while other owners rely on local
repair shops or dealerships for regular or selective maintenance. The cost of insurance is also highly
volatile and depends both on the owner’s driving record, the number of vehicles insured, the owner’s
accident rate, and the type of vehicle and its first cost. For this study, the data provided by the
Edmunds.com website for the city of Orlando, Florida is used for these cost estimates.
Costs associated with tire replacement are included at the time the tires are actually replaced as
opposed to including an annual cost of tire per mile of operation as is done in some analyses.
Maintenance costs are annualized per year in order to simplify the model. Edmunds does provide
varying maintenance costs over a 5-year period; however, these costs are unknown as vehicle age
progresses. For this reason, the maintenance costs were reduced by the cost of tires and then averaged
over a 5-year period to yield an annual maintenance cost estimate. This value was used in this study
for each year.
Battery costs are still the most difficult to accurately determine given low number of years of data.
Future costs depend on breakthrough technology and investment in manufacturing. With advances in
battery technology and manufacturing, costs will ultimately decline. But when and by how much? For
this analysis, it was assumed that current costs are $400/kWh and would decline to $128/kWh in 20
years. This is a very conservative estimate given the DOE EV Everywhere Grand Challenge [10] goals
for battery technology of reducing costs to $125/kWh by 2022. Regardless of the initial battery cost
selected for this study, the estimated battery cost after 11 years used in this study is $180/kWh and is
well above the DOE cost target. Figure 3 provides the equation used to estimate the battery cost. Note
that the PEV batteries are replaced in the 11th year.
9Figure 3. PEV Traction Battery Cost Estimate
It is noted that the cost value associated with the core of the traction battery is not included when the
traction battery is replaced at the end of the useful automotive life. The secondary useful life of a
traction battery could potentially lower the LCC associated with PEVs; however, this area of usage is
in its infancy and little is known about specific usages and related cost values.
The impact of increased fuel costs due to battery degradation for HEV models is not included in this
study since changes in long-term fuel efficiency (i.e., city and highway MPG) over the anticipated
battery life are not available.
Florida Metro Area fuel prices for Orlando, Florida were used as of September 30, 2014. This data
shows regular, premium, and diesel fuel prices as $3.206, $3.648, and $3.686, respectively [11]. A
Florida state average residential electric price of ¢11.42 per kWh is used for both local and commute
travel.
IV. Results
Table 6 presents all vehicle parameters associated with each individual vehicle over the selected
simulation period chosen for analysis. The LCC tool uses a template to perform all necessary
calculations. This template and the information previously described are copied to a specific vehicle
model worksheet where calculations are specific to each vehicle. The simulation results are then
copied to a results worksheet where data can be compared across models. Section 4.4 of this report
presents a complete list of all parameters and three example calculations.
The results are presented in two sections as follows:
1. Simulation results for vehicles traveling 12,330 miles/year.
2. Simulation results for vehicles traveling 10,000, 15,000, and 20,000 miles/year.
All simulation results use the same vehicle and economic parameters.
10Table 6. LCC Model Inputs
City Hwy Flex
City Hwy
Battery Battery Tire M M Fuel
Year Make Model Type Main. Tires Fuel kWh/ kWh/
Cost Life* Mileage P P City
mi mi
G G MPG
2013 Tesla Model S BEV $24,000 12 $490 $450 50,000 0.36 0.35
2013 Ford E150 Van FFV $999 $450 50,000 13 17 Regular 9
2013 Toyota Rav4 BEV $10,960 12 $866 $450 50,000 0.43 0.46
2013 Volkswagen Eos ICE $803 $450 50,000 22 30 Diesel
2013 Ford CMax Energi PHEV $3,040 12 $849 $450 50,000 40 36 Regular 0.36 0.4
2014 Honda Accord PHEV $1,760 11 $834 $450 50,000 47 46 Regular 0.29 0.29
2013 Chevrolet Volt PHEV $6,600 12 $608 $450 50,000 35 40 Premium 0.36 0.37
2013 Honda Civic HEV $520 12 $777 $450 50,000 44 44 Regular
2013 Toyota Prius PHEV $1,760 12 $714 $450 50,000 51 49 Regular 0.35 0.35
2013 Chevrolet Cruze Eco ICE $849 $450 50,000 22 34 Regular
2013 Chevrolet Malibu ICE $770 $450 50,000 25 36 Regular
2013 Hyundai Elantra Sdn ICE $643 $450 50,000 28 38 Regular
2013 Toyota Prius HEV $520 12 $761 $450 50,000 51 48 Regular
2013 Chevrolet Spark ICE $549 $450 50,000 28 37 Regular
2013 Nissan Leaf S BEV $9,600 12 $823 $450 50,000 0.27 0.33
2014 Chevrolet Spark BEV $8,400 11 $490 $450 50,000 0.26 0.31
th
* - Battery life number of years in this table is set to provide battery replacement in the 11 year of simulation.
11Table 7. Simulation Results for a 2013 Nissan LEAF
Note: This analysis assumes 2.53% inflation rate, 4.53% discount rate, 4.04% vehicle finance rate, 3.42% electricity escalation rate
escalation rate.
124.1 Simulation Results for Vehicle Traveling 12,330 Miles/Year
An LCC analysis was performed on the 16 selected vehicles to determine the total vehicle ownership
costs over 5-, 10-, and 15-year periods. Table 7 shows an example of the detailed LLC simulated
results for a 2013 Nissan Leaf. The federal incentive is included in year 2 (2015) of the finance
charges and purchased ownership cost columns. For a 10-year simulation, average and present values
are shown at the bottom of the table, and the results only use the first 10 rows of data. Note that the
battery replacement is at year 11.
Table 8 shows the results for all vehicles when costs described in the previous section and federal
incentives are included in the analysis. The selected vehicles are listed in order of total annual costs
from highest to lowest over the 10-year period.
Table 8. 10-Year LCC Simulation Results in Present Value Dollars ($)
Electrical Taxes & Annual
Description Fuel Maintenance Tires Insurance
Energy License Cost
13 Tesla Model S BEV 0 4533 787 20638 4823 5393 9586
13 Ford E150 Van FFV 24685 9000 787 18861 0 3054 8414
13 Toyota Rav4 BEV 0 7833 787 21849 5948 4289 8208
13 Volkswagen Eos ICE 15974 7278 787 20122 0 3438 8172
13 Ford Cmax Energi PHEV 4313 7689 787 24929 2535 3409 7364
14 Honda Accord PHEV 4658 7556 767 19942 1375 3698 7331
13 Chevrolet Volt PHEV 228 5571 787 23234 4799 3812 7189
13 Honda Civic HEV 7620 7053 787 27780 0 2824 7001
13 Toyota Prius PHEV 4543 6500 787 22772 1501 3281 6863
13 Chevrolet Cruze Eco ICE 13459 7682 787 25429 0 2497 6836
13 Chevrolet Malibu Sdn ICE 12054 6994 787 23137 0 2699 6753
13 Hyundai Elantra Sdn ICE 10931 6723 787 24899 0 2511 6459
13 Toyota Prius HEV 6710 5878 787 21462 0 2865 6233
13 Chevrolet Spark ICE 11010 6909 787 26009 0 2291 6211
13 Nissan Leaf S BEV 0 5054 787 17532 3919 3184 5352
14 Chevrolet Spark BEV 0 7459 767 10031 3739 3009 4534
Note: Annual cost does not include salvage value at the end of the 10-year period
As expected, the high-cost vehicles with greater purchase price show greater LCCs than lower-
purchased-price vehicles. It is also clear from the results that BEV vehicles are cost competitive with
their ICE counterparts. In fact, two of the more popular BEV’s show smaller LCCs than low-cost ICE
conventional models. PHEV are also shown to be competitively priced compared to other ICE
conventional vehicles. These results are similar to results shown by Alexander and Davis in an EPRI
study [4] and are characteristic of the difference in operating fuel cost – a nominal 3:1 difference
between ICE and BEV vehicles at today’s fuel prices. The Nissan LEAF and Chevrolet Spark annual
costs are $5,352 and $4,534, respectively (per 10-year period) while the conventional vehicles show
13annual costs of around $6,600. To present a graphical representation of the LCC costs and results,
Figure 4 shows all of the vehicles studied.
Figure 4 shows the present values and annual costs for a 5-year ownership example. These results
show the relative amounts of the various vehicle costs and show that the two least-cost vehicles are the
Chevrolet Spark BEV and Nissan Leaf BEV. The Chevrolet Spark ICE is the third least-cost vehicle.
Average annual costs are shown with and without salvage value at the end of year 5. Note here that the
vehicles are ordered in the same manner as shown in Table 8, and the vehicles are no longer ordered
from highest to lowest due to the change in simulation period and economics.
Figure 4. LCC 5-Year Simulation Results of Annual Costs/Year
The next set of results is presented in Table 9 where the annual costs are shown for a Leaf, Elantra,
and Volt and for the cases where the ownership of the vehicle is held for 5, 10, or 15 years. Salvage
values are included in these results.
14Table 9. Average Annual Cost by Number of Simulation Years
Ownership Average Annual Cost ($)
Years LEAF Elantra Volt
5 5,360 7,076 7,388
10 4,683 6,040 6,286
15 4,369 5,444 5,691
From the results shown in Table 9, again the Leaf EV is the least annual cost. The 15-year results also
show the effect of battery replacement for both the Leaf and Volt. This result shows the relative
difference where the Elantra is not affected due to battery replacement. Note that the results shown in
Table 9 are valid when comparing a vehicle for a period of time, say five years, but not for comparing
the same vehicle for 5 years or for 15 years since vehicle replacement may be required in the analysis.
4.2 Simulation Results for Vehicle Traveling 10,000, 20,000 and 30,000 Miles
One of the other factors evaluated by the LCC simulations was the effect of different miles per year
traveled by the individual vehicle. For this case, runs of 10,000, 20,000, and 30,000 miles per year
driven were made for the three vehicles – Leaf, Elantra, and Volt. These results are plotted in Figure 5,
which shows average annual costs versus miles per year. The case for 12,330 miles is also noted in
Figure 5.
From Figure 5, it can be observed that the curves are linear, except at the 10,000 to 12,000 mile range
for the Nissan Leaf and Chevrolet Volt for the 10- and 15-year simulations. The nearly horizontal
curve in this range is because the Leaf and Volt are entirely battery powered at this mileage range.
Since the lines are linear, the effect of miles per year driven does not change the relative positions of
the three vehicles. The annual costs are higher at higher mileage, which is as expected.
The equations are shown for the 10-year simulation to highlight the difference in efficiency between
the all-electric Leaf, the PHEV Volt, and the Elantra ICE vehicles. The Leaf is more than twice as
efficient as the other vehicles, given the assumptions used in this analysis.
15Figure 5. LCC Analysis for 5-, 10-, and 15-Year Ownership
164.3 Impact of Federal Incentives
Federal incentives are a mechanism to promote new technology into the mainstream. The incentives
are primarily used to equalize costs within specific markets. However, they are also used to accelerate
adoption and promote new technology. Calculations were made for the Leaf and Volt without federal
incentives, and these calculations showed that the Leaf is still the least-cost vehicle compared to the
Volt and Elantra at 5-, 10-, and 15-year ownerships. This result was similar to results shown in Figure
5.
4.4 Simulation Program Input Parameters and Example
This section of the report presents the LCC program input values and an example set of input values
for three vehicles: the Nissan Leaf, the Hyundai Elantra, and the Chevrolet Volt. Table 10 presents
these results – a list of all the program input parameters is in the left column and the values used are
shown for each vehicle.
In Table 10, there are thirty values required to describe the vehicle and the economics. The output
calculated values are shown in the last ten rows of the table.
4.5 Photovoltaics Provide Zero-Energy Transportation
One of the interesting issues concerning PEVs is the fact that the power need for an individual’s car
can be generated by photovoltaics (PV) (i.e., a PV system can completely eliminate the electric energy
required to operate a PEV). If this PV system were grid-tied, the added flexibility allows the PV
system to operate independently of when and where the vehicle is parked. The PV power required to
offset PEV electrical energy use varies based on the efficiency of the EV motive system and the
expected daily commute. For the vehicles studied in this report, a PV system of 0.88 to 3.6 kW would
supply the needed electrical power if located in Florida, as shown in Figure 6. If this system was
installed at a cost of $2,800/kW and assuming ¢11.42 per kWh, the PV would pay for itself in 16.4
years. PV electrical output degradation of 2%/year is included. Given that gasoline costs are nominally
three times greater than electricity at today’s prices, the payback for offsetting liquid fuel could be
considered less than 6 years. Additionally, the PV system would eliminate all emissions resulting from
the electrical motive energy. For BEV, and neglecting emissions from PV manufacturing, the vehicle
would truly be a zero-emission vehicle.
17Table 10. LCC Input Values and Vehicle Example Calculations
Vehicle:
Year 2013 2013 2013
Make Nissan Hyundai Chevrolet
Model LEAF Elantra Volt
Type BEV ICE PHEV
MSRP ($) 31,415 19,685 42,355
Range (miles) 75 -- 38
Battery Size (kWh) 24 -- 16.5
Battery Life (years) 12 -- 12
Operating Cost:
Regular Gasoline Cost ($/gal.) 3.206
Premium Gasoline Cost ($/gal.) 3.648
Electricity Cost ($/kWh) 0.1142
Tire Cost ($) 450 450 450
Tire Mileage (miles) 50,000 50,000 50,000
Maintenance ($) 549 739 608
Insurance ($) 1,952 2,772 2,587
Federal Incentive ($) 7,500 -- 7,500
Operating Efficiency:
City MPG -- 28 35
Highway MPG -- 38 40
City kWh/mile 0.27 -- 0.36
Highway kWh/mile 0.33 -- 0.37
Driving Statistics:
Local Miles: 33.9
Local City Miles (%) 50
Local Driving Days 118
Commute Miles 34
Commute City Miles (%) 75
Commute Driving Days 245
Economics:
Inflation Rate (%) 2.53
Discount Rate (%) 4.53
Finance Rate (%) 3.25
Electric Escalation Rate (%) 3.42
Ethanol Escalation Rate (%) 1.7
Gasoline Escalation Rate (%) 1.7
Number of Years 5
Calculation Output:
Finance Cost ($) 23,048 18,743 33,464
Fuel Consumption ($) 0 5,840 0
Electric Consumption ($) 2,012 0 2,522
Maintenance Cost ($) 2,636 3,511 2,906
Tire Cost ($) 409 409 409
Insurance Cost ($) 9,167 13,018 12,148
Taxes & License ($) 2,934 2,260 3,562
Present Value w/o Salvage ($) 40,204 43,781 55,011
Present Value w/ Salvage ($) 26,800 35,380 36,940
Annual Operating Cost ($) 5,360 7,076 7,388
18Figure 6. PV Array Sizes for PEV Zero-Emission Vehicles
IV. Conclusions
The major objective of this work was to develop an LCC model for automotive vehicles that
accurately evaluates PEVs. The developed LCC model was used to compare ownership costs, on an
annual basis, of PHEVs and BEVs to conventional ICE vehicles for an average number of miles driven
per year. The analysis uses actual cost values for 16 production vehicles all sold in the United States.
The LCC model includes the vehicle costs of purchase price with federal incentives, if any; salvage
value; fuel consumption (electricity and liquid fuel); tires; insurance, maintenance; state tax; and
financed interest payments. The vehicles considered are hybrid, plug-in hybrid and battery-electric
vehicles, as compared to ICEs using gasoline, ethanol, or diesel. It is noted that the traction battery
replacement costs for PEVs are difficult to ascertain, yet they are included in the analysis by replacing
the batteries in the 11th year to investigate the battery impact on overall costs. Economic factors used
in the LCC include differing rates for inflation, discount, and fuel escalation and battery degradation in
the PEVs to account for battery energy depletion over time. The LCC is performed over a 5-, 10-, or
15-year lifetime period.
For the specific case of 12,330 miles driven per year and for the selected economic factors, the LCC
results show for all three lifetime cases that reasonably-priced, battery-powered vehicles are lower in
annual cost than conventional ICE vehicles. The analysis was performed using the two lowest cost
19vehicles, a Nissan Leaf and a Hyundai Elantra. Comparing the other two most popular PEVs, the
Chevrolet Volt and Toyota Prius, the results for both of these are higher annual costs than the Elantra.
The other result evaluated by the LCC simulations was the effect of different miles per year traveled
by the individual vehicle. For this case, runs of 10,000, 20,000, and 30,000 miles per year driven were
made for three vehicles – Leaf, Elantra, and Volt. These results showed that the effect of varying miles
does not change the relative annual cost positions of the three vehicles. The annual costs are higher at
higher mileage, which is as expected.
Calculations of annual cost were also made for the Leaf and Volt without federal incentives. These
results showed that the Leaf is still least cost compared to the Elantra at 5-, 10-, and 15-year
ownerships. The Volt is shown to have higher annual costs than either of these vehicles.
The other results presented were the inclusion of the LCC simulation program that can be downloaded
and used by any individual with his or her own vehicle selection, miles driven and the application of
PV power to determine the size of a PV array located in Florida that would completely power the
electrical needs of a vehicle using a traction battery. The array size was determined to be 2.38 kW for
the Nissan Leaf.
V. Acknowledgments
This report was funded through a grant from the U.S. Department of Transportation’s University
Transportation Centers Program under the Research and Innovative Technology Administration.
Special thanks to the editorial review by Dr. David Block and Danielle R. Daniel.
20REFERENCES
1. History of the Electric Vehicle. (2014). Wikipedia, the Free Encyclopedia. Retrieved from
http://en.wikipedia.org/wiki/History_of_the_electric_vehicle
2. Internal Revenue Service. (2014). Plug-In Electric Drive Vehicle Credit (IRC 30D). Retrieved
from http://www.irs.gov/Businesses/Plug-In-Electric-Vehicle-Credit-(IRC-30-and-IRC-30D)
3. Alternative Fuels Data Center, U.S. Department of Energy. (2013a). Vehicle Cost Calculator.
Retrieved from http://www.afdc.energy.gov/calc/
4. Alexander, M. & Davis, M. (2013). Total Cost of Ownership Model for Current Plug-in
Electric Vehicles. Electric Power Research Institute. Palo Alto, CA. Retrieved from
http://www.epri.com/abstracts/Pages/ProductAbstract.aspx?ProductId=000000003002001728
5. Edmunds Price Promise®. (2014). Retrieved from http://www.edmunds.com/price-
promise.html
6. Alternative Fuels Data Center, U.S. Department of Energy. (2013b). Vehicle Cost Calculator
Assumptions and Methodology. Retrieved from
http://www.afdc.energy.gov/calc/cost_calculator_methodology.html
7. Graham, R. (2001). Comparing the Benefits and Impacts of Hybrid Electric Vehicle Options. Electric
Power Research Institute, Palo Alto, CA. Retrieved from
http://www.epri.com/abstracts/Pages/ProductAbstract.aspx?ProductId=000000000001000349
8. Kromer, M., & Heywood, J. (2007). Electric Powertrains: Opportunities and Challenges in the U.S. Light-
Duty Vehicle Fleet. Sloan Automotive Laboratory, Laboratory for Energy and the Environment.
Cambridge, MA. Retrieved from http://mitei.mit.edu/system/files/2007-03-rp.pdf
9. Wood, E., Alexander, M., & Bradley T. H. (2011). Investigation of battery end-of-life conditions
for plug-in hybrid electric vehicles. Journal of Power Sources, 196(11), 5147-5145. Retrieved
from http://www.sciencedirect.com/science/article/pii/S037877531100379X
10. Energy.gov, Office of Energy Efficiency and Renewable Energy. (n.d). Vehicle Technologies
Office: Batteries. Retrieved from http://energy.gov/eere/vehicles/vehicle-technologies-office-
batteries
11. AAA Daily Fuel Gauge Report. (2014). Florida Metro Areas Fuel Prices. Retrieved from
http://fuelgaugereport.aaa.com/states/florida/florida-metro/
21APPENDIX A – PEVs Qualified for IRS Tax Credit (IRC-30D)
Battery Model Credit
Manufacturer Qualified Vehicle
Capacity Year Amount
American Honda Motor Co. Accord Plug-In Hybrid 6.7 2014 $3,626
AMP Electric Vehicles, Inc. AMP GCE Electric Vehicle 2012 $7,500
AMP Electric Vehicles, Inc. AMP MLE Electric Vehicle 2012 $6,500
Azure Dynamics, Inc. Azure Dynamics Transit Connect EV 2011/2012 $7,500
BMW of North America BMW i3 Sedan with Ranger Extender 22 2014 $7,500
BMW of North America BMW i3 Sedan 22 2014 $7,500
BMW of North America BMW i8 7.1 2014 $3,793
Boulder Electric Vehicles, Inc. Boulder Electric Delivery Van DV-500 2013 $7,500
Boulder Electric Vehicles, Inc. Boulder Electric Shuttle DV500 2013 $7,500
Boulder Electric Vehicles, Inc. Boulder Electric Flat Bed DV-500 2013 $7,500
Boulder Electric Vehicles, Inc. Boulder Electric Service Body DV-500 2013 $7,500
BYD Motors, Inc. BYD e6 Electric Vehicle 2012-2014 $7,500
Chrysler Group LLC Fiat 500e 24 2013-2014 $7,500
CODA Automotive CODA Sedan EV 2010/2012 $7,500
Electric Vehicles International EVI-MD (Medium Duty) Electric truck 2011/2012 $7,500
Electric Vehicles International EVI-WI (Walk-In) Electric truck 2011/2012 $7,500
Electric Mobil Cars EMC Model E36 7 Passenger 2010 $7,500
Wagon EV
Electric Mobil Cars EMC Model E36t Pick-up Truck EV 2010 $7,500
Electric Mobil Cars EMC Model E36v Utility Van EV 2010 $7,500
Fisker Automotive, Inc. Fisker Karma Sedan 2012 $7,500
Ford Motor Company Ford Focus Electric 23 2012-2014 $7,500
Ford Motor Company Ford C-MAX Energi 7.6 2013-2014 $4,007
Ford Motor Company Ford Fusion Energi 7.6 2013-2014 $4,007
General Motors Corporation Cadillac ELR 16.5 2014 $7,500
General Motors Corporation Chevrolet Volt 16.5 2011-2014 $7,500
General Motors Corporation Chevrolet Spark EV 21 2014 $7,500
Mercedes-Benz Mercedes-Benz Coupe/Cabrio EV 28 2013 $7,500
Mitsubishi Motors North America, Inc. Mitsubishi i-MiEV 16 2012/2014 $7,500
Nissan North America Nissan Leaf 24 2011-2014 $7,500
Porsche Cars North America, Inc. Porsche 918 Spyder 2015 $3,667
Porsche Cars North America, Inc. Porsche Panamera S E Hybrid 9.4 2014 $4,751.8
Smart USA Distributor, LLC smart fortwo 17.6 2011 $7,500
Tesla Motors Inc. Tesla Roadster 60/85 2008-2011 $7,500
Tesla Motors Inc. Tesla Model S 60/85 2012-2014 $7,500
Think NA Think City EV 2011 $7,500
Toyota Motor Sales, S.S.A., Inc. Toyota Prius PHEV 4.4 2012-2014 $2,500
Toyota Motor Sales, S.S.A., Inc. Toyota RAV4 EV 41.8 2012-2014 $7,500
VIA Motors, Inc. VIA 2500 ER Electric Passenger Van 2014 $7,500
VIA Motors, Inc. VIA 1500 ER Electric Truck 4WD 2014 $7,500
VIA Motors, Inc. VIA 2500 ER Electric Cargo Van 2014 $7,500
VIA Motors, Inc. VIA 1500 ER Electric Truck 2WD 2014 $7,500
Wheego Electric Cars, Inc. Wheego LiFe EV 2011 $7,500
Zenith Motors Zenith Electric Van 2014 $7,500
22APPENDIX B – Calculating Annual Fuel Based Mileage
The following equations are used to calculate the mileage shown in Table 3. The italicized variables
are found in Table 3 or are a result of the PHEV calculations when daily local or commute travel
exceeds the battery range, and the DailyLocalMilesGas or DailyCommuteMilesGas represents the gas
miles traveled without regards to battery degradation. See example Table 4 for PHEV Gas Miles
Traveled for year 1 (e.g., 3.9 and 4 local and commute gas miles traveled, respectively).
Gas City Mileage:
GasCityMiles = 0 BEV
GasCityMiles = Local City + Commute City ICE, HEV
GasCityMiles = MPGc (Local City + Commute City) (1-Local % Flex Driving) FFV
((1- Local % Flex) (MPGc) + (Local % Flex) (MPGFFc))
GasCityMiles = DailyLocalMilesGas (Local Days) (Local Percent City) + PHEV
DailyCommuteMilesGas (Commute Days) (Commute Percent City)
Gas Highway Mileage:
GasHighwayMiles = 0 BEV
GasHighwayMiles = Local Highway +Commute Highway ICE, HEV
GasHighwayMiles = MPGh (Local Highway + Commute Highway) FFV
MPGh + MPGFFh
GasHighwayMiles = DailyLocalMilesGas (Local Days) (1-Local Percent City) + PHEV
DailyCommuteMilesGas (Commute Days) (1-Commute Percent City)
Electric City Mileage:
ElectricCityMiles = Local City +Commute City BEV
ElectricCityMiles = 0 ICE, HEV, FFV
ElectricCityMiles = DailyLocalMilesElectric (Local Days) (Local Percent City) + PHEV
DailyCommuteMilesElectric (Commute Days) (Commute Percent City)
Electric Highway Mileage:
ElectricHighwayMiles = Local Highway +Commute Highway BEV
ElectricHighwayMiles = 0 ICE, HEV, FFV
ElectricHighwayMiles = DailyLocalMilesElectric (Local Days) (1-Local Percent City) + PHEV
DailyCommuteMilesElectric (Commute Days) (1-Commute Percent City)
Flex City Mileage:
FlexCityMiles = 0 BEV, ICE, HEV, PHEV
FlexCityMiles = MPGFFc (Local City + Commute City) (Local % Flex) FFV
((1- Local % Flex) (MPGc) + (Local % Flex) (MPGFFc))
Flex Highway Mileage:
FlexHighwayMiles = 0 BEV, ICE, HEV, PHEV
FlexHighwayMiles= (MPGFFh (Local Highway + Commute Highway) (Commute % Flex)) FFV
((1- Commute % Flex) (MPGh) + (Commute % Flex) (MPGFFh))
23You can also read