Electric Vehicle Uptake: Understanding the Print Media's Role in Changing Attitudes and Perceptions

Page created by Larry Craig
 
CONTINUE READING
Electric Vehicle Uptake: Understanding the Print Media's Role in Changing Attitudes and Perceptions
Article
Electric Vehicle Uptake: Understanding the Print Media’s Role
in Changing Attitudes and Perceptions
Gail Helen Broadbent 1, *, Thomas Oliver Wiedmann 2                          and Graciela Isabel Metternicht 1

                                           1   Earth and Sustainability Science Research Centre, UNSW, Sydney, NSW 2052, Australia;
                                               g.metternicht@unsw.edu.au
                                           2   Sustainability Assessment Program, School of Civil and Environmental Engineering, UNSW,
                                               Sydney, NSW 2052, Australia; t.wiedmann@unsw.edu.au
                                           *   Correspondence: g.broadbent@unsw.edu.au

                                           Abstract: Passenger motor vehicle transport is a significant and growing emissions source contribut-
                                           ing to climate change. Switching from internal combustion engines to electric vehicles (EV) would
                                           significantly reduce most countries’ emissions, but for many consumers perceived barriers deter EV
                                           adoption. Consequently, government policies designed to incentivise a transition to EVs could benefit
                                           from consideration of the utility of communication channels such as print media for influencing
                                           consumer behaviour. This research explores the role that media and other communication channels
                                           writing about EVs play in consumer perceptions and awareness of government-initiated programs
                                           and policies to incentivise EV market transition. Using mixed methods of a media review and New
                                           Zealand car buyer surveys (questionnaires, interviews) (n = 893), we identified car buyers’ media use
                                 to update knowledge about cars, perceptions about EVs, and likelihood to buy, and tested awareness
                                    and popularity of incentives. We derive recommendations for policy improvements to accelerate EV
Citation: Broadbent, G.H.;                 uptake, including a significant role for the print media to disseminate relevant information, increase
Wiedmann, T.O.; Metternicht, G.I.          awareness of policies, and shift perceptions about EVs. We argue that social marketing programs
Electric Vehicle Uptake:                   should be enhanced to overcome lack of knowledge and misinformation, focusing on the market
Understanding the Print Media’s Role       segment next most likely to buy EVs.
in Changing Attitudes and
Perceptions. World Electr. Veh. J. 2021,   Keywords: electric vehicle; social marketing; diffusion of innovation; media; consumer choice;
12, 174. https://doi.org/10.3390/
                                           consumer attitudes; transportation; public policy
wevj12040174

Academic Editor: Joeri Van Mierlo

                                           1. Introduction
Received: 13 August 2021
Accepted: 22 September 2021                      Global transport emissions are approximately 23% and growing [1]. To rapidly tran-
Published: 30 September 2021               sition away from fossil-fuelled transport by 2050 requires 97% decarbonisation of the car
                                           fleet, assuming a business-as-usual growth in transport activity, and a substantial decrease
Publisher’s Note: MDPI stays neutral       in electricity emissions [2]. Any Internal Combustion Engine Vehicle (ICEV) sold continues
with regard to jurisdictional claims in    to emit the same level of CO2 per kilometre for its lifetime, whereas electric vehicle (EV)
published maps and institutional affil-    emissions decrease in tandem with electricity supply improvements [3]. Therefore, many
iations.                                   governments have aspirational goals to ban future sales of new fossil-fuelled cars [4], with
                                           many implementing policies designed to encourage electric vehicle (EV) adoption, with
                                           varying degrees of success [5].
                                                 To appeal to consumers more widely than EV early adopters, who are prepared
Copyright: © 2021 by the authors.          to act on climate change, the value proposition for a disruptive innovative technology,
Licensee MDPI, Basel, Switzerland.         which requires behaviour change, needs ongoing improvement using a whole product
This article is an open access article     approach [6]. The value proposition includes that EVs are affordable, and are perceived as
distributed under the terms and            such [7], rather than representing an unaffordable wish alien to many buyers’ economic
conditions of the Creative Commons         reality. Using a social simulation model, it was found that to effectively transition to EVs,
Attribution (CC BY) license (https://      policy measures ought to be enduring and encompass three facets: monetary, structural,
creativecommons.org/licenses/by/           and informational [8].
4.0/).

World Electr. Veh. J. 2021, 12, 174. https://doi.org/10.3390/wevj12040174                                     https://www.mdpi.com/journal/wevj
Electric Vehicle Uptake: Understanding the Print Media's Role in Changing Attitudes and Perceptions
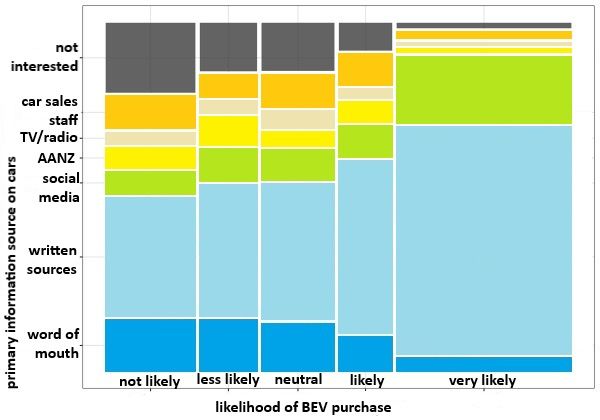
World Electr. Veh. J. 2021, 12, 174                                                                                           2 of 27

                                            This paper seeks to explore the links between policies, information, and communi-
                                      cations to improve the implementation of government policies and awareness of them,
                                      leading to increased EV adoption (see Section 3). In free market economies consumers
                                      have unrestricted choice on which vehicles they buy in the available pool, and inadequate
                                      consumer knowledge about EVs may be a key barrier to adoption, retarding transition to a
                                      more sustainable future [9,10]. Insufficient or incorrect information results in information
                                      asymmetry that can be considered as market failures, leading to negative externalities
                                      affecting the whole society and not just individual consumers [11]. Importantly, the Infor-
                                      mation Integration Theory [12] was used in experimental work on car buying by Mairesse
                                      et al. (2012, p. 549) [13] who indicated ‘thought and action are determined by the joint
                                      effect of multiple determinants’ and they proposed that consumers’ car purchase decisions
                                      resulted from the averaging of various attributes, which were of differing importance
                                      to them. Additionally, Krause et al. (2013, p. 439) [14] found that ‘most consumers are
                                      either uninformed or misinformed’ about EVs. Lack of knowledge and misperceptions
                                      potentially contribute to a rejection of alternative fuel vehicles [15].
                                            Additional to a lack of accurate knowledge, consumers’ perceptions may be more
                                      important than positive vehicle attributes [16]. Furthermore, disrupting the established
                                      motor vehicle regime would be difficult, as there is a web of limitations, and recorded
                                      successes have been largely underpinned by government support [17]. Therefore, changing
                                      consumers’ awareness and perceptions of innovations, such that EVs are included in their
                                      car shopping research, enabling informed choices well before they get to a showroom,
                                      could be a critical factor in fostering EV uptake.
                                            In this regard, the mass media play a significant role in closing the knowledge gap,
                                      but they do not inform all readers equally [18]. For example, by limiting the information
                                      that readers receive, the media can construct uncertainty around issues, which may serve
                                      to thwart adoption of behaviours and work against a change in attitude [19]. In addition,
                                      focusing on stories that are geographically proximate is more likely to engage readers [20].
                                      In short, the media could help establish and usefully promote a positive image for EVs,
                                      increase ‘visibility’ and acceptability to targeted communities, and help change attitudes
                                      about these vehicles.
                                            However, media outlets do not strictly just report the facts, instead likely inserting
                                      bias, whether intentional or unintentional, into their reporting [21,22]. News stories can be
                                      framed positively or negatively, influencing readers’ opinions and perceptions of issues [23],
                                      and involve complex interactions of human psychological traits, such as loss aversion [24].
                                      For instance, it is known that selective framing can result in climate change denial [25],
                                      perhaps by emphasising contrarian voices, as occurs in the UK and US [26]. Further,
                                      readers tend to seek out news outlets with culturally congruent world views [27], and such
                                      preferences are economically significant [28].
                                            We can draw parallels and links to our current understanding of the media’s role
                                      influencing people’s attitudes and perceptions of climate change, and extend that question
                                      to EVs, where there is a gap in that understanding. Thus, to complement government
                                      policies activating dynamic social processes [29], news outlets may contribute to a social
                                      tipping point by facilitating information sharing, affecting consumer behaviour.
                                            Many studies have focused attention on the attitudes and perceptions of car buyers
                                      towards EVs, affecting their willingness to buy, e.g., [14–16]. However, there is a gap in
                                      understanding how different segments of the car market utilise the media and potential
                                      links to their car buying preferences.
                                            Hence, the purpose of this paper is to explore the role that the written media and
                                      other communication channels play in consumer perceptions about EVs and awareness of
                                      government-initiated programs to incentivise market transition. Thus, by acting as sources
                                      of reliable up-to-date factual information about available policies and vehicle attributes,
                                      the media could help change people’s views, mobilising the market to adopt EVs. In this
                                      research, the mass media and print media are taken to include written communications
                                      that are produced mechanically or electronically.
Electric Vehicle Uptake: Understanding the Print Media's Role in Changing Attitudes and Perceptions
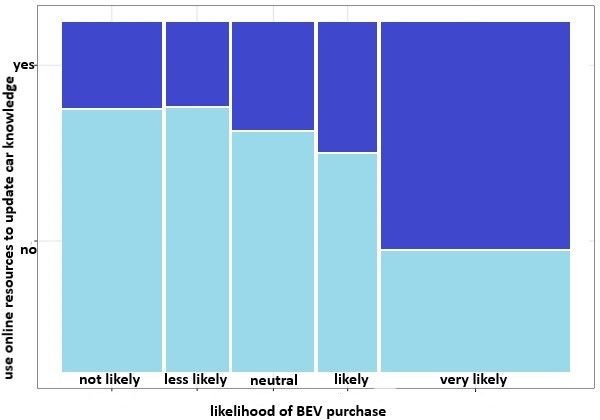
World Electr. Veh. J. 2021, 12, 174                                                                                             3 of 27

                                           To this end, New Zealand (NZ) affords a suitable case for study, as it is a country largely
                                      employing renewable electricity, high levels of newspaper readership [30] (Section 3.2.1),
                                      high vehicle ownership (Section 2.3), and multiple policies introduced in 2016 to boost EV
                                      volumes (Table S1). However, despite rapid adoption of EVs [31] by the innovators and
                                      early adopters since that time, EVs have not yet appealed to mainstream consumers and
                                      there is potential for the EV market to plateau rather than accelerate. It is posited that the
                                      media could be used in social marketing campaigns to ameliorate knowledge gaps among
                                      car buyers, especially the next most EV-ready segment, providing further opportunities for
                                      access to information.
                                           The paper is structured as follows: Section 2 provides background material about the
                                      impact of the media on people’s opinions and the importance of information in aiding con-
                                      sumer choice, including New Zealand’s car market and media consumption (Section 2.3).
                                      Section 3 explains the methodology and conceptual framework. Thereafter, Section 4
                                      provides the results, discussed in Section 5. Section 6 provides recommendations for action,
                                      and final considerations and conclusions are presented in Section 7. Following the refer-
                                      ences, the Supplementary Material contains supplementary data, to assist those wishing to
                                      have further details.

                                      2. Background
                                      2.1. Opinion-Based versus Fact-Based: The Media’s Role in Shaping Perceptions
                                           Coverage of climate change has been polarised by traditional media [32], thus shaping
                                      people’s understanding in different ways [33]. An analysis of climate change reporting
                                      noted that rather than presenting a balanced view of the news, reporters moved into
                                      an opinion-based interpretative pattern of journalism, thus shaping media debates [26].
                                      Researchers found the US’ partisan media strengthened the views of like-minded audiences
                                      about climate change and that Republicans used the media to reject messages about it [34].
                                      Aligning with that view [35] it was further argued that understanding these biases enhances
                                      comprehension of how news media use bias as a tool to distribute power. Further, it has
                                      been found the news media played a role in influencing peoples’ views on climate change,
                                      but only by acting as a conduit for political mobilisation by elites and advocacy groups,
                                      whereas accurate scientific knowledge played no role in shaping people’s actions [36].
                                           More positively, it was noted US mass media had a positive influence on hybrid
                                      vehicles sales in areas where the media reported climate change, with preliminary evi-
                                      dence suggesting the media can play a role in advocating for climate-friendly action and
                                      furthermore affecting consumer purchases [37]. Media bias about EVs has received some
                                      coverage [38]; for example, two projects [39,40] both reported there was a positive link
                                      between advertising spend and editorial content in newspapers, including those with
                                      online platforms, which may be relevant in the promotion of car models reviewed by
                                      motoring journalists reporting in the media.

                                      2.2. Information as a Driver of Consumer Choices
                                           Another influence on the development of a positive attitude towards EVs, thereby
                                      increasing acceptability, is the role of informational conformity (where people accept the
                                      information of others as factual) and social conformity (yielding to group pressure), which
                                      are well known phenomena [41]. Both mechanisms were highly significant for EV accep-
                                      tance [42]. Information helps people change their opinions, and research demonstrated
                                      that social delivery strongly impacts its effect [43].
                                           For a market to reach a tipping point requires powerful positive feedback loops [44]
                                      with small changes triggering non-linear change potentially facilitating a transition to-
                                      wards all new passenger vehicle sales being EVs rather than ICEVs [29]. Modelling [45]
                                      ascertained 5% of the total fleet (installed base) could engender such a transition. However,
                                      the percentage could be market dependent and inevitability cannot be guaranteed as gov-
                                      ernment action impacts on each market [46] and, importantly, consumer knowledge of such
                                      action is imperative. Evidence of the latter is NZ’s earlier attempts to introduce compressed
World Electr. Veh. J. 2021, 12, 174                                                                                          4 of 27

                                      natural gas vehicles to the fleet, any interventions were not sustained, the market did
                                      not reach a tipping point, and eventually numbers fizzled out [47]. Such a result offers
                                      a salutary lesson in the value of prolonged government action until the market can take
                                      over, as has been demonstrated by Norwegian EV sales successes [5] where government
                                      support has been sustained [48], and complemented by comprehensive media coverage,
                                      which research has evidenced was a factor in encouraging 84% of Norwegian EV owners
                                      to make a decision to buy an EV before reaching a showroom [49].

                                      2.3. New Zealand Car Market and Media Readership
                                           New Zealand has very high rates of car ownership, with a fleet of about four million
                                      four-wheeled, light vehicles, making up about 93% of the total fleet, of which over 90%
                                      are petrol fuelled and less than 1% plug-in electric [31], serving a population of some
                                      five million people (https://www.stats.govt.nz/indicators/population-of-nz; accessed on
                                      9 September 2021). New Zealand does not have a vehicle manufacturing industry and
                                      imports all of its vehicles, many of them second-hand from other right-hand-drive markets
                                      such as the UK and Japan [31]. Electric vehicles are permitted to be imported new, and
                                      used (from UK or Japan), and the government publishes detailed monthly EV statistical
                                      data [31].
                                           Many New Zealanders read the media [30] across platforms, however, modern media
                                      tend to deliver their news across multiple platforms and many people utilise different
                                      platforms across time and people’s consumption of news is complex [50]. The level of
                                      engagement of readers with news platforms, in particular the main newspaper mastheads
                                      regardless of delivery platform, is not dissimilar to other countries such as Australia [51].

                                      3. Conceptual Framework and Method
                                      3.1. Conceptual Framework
                                           Not only do governments need to employ policies evidenced to increase EV purchase
                                      rates, they also ought to employ methods that could improve policy implementation lead-
                                      ing to increased consumer action. Here, we apply systems thinking to better understand
                                      the connections between policy, research, and practice, and how policy outcomes could be
                                      improved through the application of evidence, including that acquired from car buyers
                                      in different stages of acceptance of EVs as an innovative technology. With a focus on
                                      the informational/communications aspect we utilise Knowledge to Action thinking [52]
                                      including factors important for adoption: characteristics of the innovation, readiness for
                                      the innovation, and processes used to foster change.
                                           Shifting car buying behaviour towards favouring ‘environmental’ vehicles, such as
                                      EVs, needs greater problem awareness to develop social norms and affect consumers’ atti-
                                      tudes [10], and which are all linked to willingness to buy EVs [53–55]. We take these ideas
                                      further and contend that to increase success rates, the segment next most likely to buy an
                                      EV should be the focus of attention for updating policies regarding communications, in line
                                      with social marketing techniques [56]. This is especially important if, over time, incentives
                                      to encourage EV purchase are becoming more important, not less [57]. Developing an
                                      understanding of factors affecting different consumer segments, including knowledge,
                                      values, and attitudes, acquired from disparate sources, such as advertising, the media,
                                      implementation of government policy and other people, can make a positive contribution
                                      to changing people’s behaviour next time they buy a car.
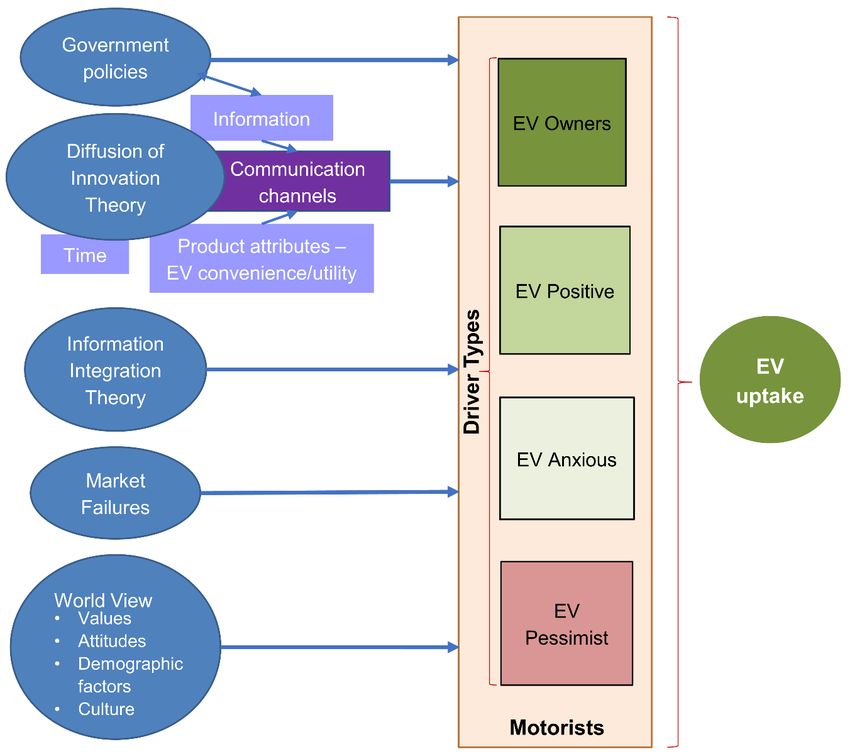
                                           Hence, the conceptual framework of this research (Figure 1) contends that multiple
                                      factors affect consumers’ purchasing decisions about whether to go electric or not. We
                                      use Diffusion of Innovation Theory [58] (Table S2), Information Integration Theory [12],
                                      differences in government policies [59], market failures [60], and the importance of a
                                      consumer’s world view [61] to help explain influences that potentially change individual’s
                                      behaviours and the choices they make.
Electr. Veh. J. 2021, 12, x FOR PEER REVIEW                                                                                           5 of 27

                                 ferences
          World Electr. Veh. J. 2021, 12, 174in
                                           government policies [59], market failures [60], and the importance of a con-                                5 of 27
                                sumer’s world view [61] to help explain influences that potentially change individual’s
                                behaviours and the choices they make.

                             Figure 1. framework
                Figure 1. Conceptual    Conceptual of framework    of the
                                                         the theories  andtheories and paradigms
                                                                            paradigms    influencinginfluencing
                                                                                                       car buyingcar   buying
                                                                                                                   action:    action:
                                                                                                                           Rates  of EVRates
                                                                                                                                         uptake differ
                             of EV uptake
                among car buying             differ
                                     motorists   andamong     car buying
                                                       are influenced   bymotorists  and areinertia
                                                                            socio-technical    influenced   by socio-technical
                                                                                                      that incorporates         inertia
                                                                                                                         multiple       thatincluding:
                                                                                                                                    factors
                Governmentincorporates
                              policies [59],multiple
                                            Diffusionfactors   including:
                                                         of Innovation     Government
                                                                        processes         policies [59],Integration
                                                                                   [58], Information     Diffusion ofTheory
                                                                                                                      Innovation  processes
                                                                                                                            [12], market  failures [60],
                and consumers’ world views [61]. Each Driver Type represents a sub-set of car buyers, each with different[61].
                             [58], Information    Integration   Theory   [12], market  failures  [60], and  consumers’   world  views   attitudes and
                             Each Driver Type represents a sub-set of car buyers, each with different attitudes and perceptions
                perceptions towards EVs, as part of the whole population of Motorists, and the label for each subset reflects these different
                             towards EVs, as part of the whole population of Motorists, and the label for each subset reflects
                attitudes to EVs.
                             these different attitudes to EVs.
                                               3.2. Methodological Approach
                                3.2. Methodological Approach
                                                     To gain a deeper understanding of the role of the media in the perceptions and
                                     To gain aattitudes
                                                 deeper understanding       of the EVs,
                                                          of car buyers towards     role of
                                                                                          New theZealand
                                                                                                  media in     the was
                                                                                                            (NZ)   perceptions
                                                                                                                         used as aand
                                                                                                                                    caseatti-
                                                                                                                                           study (Section 1).
                                tudes of car buyers   towardsemployed
                                               The research      EVs, Newmixed
                                                                             Zealand    (NZ) was
                                                                                     methods          used as athe
                                                                                                 to measure       case  study
                                                                                                                     same       (Sectionin1).
                                                                                                                            variables        different ways,
                                The research employed       mixed   methods    to measure      the same    variables
                                               triangulating results to increase trustworthiness and credibility [62]. in  different   ways,
                                triangulating results   to increase
                                                     Firstly,        trustworthiness
                                                              a desktop  survey of New   and    credibility
                                                                                             Zealand’s        [62]. print media (across platforms) that
                                                                                                          leading
                                     Firstly, apublish
                                                desktoparticles
                                                           surveyonofcars
                                                                       New   Zealand’s     leading
                                                                          was undertaken to investigateprint  media
                                                                                                                  how(across
                                                                                                                         EVs wereplatforms)
                                                                                                                                     presented 2011–2019
                                that publish articles
                                               (Sectionon3.2.1).
                                                          cars was
                                                                 Theundertaken
                                                                      written media to investigate
                                                                                         were selected howforEVs  were presented
                                                                                                                investigation     as it 2011–
                                                                                                                                        forms part of most
                                2019 (Section people’s
                                               3.2.1). The  written
                                                          media       media wereand
                                                                   consumption       selected
                                                                                         is an for    investigation
                                                                                                 important      sourceasthat
                                                                                                                          it forms    part of as relatively
                                                                                                                               is perceived
                                most people’sreliable
                                                 media [50].
                                                         consumption
                                                               Secondly,and    is an of
                                                                          a survey    important
                                                                                        car buyers   source   that3.2.2)
                                                                                                       (Section     is perceived     as rela-in two parts to
                                                                                                                         was conducted
                                tively reliablegather
                                                [50]. Secondly,   a survey
                                                        quantitative         of car buyers
                                                                       and qualitative    data:(Section
                                                                                                  firstly,3.2.2)  was conducted
                                                                                                            by questionnaire,      andin secondly
                                                                                                                                          two       through
                                parts to gather   quantitative   and  qualitative   data:   firstly,  by questionnaire,      and   secondly
                                               interviews, to gain deeper and more nuanced views and to help reduce error and bias [21].
                                through interviews,    to gain deeper
                                               The interviews           and more
                                                                  also provided      nuancedofviews
                                                                                   evidence              and to help
                                                                                                   questionnaire         reducestability
                                                                                                                     response     error and  [63].
                                bias [21]. The interviews also provided evidence of questionnaire response stability [63].
                                               3.2.1. Identification, Collation, and Analysis of New Zealand’s Print Media Treatment of
                                               EVs: Newspapers and Car Magazines
                                                       New Zealand’s population of about 5 million people supports many newspapers
                                                  delivered across print and online platforms, which have a wide readership, and ‘77.6%, of
                                                  New Zealanders aged 14+ now read or access newspapers in an average 7-day period via
                                                  print or online (website or app) platforms’ [30]. An analysis was undertaken of NZ’s top ten
World Electr. Veh. J. 2021, 12, 174                                                                                            6 of 27

                                      written sources (by readership) that publish articles about cars. The online title TradeMe
                                      (https://www.trademe.co.nz/a/motors/cars accessed on 9 September 2021), although
                                      popular, was excluded from the search as it largely functions as classified advertising for
                                      cars on sale, with minimal news items about cars, although it does publish some reviews.
                                      The Factiva database was searched from 1 January 2011 to 31 December 2019 for stories
                                      about “electric vehicle*”, “Tesla”, “Elon Musk”, and “Dieselgate”, with those not relevant
                                      to EVs eliminated from analysis. The online title Driven NZ published thousands of articles
                                      about EVs in that period, therefore 501 stories were analysed. Each article was read in full
                                      noting: date, author (or source), title, topic, subjects, and framing, by observing the tone of
                                      words used to describe EVs. Percentages of positive, neutral, and negative framed articles
                                      were calculated for each masthead.

                                      3.2.2. Survey of Car Buyers
                                           We compared car consumers in two samples, EV owners, and ICEV buyers by conduct-
                                      ing two online questionnaires, followed by interviews with some respondents randomly
                                      selected from a panel of volunteers from each group.

                                      Sampling Frame and Survey Data Collection
                                            The units of analysis were New Zealand car drivers, aged 18 or over, who intended to
                                      buy a car at some future time, and thus were potential consumers of EV technology. Two
                                      online questionnaires, each with the same questions, were implemented in March–April
                                      2020 to compare car drivers who own EVs with car drivers of ICEVs who could potentially
                                      buy an EV in the future. In the requests for participation, anonymity was guaranteed and
                                      it was explained that participation gave tacit approval for retaining and using their data.
                                            To sample consumers who drive ICEVs, the polling company YouGov was engaged
                                      as its methodology, used in extensive election polling, has been relatively accurate [64].
                                      YouGov randomly sampled ICEV consumers (n = 588) from its large national panel with
                                      quotas for gender, region, and age, and those not intending to buy a car in the future
                                      were exited from the survey. Prior to the main study a pilot study (n = 61) tested question
                                      validity and enabled adjustment of question order. Interviews (n = 31) were conducted
                                      with participants randomly selected from the half of all ICEV participants (n = 588) who
                                      volunteered contact details.
                                            To sample EV owners a separate questionnaire, delivered via the online platform
                                      Qualtrics, was conducted (n = 305) using the same questions as the YouGov survey. To
                                      obtain a sufficiently large sample of EV owners, requests for participation were posted on
                                      the EV Owners Facebook page and the Better NZ Trust webpage. Although volunteers,
                                      many of these people could be considered to be strongly opinionated because fewer
                                      than 2% of New Zealand motorists own EVs [31] and therefore, as Innovators and Early
                                      Adopters [58] most could be considered to be EV enthusiasts; thus, these participants
                                      were likely to represent the majority view for current EV owners. More than half the
                                      sample (n = 305) voluntarily provided contact details, from whom interviewees (n = 31)
                                      were randomly selected.

                                      Questionnaires
                                           Four main themes were investigated: demographics; purchasing practices and vehicle
                                      ownership; communication channels and knowledge acquisition; and EV and environmen-
                                      tal perceptions, attitudes, and values. Table 1 lists the questions presented to participants
                                      relevant to this study. Most questions were closed response and were either Likert Scaled
                                      (1–5) or multiple choice with randomized row order to eliminate positional advantage;
                                      “Don’t know” and “Other” were fixed at the end. Two questions were short open response.
World Electr. Veh. J. 2021, 12, 174                                                                                                        7 of 27

         Table 1. Wording used in the questionnaires for questions discussed in this paper. Further explained in Section 3.2.2.

     Question Number                                                               Question Text
                                      When you are considering what to buy for your next car, how much research do you do to familiarise
                                      yourself with changes in market offerings? Choose the most appropriate response.
                                      1: Very little, I just buy something similar to last time
                                      2: I rely on the car sales staff at the dealership
               A8
                                      3: I do a lot of research
                                      4: I rely on discussions with family and friends
                                      5: I rely on someone else to choose and buy the car
                                      6: Other—please specify
                                      From which single source do you get MOST of your information about new car models coming onto
                                      the market? Choose the source you use most often.
                                      1: friends and family, that is by word of mouth
                                      2: written sources: newspapers/magazines (print or online), including manufacturers websites
                                      3: Social media (e.g., Facebook)
              A13                     4: AANZ
                                      5: Television
                                      6: radio
                                      7: Car sales staff
                                      8: Other- please specify
                                      9: I am not really interested in finding out about cars
                                      Thinking of the written media (print or online) including newspapers and magazines, please indicate
                                      the sources you READ most often to update your knowledge about cars. Please select up to 3 options
              A14                     1: AANZ; 2: New Zealand Herald; 3: Dominion Post; 4: The Press; 5: Otago Daily Times; 6: Waikato
                                      Times; 7: NZ Autocar; 8: Autotrader; 9: Driven NZ; 10: Stuff Motoring News; 11: International online
                                      sources; 12: Social media; 13: Other—please specify; 14: I rarely, if ever, read about cars
                                      Please write down three words (or short phrases) that pop into your head that you would use to
              A21
                                      describe electric vehicles. EVs are . . . ..[open]
                                      The following list shows the initiatives that New Zealand has taken to increase the popularity of
                                      electric cars (EVs)
                                      1: EV Ride and Drive events where you can see and drive EVS
                                      2: Importation of good quality second-hand EVs from Japan and UK permitted
                                      3: First registration tax exemption for EVs (until 2021)
                                      4: Allowed EVs to use lanes normally reserved for buses or vehicles with multiple occupants
                                      5: Provision of a website with lots of information about EVs, including a list of car dealers who sell EVs
                                      6: Support for the installation of a network of fast chargers about NZ
           Initiatives
                                      7: Smart phone app called EV Roam to enable motorists to find EV recharger locations
                                      8: contestable fund that offers grants to help organisations, including charities, to buy EVs or install
                                      rechargers, or other initiative to increase EV uptake
                                      9: From 2021, the proposed clean car discount would subsidise the purchase price of cars with low
                                      emissions whereas the first registration fee of cars with high emissions would pay an additional
                                      registration fee
                                      10: From 2021, the proposed clean car standard would require vehicle importers to reduce the average
                                      emissions of their imports by increasing the number of cleaner cars they import
                                      Please choose as many of the initiatives [from 1–10 listed above] that you have heard or read about, [or],
              A22
                                      11: I have not heard or read about any of these initiatives
                                      Please choose the three most appealing to you [from 1–10 listed above] as a consumer that might help
                                      persuade you to buy an EV, [or],
              A23
                                      11: don’t know
                                      12: I would never buy an EV
                                      On a scale of 1–5 where 1 represents not likely, 3 represents neutral and 5 represents very likely, how
             A15-1                    likely are you to buy a . . . ?
                                      Fully electric car (BEV)
             A15-2                    Plug in Hybrid (PHEV)
World Electr. Veh. J. 2021, 12, 174                                                                                                         8 of 27

                                                                     Table 1. Cont.

     Question Number                                                               Question Text
                                      When thinking about car purchase, please consider the following qualities and indicate on a scale from
              A17
                                      1–5 how important each factor is to you when thinking whether to go electric or not
             A17-2                    Vehicle purchase price
                                      Total ownership cost savings of EVs over time compared to conventional cars e.g., due to fuel cost
             A17-3
                                      savings
             A17-7                    The expected life of the battery
                                      How do you think, overall, are EVs portrayed in the media: 1 = very negative; 2 = negative; 3 = middle,
              A18                     there is a mix of positive and negative; 4 = positive; 5 = very positive; 6 = I haven’t noticed any stories
                                      in the media about electric cars
                                      ICEV: Complete this statement: I would be more likely to buy an EV if . . . (open)
              A24
                                      EV: The main reason I bought a plug-in electric car is . . . (short answer)
                                      When thinking about electric cars, which of the following statements most closely matches your
                                      thoughts about buying an EV?
                                      1: It’s about time, why wouldn’t you
                                      2: Yes please, it would save how much fuel?
                                      3: Yes please, but make it a plug-in hybrid for now
              A16                     4: Great idea but where would I charge it?
                                      5 If everyone else is, then maybe . . . .
                                      6: Will they save the planet? Don’t think so.
                                      7: I would never be seen in one of those
                                      8: I do a lot of driving, convince me
                                      9: Don’t know

                                         Interviews
                                              Semi-structured interviews were conducted between May–June 2020 by Zoom or
                                         telephone during New Zealand’s first lockdown period of the COVID19 pandemic. Inter-
                                         viewees were specifically asked to describe their usual pre-lockdown behaviours. Ques-
                                         tions focused on questionnaire themes. Interviews, with permission, were recorded and
                                         transcribed using the online platform Otter.

                                         Market Segmentation
                                               To segment the market by attitude for the first analysis, participants of the two online
                                         questionnaires were asked to choose a statement (see Table 1—A16) most closely reflecting
                                         their attitude to EVs. Table S4a,b show these statements, derived from [65]. From the
                                         first questionnaire presented to ICEV consumers (n = 588), those choosing: Statements 1
                                         and 2 were allocated to the EV Positives (n = 154), Statements 3 and 4 to the EV Anxious
                                         (n = 201), while Statements 6 and 7 were named EV Pessimists (n = 89). Participants of
                                         the second questionnaire were EV Owners (n = 305), who mainly selected Statement 1,
                                         and were compared to the other three segments. Segment labels encapsulate Driver Type
                                         attitudes to EVs (Figure 1).

                                         3.2.3. Statistical Data Analysis
                                              Responses to the questionnaires were analysed in two ways. Firstly, the questionnaires
                                         segmented car buyers according to their attitudes to EVs (Section 3.2.2 Market Segmenta-
                                         tion), assigning participants to one of four segments hereafter referred to as ‘Driver Type’,
                                         although some respondents did not fit and were excluded from this analysis. Secondly,
                                         further analysis of all car buyers sampled by the two questionnaires (n = 893) was carried
                                         out according to their likelihood to purchase a BEV (Table 1—A15-1).
World Electr. Veh. J. 2021, 12, 174                                                                                            9 of 27

                                      Tests of Association by Driver Type
                                            The metric of Driver Type was used to carry out tests of association and results of
                                      different questions of interest for each driver. For categorical questions, Pearson’s chi-
                                      squared test [66] was used as a test of association between two categorical variables. For
                                      Likert-scale questions, an analysis of variance was used to test if there is a difference in the
                                      mean Likert scores among the four Driver Types.
                                            To evaluate their perceptions of EVs, participants were asked to ‘Write down three
                                      words (or short phrases) that pop into your head that you would use to describe EVs’.
                                      As many words/phrases are synonyms for one meaning, responses to open short-answer
                                      questions used latent content analysis as it was more appropriate than manifest content
                                      analysis [67]. Data analysis was conducted for the number of participants using synonyms
                                      of words or short phrases with certain meanings of interest to describe EVs. Additionally,
                                      respondents who used at least one negative word were tallied. Participants’ use of these
                                      synonyms, or at least one negative word, was then compared to Driver Type using Pearson’s
                                      chi-squared tests.
                                            ICEV consumers were asked to complete this statement: ‘I would be more likely to
                                      buy an EV if . . . ..’ (Question A24), to facilitate an understanding of their perceptions
                                      of barriers to EV adoption, or potential incentives. Similarly, EV Owners were asked to
                                      complete this statement: ‘The main reason I bought a plug-in electric car is . . . ’. Open text
                                      responses were analysed and coded for specific themes [67] using an iterative process, thus
                                      applying an inductive approach to search for meaning. Responses were read to generate
                                      initial codes then reviewed, re-categorised if required, and after several passes, frequencies
                                      for each of the final themes were recorded.
                                            All p-values were adjusted to account for multiple hypothesis testing using a ‘Holm’
                                      adjustment [68]. If there was evidence of an association between a question and Driver
                                      Type after adjusting for multiple comparisons, this relationship was examined through
                                      Mosaic plots, frequency histograms, or boxplots. All analysis and plotting used ‘R v4.0.20 .
                                      In Mosaic plots, column width signifies sample size of that Driver Type, while the height
                                      of individual “tiles” within the mosaic represents the proportion of each option.

                                      Likelihood to Buy Ratio Tests
                                           For the second analysis, a test was conducted to take into account that consumer
                                      decisions are likely to integrate information they have relating to multiple attributes for the
                                      vehicle they are considering for purchase and their personal circumstances (see Section 1
                                      and Figure 1 Conceptual Framework). Thus, information consumers have gleaned from
                                      multiple sources would likely contribute to that decision, which we have encapsulated by
                                      asking respondents about their likelihood to buy an EV.
                                           In this likelihood to buy ratio test all participants (n = 893), regardless of attitude
                                      to EVs, were categorized into five groups; ‘not likely, ‘less likely, ‘neutral’, ‘likely’, and
                                      ‘very likely’, based upon their likelihood to buy battery electric vehicles (BEV) and their
                                      response to question 15-1; this metric will be referred to as ‘likelihood to purchase BEV’.
                                      Subsequently, ordinal logistic regression models were used to test the effect of participants’
                                      information sources on their likelihood to purchase a BEV. This method appropriately
                                      models the ordinal scale of the ‘likelihood to buy a BEV’ question and was undertaken
                                      using the CLM function from the ordinal package in R (R-Package version 28) [69].
                                           Separate models were fit for each further question of interest with appropriate filtering
                                      applied, and likelihood ratio tests were used to test the strength of association between the
                                      variables. All p-values were adjusted to account for multiple hypothesis testing using a
                                      Holm adjustment [68]. Evidence of association between a question and the likelihood to
                                      purchase a BEV after adjusting for multiple comparisons were further investigated using
                                      Mosaic plots or boxplots. All analysis and plotting were done in ‘R v 4.0.20 .
World Electr. Veh. J. 2021, 12, 174                                                                                                          10 of 27

                                      3.3. Limitations
                                            Fewer than 1% of New Zealand cars are EVs [31], and hence there are relatively few
                                      EV owners compared to ICEV owners/drivers among the entire population of motorists.
                                      Thus, compared to the sampling method employed for the ICEV drivers, the low numbers
                                      of EV owners required an alternative method to source panel members for the EV owner
                                      questionnaire (as described in Section 3.2.2). However, given that EVs comprise such a
                                      small percentage of the fleet, EV owners who responded to the survey were assumed
                                      to be representative of EV owners in general, as innovators and early adopters; this
                                      assumption aligns with Diffusion of Innovation theory [58] that postulates early adopters
                                      are enthusiastic about the technology. Another limitation of this study was that it took place
                                      during the early days of the COVID 19 pandemic, which may have affected people’s views
                                      of life in general. To overcome this potential limitation, during the interviews respondents
                                      were asked to specifically recall behaviours prior to any lockdown and the results tallied
                                      well with the questionnaire results.

                                      4. Results
                                           Results of the two parts of the research, the media survey and consumer survey, are
                                      presented in Sections 4.1 and 4.2.

                                      4.1. Media Survey
                                           Table 2 synthesises the results of analysing articles published in New Zealand’s
                                      principal written media publishing articles about cars from 2011 to 2019 inclusive.

      Table 2. New Zealand’s written media—newspapers and magazines, with stories about cars, showing percentage of
      positive, neutral and negative framed articles for each media outlet.

            Media Outlet                 Readership Numbers/Week             No. EV Articles Analysed                     Framing %
                                                                                                                 +             0             –
   Automobile Association of NZ                    416,000   a                           63                     79             21            0
              NZ Herald                            1,844,000     a                       446                    65             27            8
   Driven NZ (classifieds + news)                  111,000 b                             501                    70             25            5
          Otago Daily Times                        253,000   a                           101                    85             13            3
               The Press                           314,000 a                             387                    71            22.5          6.5
            Waikato Times                          214,000 a                             246                    58             38            4
            Dominion Post                          432,000 a                             424                    61             34            5
        NZ Autocar magazine                         14,000   a                           332                    84             11            5
    NZ Autotrader (classifieds +
                                                     N/A                                 56                     91             9             0
             news)
           Stuff Motoring c                        208,750 c                             43                     58             26            16
      Notes: a Print is net readership in an average 7 days. Digital is average website visitation and app usage (if available) in an average
      7 days. The above are cross-platform readership figures [30]. b Weekly readership http://www.voxy.co.nz/business/5/352922 (accessed
      on 22 February 2021). c a paywall restricts access to Stuff articles. Monthly readership of Stuff Motoring at November 2019, (Nielsen CMI
      Fused audiencefinder.stuff.co.nz/index.html)—averages to 208,750 reads per week.

                                      4.2. Car Buyer Survey
                                      4.2.1. Results of Driver Type Analysis
                                            Participants of the two questionnaires (n = 893) generated responses that were anal-
                                      ysed to enable NZ car buyers to be allocated to Driver Type dependent on their attitudes
                                      to EVs, based on Question A16 (see Tables 1 and S4a,b). Some respondents (n = 144)
                                      were unable to be allocated to one of the four selected Driver Types and were omitted
                                      from further analysis regarding Driver Type comparisons, but they were included in the
                                      likelihood to buy ratio tests (Section 4.2.2).
                                            Table 3 displays the results of the statistical data analysis, and it provides evidence of
                                      significant differences among Driver Types, with strong evidence of association between
World Electr. Veh. J. 2021, 12, 174                                                                                                 11 of 27

                                           Driver Type and most factors (p < 0.05); factors showing no correlations were: whether or
                                           not a consumer purchased cars new or used (A3); use of magazines (A14) or newspapers
                                           (A14) for research about cars; and household income (P4).

      Table 3. Results from Pearson’s Chi-squared tests and ANOVAs for the questions of interest against ‘Driver Type’ (Question
      A16). n is the number of samples left after filtering; method is the method used with test statistics being chi-squared test
      statistics for chi-squared tests and likelihood ratio test statistics for ANOVAs. df is the degrees of freedom and ‘p-value’ are
      the p-values that have been adjusted to account for multiple hypothesis testing using a Holm adjustment [68]. Table S10
      provides the full wording for each question.

  Question Number                               Issue                  n             Method          Test Statistic     df     p-Value
        Gender                                 Gender                  748            Chisq              54.7            3
A17_3                   Importance of total ownership costs            740        ANOVA               266.4           3
World Electr. Veh. J. 2021, 12, 174                                                                                           13 of 27

      Table 4. Differences among Driver Types for: Likelihood of BEV and PHEV purchase (A15_1,2: mean Likert Score 1–5, 1 is
      the most negative and 5 the most positive); Perception of how the media portray EVs (A18: mean Likert Score 1–5); those
      choosing A18_ 6 ‘I have not noticed any stories in the media about EVs’ as a percentage; those choosing Option A14_14 ‘I
      rarely, if ever read about cars’ expressed as a percentage for each Driver Type.

                                                  EV Owners            EV Positives           EV Anxious        EV Pessimists
                     Factor
                                                    n = 305              n = 154                n = 201            n = 89
    Likelihood of buying BEV (A15_1)
                                                        4.82               3.33                  2.5                  1.9
          Mean Likert Scores 1–5
   Likelihood of buying PHEV (A15_2)
                                                        1.97               3.14                  3.49                 2.19
          Mean Likert Scores 1–5
  Perception of how the media portray
                                                        3.05               3.99                  3.78                 3.38
   EVs (A18) Mean Likert Scores 1–5
 “I have not noticed any stories in the
                                                        1.3%               7.1%                  6%                  5.6%
 media about EVs” (A18_6) Percentage
     “I rarely if ever read about cars”
                                                     11.1%                 26%                  31.8%                36%
           (A14_14) Percentage

                                             Asking respondents to select as many Government initiatives they had heard of was
                                       used as a measure of awareness, and percentages for each initiative are shown in Table 5
                                      ‘Aware’ column. A box plot (Figure S13) illustrates ‘initiative awareness’ (mean number of
                                       initiatives for each Driver Type).

      Table 5. Awareness and desirability of NZ Government incentives to foster EV uptake by each Driver Type as a percentage
      (See Table S10: A22; A23).

            Initiative                   EV Owners               EV Positives            EV Anxious            EV Pessimists
                                      Aware    Desirable       Aware    Desirable     Aware     Desirable   Aware       Desirable
 EV Ride and Drive Events              84.3       18.4          9.1        11.0        9.5         11.9       6.7            12.4
 Importation 2nd hand EVs              85.6       40.7          18.8       36.4        18.4        36.8       12.4           24.7
     First registration tax
                                       45.2       14.4          18.8       29.2        11.9        24.7       16.9           15.7
     exemption till 2021
     EV use of HOV lanes               61.0       10.2          13.6       25.3        11.4        21.4       12.4           20.2
     Information website               43.0       4.9           14.3       17.5        11.4        17.4       6.7            15.7
       Nation-wide fast
                                       87.5       53.4          35.7       48.1        38.3        56.2       36.0           22.5
       charge network
     Smart phone app for
                                       27.9       3.6           20.8       33.1        17.9        36.8       12.4           18.0
      recharger locations
     Contestable fund for
                                       59.7       13.4          7.8        11.5        6.5         7.5        6.7            4.5
         EV grants
        Proposed Clean
                                       73.8       29.2          30.5       51.3        30.3        42.8       23.6           31.5
         Car Discount
        Proposed Clean
                                       49.5       12.5          24.7       20.8        21.4        14.9       13.5           6.7
         Car Standard
    I am not aware of any
                                       0.7                      35.1                   38.3                   41.6
          initiatives
          Don’t know                              5.9                      3.2                     8.5                       12.4
  I would never buy an EV                                                  1.9                     1.5                       30.3
   I would have bought an
                                                  52.1
         EV anyway
World Electr. Veh. J. 2021, 12, x FOR PEER REVIEW                                                                                               14 of 27

World Electr. Veh. J. 2021, 12, 174                                                                                                          14 of 27

  I would never buy an
                                                                             1.9                           1.5                           30.3
           EV
I would have bought an                      Respondents   were also asked for their top three preferred incentives that could encour-
                                             52.1
      EV anyway                       age or contributed to EV uptake. The ‘Desirable’ column in Table 5 shows the percentage
                                      of respondents who selected individual initiatives as one of their three most preferred.
                                      4.2.2. Results of Likelihood to Buy Ratio Tests
                                      4.2.2.Table
                                             Results of Likelihood
                                                  6 and  Figures 4–6tosynthesise
                                                                       Buy Ratio the
                                                                                  Tests
                                                                                      results of applying the tests described in Sec-
                                            TableLikelihood
                                      tion 3.2.3     6 and Figures  to Buy4–6Ratio
                                                                               synthesise
                                                                                     Tests. the  results
                                                                                             Figure        of applying
                                                                                                     4 shows              the tests
                                                                                                                 that drivers    ‘verydescribed    in
                                                                                                                                         likely’ and
                                      Section to
                                      ‘likely’   3.2.3  Likelihood
                                                    purchase      a BEVto Buy
                                                                           usedRatio   Tests.
                                                                                  written     Figure
                                                                                           sources     4 shows
                                                                                                     more         that drivers
                                                                                                             frequently           ‘veryon
                                                                                                                          and relied     likely’
                                                                                                                                            word and
                                                                                                                                                   of
                                      ‘likely’
                                      mouth lessto purchase
                                                     than those   a BEV    used written
                                                                     ‘not likely’ to buy asources   more 5frequently
                                                                                            BEV. Figure        shows that and
                                                                                                                            userelied   on word
                                                                                                                                 of online         of
                                                                                                                                             sources
                                      mouth
                                      is higherless
                                                  forthan  those
                                                       those        ‘notor
                                                               ‘likely’   likely’
                                                                            ‘veryto buy atoBEV.
                                                                                  likely’         Figurea 5BEV.
                                                                                             purchase        shows
                                                                                                                 The that useof
                                                                                                                       count   of‘initiative
                                                                                                                                   online sources
                                                                                                                                              aware-is
                                      higher   for  those  ‘likely’   or ‘very likely’ to purchase   a BEV.   The  count  of ‘initiative
                                      ness’ was subject to a further test to determine if there was any correlation with likelihood       awareness’
                                      was   subject to
                                      to purchase      anaEVfurther    test to determine
                                                                 (p < 0.0001,   Table 6—Aif22_count)
                                                                                               there wasand anythe
                                                                                                                 correlation
                                                                                                                     results arewith  likelihood
                                                                                                                                   shown           to
                                                                                                                                            as a box
                                      purchase     an
                                      plot (Figure 6). EV   (p  <  0.0001,  Table  6—A    22_count)   and   the results  are shown     as a box  plot
                                      (Figure 6).
      Table 6. Results from Likelihood Ratio Tests undertaken using ordinal logistic regression models with ‘Likelihood of BEV
      Table 6. Results
      purchase’  as the from Likelihood
                        response        Ratio
                                 variable. n is Tests undertaken
                                                the number         using left
                                                            of samples    ordinal
                                                                              afterlogistic regression
                                                                                    filtering,           models of
                                                                                               df is the degrees with   ‘Likelihood
                                                                                                                     freedom          of BEV
                                                                                                                               and ‘p-value’
      are the p-values
      purchase’         that havevariable.
                 as the response  been adjusted   tonumber
                                           n is the  accountof
                                                             forsamples
                                                                  multiple
                                                                         lefthypothesis   testing
                                                                              after filtering,     using
                                                                                               df is      a ‘holm’ofadjustment
                                                                                                     the degrees     freedom and[68].
                                                                                                                                    ‘p-value’
      are the p-values that have been adjusted to account for multiple hypothesis testing using a ‘holm’ adjustment [68].
                              Question                                                  n           Test Statistic         df         p-Value
              A16_Driver
                 Question Type, attitude to EVs           n                        Test731
                                                                                        Statistic       409.2 df           4
World
WorldElectr.
      Electr.Veh.
              Veh.J.J.2021,
                       2021,12,
                             12,174
                                 x FOR PEER REVIEW                                                                                                  15
                                                                                                                                                     15of
                                                                                                                                                        of27
                                                                                                                                                           27
World Electr. Veh. J. 2021, 12, x FOR PEER REVIEW                                                                                                    15 of 27

                                    Figure5.
                                    Figure 5. Mosaic
                                              Mosaic plot
                                                      plot showing
                                                           showing the
                                                                   the ratio
                                                                       ratio of
                                                                             of use
                                                                                use of
                                                                                    of online
                                                                                       online sources,
                                                                                              sources, including
                                                                                                       includingsocial
                                                                                                                 socialmedia,
                                                                                                                        media,to
                                                                                                                               tolikelihood
                                                                                                                                  likelihood
                                    Figure
                                    of     5. Mosaic
                                       purchasing a   plot showing the ratio of use of online sources, including social media, to likelihood
                                                     BEV.
                                    of
                                    ofpurchasing
                                       purchasingaaBEV.
                                                     BEV.

                                    Figure 6. Box plot showing the number of initiatives consumers were aware of for each available
                                     Figureof6.6.likelihood
                                    Figure
                                    score          Boxplot
                                                  Box   plotshowing
                                                             showing   thenumber
                                                                      the  number
                                                             of BEV purchase.       ofinitiatives
                                                                                   of
                                                                                Each   initiatives
                                                                                      box           consumers
                                                                                                   consumers
                                                                                            represents           wereaware
                                                                                                                were   aware
                                                                                                         the interquartile     offor
                                                                                                                              of
                                                                                                                            range for  each
                                                                                                                                      each
                                                                                                                                   (from    available
                                                                                                                                           available
                                                                                                                                          the 25th to
                                     score
                                    score   of
                                           of    likelihood
                                               likelihood    of
                                                            of  BEV
                                                               BEV    purchase.
                                                                     purchase.  Each
                                                                                Each  box
                                                                                      box   represents
                                                                                           represents    the
                                                                                                        the  interquartile
                                                                                                            interquartile   range
                                                                                                                           range   (from
                                                                                                                                  (from
                                    75th percentiles), the dots represent outliers and the bold line in the box represents the median     the
                                                                                                                                         the  25th
                                                                                                                                             25th  to
                                                                                                                                                  to
                                                                                                                                               score.
                                     75th percentiles),    the dots represent outliers and   the bold line in the box represents   the median
                                    75th percentiles), the dots represent outliers and the bold line in the box represents the median score.   score.
                                     5. Discussion
                                    5.
                                     5. Discussion
                                        Discussion
                                     5.1. Introduction
                                    5.1.  Introduction
                                     5.1. Introduction
                                           Morenuanced
                                           More    nuancedinsights
                                                                insights    into
                                                                         into     consumer
                                                                              consumer          behaviour
                                                                                           behaviour     thanthanmight might     otherwise
                                                                                                                          otherwise             be ascer-
                                                                                                                                         be ascertained
                                     tainedMore
                                              can   nuanced
                                                   be  gained   insights
                                                                by          into
                                                                    segmenting    consumer
                                                                                    the  market behaviour
                                                                                                  according    than
                                                                                                                 to carmight
                                                                                                                          owners’otherwise
                                                                                                                                      attitudes  be ascer-
                                    can   be gained
                                     tained   can  be   by segmenting
                                                       gained    by        the market
                                                                     segmenting     the  according
                                                                                         market        to car owners’
                                                                                                   according     to  car    attitudes
                                                                                                                          owners’        to EVs, to
                                                                                                                                      attitudes     to
                                                                                                                                                        EVs,
                                                                                                                                                     rather
                                                                                                                                                        EVs,
                                     rather
                                    than     than
                                           simply   simply
                                                     comparingcomparing
                                                                    EV ownersEV   owners
                                                                                  to driversto drivers
                                                                                               of  ICEVs.of  ICEVs.
                                                                                                             Such       Such
                                                                                                                     insights   insights    could
                                                                                                                                 could better         better
                                                                                                                                                   inform
                                     rather   than
                                     informmakers    simply
                                               policy who     comparing
                                                         makers    who       EV
                                                                          could   owners
                                                                                 take       to drivers
                                                                                        more effective    of ICEVs.
                                                                                                           actions      Such    insights    could      better
                                    policy
                                     inform    policy         could
                                                         makers    who take  more
                                                                          could     effective
                                                                                 take   more    actions to:
                                                                                               effective       raise to:
                                                                                                           actions     to:
                                                                                                                           raise awareness
                                                                                                                       awareness
                                                                                                                            raise  awareness
                                                                                                                                                   of gov-
                                                                                                                                       of governmentof gov-
                                     ernment initiatives
                                    initiatives   to  promote  to EVs,
                                                                   promote     EVs,motorists
                                                                         educate      educate about
                                                                                                 motorists    about technology
                                                                                                        technology       advances,       advances,
                                                                                                                                         and   influence and
                                     ernment initiatives
                                     influence   consumer      to  promote EVs,
                                                                preferences     and   educate motorists
                                                                                     potentially    future    about technology
                                                                                                             purchases       of EVs,     advances,
                                                                                                                                        for example      and
                                                                                                                                                          by
                                    consumer preferences and potentially future purchases of EVs, for example by using
                                     influence
                                     using        consumer
                                             written    media,  preferences
                                                                 including      and
                                                                              social potentially
                                                                                      media.        future   purchases       of EVs,    for  example      by
                                    written media, including social media.
                                     usingFirstly,
                                             written    media,   including
                                                      thisresearch
                                                           researchtested     social
                                                                      testedthethe     media.
                                                                                   concept    that
                                           Firstly, this                         concept   that  carcar  buyers
                                                                                                      buyers    areare
                                                                                                                     notnot   homogeneous
                                                                                                                          homogeneous               [57,70],
                                                                                                                                              [57,70],    al-
                                           Firstly,
                                     although    this this
                                                       was research
                                                             not  the tested
                                                                       primary thepurpose
                                                                                   conceptofthatthe car  buyersand
                                                                                                     research,     are questionnaire
                                                                                                                         not homogeneous     results[57,70],
                                                                                                                                                        pro-
                                    though this was not the primary purpose of the research, and questionnaire results provide
                                     although
                                     vide  strongthis   was notto
                                                     evidence     the  primary
                                                                    suggest       purpose
                                                                               there         of the research,
                                                                                       are differences            and questionnaire
                                                                                                          of attitude                        results    pro-
                                    strong   evidence     to suggest    there are  differences   of attitude    amongamong car buyerscar buyers      (Table
                                                                                                                                          (Table S4a,b).
                                     vide strong
                                     S4a,b).         evidence grouping
                                               Furthermore,      to suggestrespondents
                                                                               there are differences
                                                                                               byType
                                                                                                   Driver ofType
                                                                                                              attitude    among      car buyers       (Table
                                    Furthermore,       grouping respondents         by Driver           based    on based
                                                                                                                      attitude oncorrelates
                                                                                                                                   attitude    correlates
                                                                                                                                                 with the
                                     S4a,b).   Furthermore,
                                     with the variability        grouping
                                                               of EV readinessrespondents      by  Driver
                                                                                     shownrespondents        Type
                                                                                              among respondents       based    on   attitude
                                                                                                                           (i.e., likelihood    correlates
                                    variability    of EV readiness       shown among                          (i.e., likelihood      to buy a to   BEV buyora
                                     with or
                                     BEV    thePHEV
                                                 variability
                                                         in theof  EV readiness
                                                                future),             shown among
                                                                           with significant             respondents
                                                                                                differences    shown among (i.e., likelihood
                                                                                                                                     Driver Types to buy (p
World Electr. Veh. J. 2021, 12, 174                                                                                        16 of 27

                                      PHEV in the future), with significant differences shown among Driver Types (p < 0.0001,
                                      Table 3: A15_1, A15_2; Figure S11). Further analysis also shows a correlation between the
                                      likelihood of buying a BEV and Driver Type (p < 0.0001, Table 6). EV Owners, as innovators
                                      and early adopters, were most likely to buy a BEV in the future (Figure S11), and least
                                      likely to buy a PHEV (Figure S12). The likelihood of buying a PHEV was strongest for the
                                      EV Anxious, the late majority of mainstream consumers (Figure S12).
                                            Previous research suggests attitudes to EVs are an important determinant of will-
                                      ingness to adopt (Section 3.1). Based on attitudes to EVs, the segmentation of survey
                                      respondents into four Driver Types (Section 3.2.2), where commonality of attributes enables
                                      mapping against Diffusion of Innovation [58] niches (Table S2): EV Owners correspond
                                      with Innovators and Early Adopters; EV Positives with Early Majority; EV Anxious align
                                      with the Late Majority; and EV Pessimists with the Laggards.

                                      5.2. Sources of Information
                                            Our results suggest that car buyers, grouped according to attitudes to EVs, source
                                      information about cars heterogeneously (p < 0.0001, Table 3—A13; Figure 2). Although
                                      written sources were the most widely consulted by all car buyers, EV Owners significantly
                                      used them more often than other Driver Types. Further evidence from Figure 4 and Table 6—
                                      A13 (p < 0.0001) suggests that increasing use of written sources correlated with increasing
                                      likelihood to buy a BEV. Further to that, those ‘least likely’ to buy an EV, while using
                                      written sources more than other sources, had the highest ratio of being ‘not interested’ in
                                      updating their knowledge about cars (Figure 4).

                                      5.3. Media Portrayal and Influence on Attitudes to EVs
                                            New Zealanders have high levels of newspaper readership, with almost 80% reading
                                      a newspaper (across platforms) at least once a week [30]. Our results demonstrate that
                                      when updating knowledge about cars there were no significant differences among Driver
                                      Types for consultation of newspapers or car magazines (Table 3—A14_Newspapers, A14_
                                      Car Magazines). Additionally, further testing demonstrated a lack of correlation between
                                      the likelihood of BEV purchase and use of newspapers or car magazines to update a
                                      consumer’s knowledge of cars (p = 1, Table 6, Figures S16 and S17). While it may seem
                                      counter intuitive given the importance of written sources in updating knowledge of cars,
                                      an analysis of articles about cars may provide clues to a lack of influence of newspapers
                                      and car magazines on attitudes to EVs and on likelihood to buy an EV, especially for those
                                      who did read articles about cars.
                                            Our analysis of NZ’s mainstream print media (across platforms) publishing articles
                                      on cars revealed that all mastheads investigated portrayed EVs in a positive frame more
                                      often than not, between 58% and 91% of the time, with very low percentages of negative
                                      articles (Table 2). All Driver Types perceived that EVs were treated in a positive manner by
                                      the media (p < 0.0001, Table 3—A18; Table 4), but there were significant differences among
                                      Driver Types about the degree of positivity in the media’s coverage of EVs (Figure S14).
                                      Further testing suggests significant differences for how likely a respondent is to buy a
                                      BEV and how they perceive the media to portray EVs (p < 0.0001, Table 6; Figure S18).
                                      Interestingly, those most likely to buy a BEV next time they buy a car had a less rosy view
                                      of how the media portrayed EVs (Figure S18).
                                            An explanation for the lack of influence of car magazines and newspaper motoring
                                      sections may lie in the content of those articles. Many respondents read articles about
                                      EVs and, while they appreciated most articles were positive (Table 4, Figure S18), there
                                      may be asymmetric impacts on their perceptions and attitudes (Section 1). Prior research
                                      revealed that articles with a human-interest frame, by dramatizing the information, increase
                                      perceived risk of an issue, strengthen negative emotions, and highlight potential problems;
                                      although learning about the topic is simultaneously improved, it leaves an unbalanced
                                      view [71]. Some car reviews analysed in the media survey (Section 3.2.1) were written by
                                      motoring journalists and based on practical experience rather than press releases. While
World Electr. Veh. J. 2021, 12, 174                                                                                          17 of 27

                                      many NZ journalists were positive, some potentially heightened negative perceptions of
                                      EV attributes, such as battery life issues and high purchase price (e.g., an article in ‘The
                                      Press’ (https://www.pressreader.com/new-zealand/the-press/20180512/2819903781630
                                      03 (accessed on 9 February 2021)). By sowing seeds of doubt, such media articles are likely
                                      to impact attitudes more than those that are totally positive in forming perceptions about
                                      electric vehicles, as most research indicates negative messaging outweighs positivity [72],
                                      including in journalism [73]. In addition, many car buyers appeared to be aware of ‘fluff’
                                      pieces in the media, potentially discounting their content, as expressed by one interviewee
                                      (ICEV#21) ‘a lot of the times I think that the journalist writes in a way that’s going to seek
                                      approval from his audience. Yes, rather than rather than writing something that’s factual
                                      and accurate’.
                                           Our results also suggest limited influence of motoring articles in newspapers and
                                      magazines as avenues to promote EVs. An analysis of respondent’s use of online sources,
                                      including social media (Figure 5) illustrates that those most likely to buy a BEV next time,
                                      used online resources significantly more than those who were least likely to buy a BEV
                                      (p < 0.0001, Table 6—A14_online). Therefore, we contend that those developing social
                                      marketing campaigns could investigate more fully on how the group next most likely to
                                      buy an EV, the EV Positives, use online resources and social media. As Interviewee ICEV#12
                                      explained: ‘I was more looking at [online] forums where people sharing their personal
                                      experiences’ [to get information on cars]. Furthermore, newspapers and car magazines
                                      could write stories on the existence of online forums, or set up their own online forums to
                                      attract readers.
                                           That EV Owners perceived EV media articles less positively than other Driver Types
                                      may derive from EV Owners’ greater use of social media (Figure 3) and the types of articles
                                      posted there. While they were positive about EVs, they may be more attuned to journalists’
                                      treatment of EVs. The following extracts illustrate the basis of this rationale.
                                           Interviewee EV #2: ‘No, this is normally a very large bias [in the media] and there’s
                                      often not enough actual research taking place’. ‘I have friends who are totally confused
                                      now’ [by claims in the press about petrol-hybrids being self-charging due to regenerative
                                      braking]. ‘My Facebook feed often has stuff on there. The guys in a lot of the Facebook
                                      groups, which is where I saw your article [request for participation in survey], they often
                                      post up information on there as well’.

                                      5.4. Perceptions of EVs as Expensive
                                           Despite the Positives, Anxious, and Pessimists being more likely to perceive the media
                                      portrayed EVs positively, it did not eliminate ‘expensive’ as a significant perception about
                                      EVs (Table S9; Figures S2–S4).
                                           Additional results (Table S10: Questions A17 and Table S8a) suggest a major hurdle
                                      impeding EV purchase in NZ was the perceived lack of affordability, especially the higher
                                      purchase price for new EVs and concerns about battery longevity, which affects total costs.
                                      A typical opinion about affordability was from Interviewee ICEV#29: ‘They are starting to
                                      take off in the country, but I just can’t justify it yet because they are too expensive.’
                                           This perception could be expected, as in reality new EVs sold in NZ are more expensive
                                      than similar model ICEVs and the media frequently reported about luxury imported EVs,
                                      such as Jaguar and Tesla [74]. Furthermore, most EV Positives (80.5%) wrote they would
                                      be more likely to buy an EV if they were cheaper to buy (Table S8a), providing evidence
                                      of their perceptions of expense. As more than half the car buyers bought second-hand
                                      cars (Table S3) and ICEV buyers had low awareness of the availability of second-hand EVs
                                      (Table 5), which are cost effective options [75], the media could play a wider role in writing
                                      more about budget conscious options helping foster a change in ICEV owners’ perceptions.
                                           ICEV drivers had quite different perceptions of EV affordability than EV Owners,
                                      who did not perceive EVs as ‘expensive’ as did other Driver Types (Table S9, Figure S1).
                                      Such a difference could stem from EV Owners’ practical experience and greater overall
                                      level of research about cars (Figure S5) and use of written sources (Figure 2), and they
You can also read