Electric Vehicles Impacts on New Zealand's Electricity System Technical Report - University of Canterbury
←
→
Page content transcription
If your browser does not render page correctly, please read the page content below

new zealand centre for advanced engineering

             Electric Vehicles
                       Impacts on New Zealand’s
                          Electricity System

                                  Technical Report

                                          December 2010

Mail: Private Bag 4800, University of Canterbury Campus, Christchurch 8140, New Zealand
Street Address: 39 Creyke Road, Ilam, Christchurch, New Zealand
Phone: 03 364 2478 Fax: 03 364 2069 e-mail: info@caenz.com www.caenz.com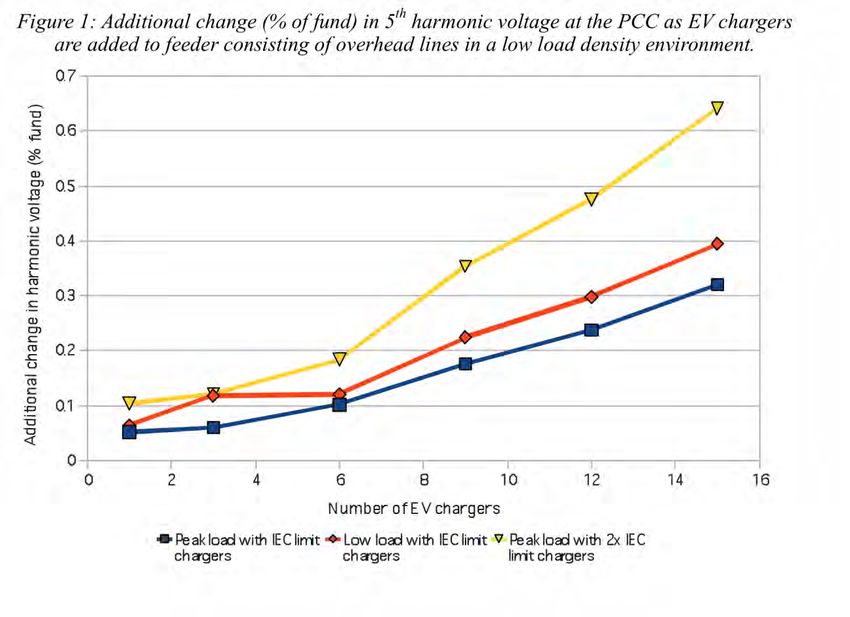
Electric Vehicles

Impacts on New Zealandʼs Electricity System

            Technical Report
             December 2010
Electric Vehicles

      CAENZ is an independent-think tank and research facilitator funded by grants and
 sponsorships. CAENZʼs mission is to advance social progress and economic growth for New
 Zealand through broadening national understanding of emerging technologies and facilitating
                     early adoption of advanced technology solutions.

                                        www.caenz.com

Contributors:   John Duncan (vehicle uptake and usage modelling and editor),
                Tom Halliburton (transmission and generation system modelling),
                Bill Heffernan (battery technology)
                Dr. Stewart Hardie (distribution system modelling)
                Prof. Neville Watson (distribution system modelling)
                Glenn Coates (distribution system design and operation)

This report has been prepared by the New Zealand Centre for Advanced Engineering (CAENZ).
The Centre gratefully acknowledges the support and sponsorship of Transpower, The Electricity
Commission and Orion, which made this study possible.

No liability is accepted by the Centre or any employee or sub-consultant of the Centre with
respect to its use by any other parties. This disclaimer shall apply notwithstanding that the
report may be made available to other persons for an application for permission or approval to
fulfil a legal requirement.

 VERSION        DESCRIPTION       AUTHOR                    CAENZ APPROVAL            DATE

 1.0            Draft             Name: John Duncan         Name: Scott Caldwell      29/4/10

 2.0            Review &          Name: John Duncan         Name: Scott Caldwell      11/5/10
                Modification

 3.0            Issued for Use    Name: John Duncan         Name: Scott Caldwell      30/6/10

December 2010                                                                             Page 2
CONTENTS

CONTENTS
CONTENTS .................................................................................................................................. 3

Executive Summary ...................................................................................................................... 5

   1 Electric Vehicle Availability..................................................................................................... 5

   2 Battery Charging .................................................................................................................... 5

   3 Electricity Supply .................................................................................................................... 6

   4 Distribution Impacts................................................................................................................ 7

   5 Carbon Dioxide Reduction ..................................................................................................... 7

1 Introduction ................................................................................................................................ 9

   1.1 Status of Electric Vehicle Technology ................................................................................. 9

   1.2 Approach........................................................................................................................... 10

   1.3 Acknowledgements ........................................................................................................... 12

   1.4 Acronyms .......................................................................................................................... 12

2 Outlook for EV Commercialisation ........................................................................................... 15

   2.1 Battery technology: cost and performance........................................................................ 15

   2.2 Electric Vehicle Availability................................................................................................ 17

   2.3 Support Infrastructure........................................................................................................ 19

   2.4 PHEVs versus BEVs ......................................................................................................... 19

3 Driving Patterns and Vehicle Charging Options ...................................................................... 21

   3.1 Daily Driving Distances ..................................................................................................... 21

   3.2 Trip Purpose and Vehicle Parking..................................................................................... 22

   3.3 Vehicle Charging Options ................................................................................................. 26

   3.4 Night Battery Charging ...................................................................................................... 27

4 Electric Vehicle Uptake Scenarios ........................................................................................... 31

   4.1 Studies Reviewed.............................................................................................................. 31

   4.2 Electric Vehicle Uptake Scenarios .................................................................................... 32

   4.3 Fleet Model ....................................................................................................................... 33

   4.4 Vehicle Charging Assumptions ......................................................................................... 35

December 2010                                                                                                                          Page 3

Electric Vehicles

5 Impact of Electric Vehicles on Distribution Networks ...............................................................37

   5.1 Distribution Network Characteristics..................................................................................38

   5.2 Electric Vehicle Charger Model .........................................................................................39

   5.3 Harmonic Effects ...............................................................................................................40

   5.4 Voltage Drop Effects and Network Load ...........................................................................43

6 Effects of Electric Vehicle Charging on Power System Development......................................45

   6.1 Generation System Analysis .............................................................................................45

   6.2 Key Assumptions from the Energy Outlook Reference Case............................................45

   6.3 Representation of Load and Time .....................................................................................46

   6.4 Modelling Electric Vehicle Charging Loads .......................................................................48

   6.5 Typical Load Patterns........................................................................................................49

   6.6 GEM Model Results...........................................................................................................50

7 Vehicle – Grid Interface............................................................................................................55

   7.1 Controlling Electric Vehicle Charging ................................................................................56

   7.2 Effects on Power System Reserve Requirements.............................................................57

8 Carbon Dioxide Emissions .......................................................................................................61

   8.1 Power System Emissions ..................................................................................................61

   8.2 Vehicle Tailpipe Carbon Dioxide Reductions ....................................................................62

Appendix 1: GEM Model Details .................................................................................................65

Appendix 2: Power System Reserves Requirements ................................................................67

December 2010                                                                                                                   Page 4
Executive Summary

Executive Summary
Electric Vehicle Availability

A number of vehicle manufacturers have commenced production of battery (BEV) and plug in
hybrid (PHEV) electric vehicles on a relatively small scale. Whilst these vehicles have limited
appeal in the present mass markets compared to conventional internal combustion (ICE) or
hybrid (HEV) vehicles because of high costs and performance limitations, anticipated
improvements in battery technology and costs of manufacture indicate that electric vehicles will
emerge as genuine contenders as high energy efficiency, low emissions alternatives to other
road transport technologies:

    •   The key constraint to electric vehicles is the high cost and low energy density of the
        batteries. Batteries typically comprise over half the cost of BEV models and weight and
        cost compromises typically limit their range to 160 km. Similarly, PHEV “electric only”
        operation is generally limited to 10 to 60 km.
    •   Battery performance is continually improving and, with the focus now on lithium-ion and
        potentially lithium sulphur technologies, the barriers imposed by capital cost and limited
        range are expected to erode with time. The time when electric vehicles can be fully
        competitive in the mass markets is open to speculation but most studies reviewed
        anticipate costs of electric and conventional vehicles to converge in about 2030, when
        the former will assume a significant share of the new vehicle market.
    •   Initially PHEVs are expected to be the favoured electric vehicle technology but BEVs
        are expected to predominate as battery performance and costs improve, as they are a
        simpler and cheaper technology.
    •   Volume of sales of electric vehicles into the New Zealand market will be the primary
        determinant of the electricity requirement to power them. Technical factors, such as
        vehicle energy efficiency and battery charging efficiency, have limited scope for
        improvement over current benchmarks, even during the 30 year period of this study.
        Given the uncertainties regarding their commercialisation, electricity consumption at
        different levels of uptake of electric vehicles have been investigated, ranging from 50%
        to 80% of light vehicles entering the New Zealand fleet in 2040.

Battery Charging

The ability to charge batteries outside periods of peak electricity demand will significantly reduce
the electricity generating capacity required to service the electric vehicle market. Technology is
available to charge vehicles at home or in public places and is unlikely to impose any constraint
on electric vehicle market development:

    •   Private vehicles are used on average 39 kilometres per day and, with a median
        distance travelled of 23.2 km per day, a disproportionate amount of total vehicle
        kilometres travelled (VKT) can be apportioned to a relatively small number of vehicles.
    •   Batteries can be charged at home at an input of 2kW with no modification to household
        single phase wiring, and up to 5kW with the installation of a heavy-duty circuit from the
        household switchboard. At 5 kW, electricity to travel the average vehicle distance
        travelled would be delivered in about 1.5 hours. Above this, three-phase supply will be
        desirable and “fast fill” technology is being developed for commercial and public
        application with battery inputs in the order of 78 kW.
    •   More than 90% of vehicles are parked between 10 pm to 6 am weekdays (80% from 6
        pm to 10 pm) at home, mainly on residentsʼ property, indicating a large number of
        vehicles can be charged overnight in a safe environment whilst demand for other
        electricity uses is relatively low.

December 2010                                                                                Page 5
Electric Vehicles
• Not all electricity demand from electric vehicles can be delivered overnight. In some
cases cars will not be parked in secure locations and household charging rates and
battery capacity may not be sufficient to provide electricity for the following dayʼs travel
for high use vehicles. Whilst relevant at present, the battery capacity limitations will
become insignificant should battery technology improve as anticipated. Charging rate
constraints would be significant with 2 kW chargers but considerably less so at 5 kW. It
is estimated that up to 85% of daily electricity requirements could be delivered overnight
at the higher charging rate once the battery capacity limitations are overcome.
• Any shortfall between total electricity demand and charging at night must be undertaken
during the daytime. There are several opportunities for this: 40% of vehicles are parked
at home at any time during week days and about 30% at work as well as public
charging facilities including “fast fill” technology under development.
• There are a number of regimes that could be applied to EV charging and it is important
that the complexity and cost of the regime is appropriate for the problem being resolved.
The timing of various approaches such as smart chargers, ripple control, two-way
communications and smart meters with real time pricing will be dependent on the
uptake of EVʼs and the pace at which smart network initiatives become economic in NZ.
The disaggregated nature of the NZ electricity sector creates challenges (that must be
addressed) to implementing coordinated demand side management and smart EV
solutions.
Electricity Supply
The impact of electric vehicle charging on the electricity generation system over the next thirty
years is likely to be relatively small given that the electricity demand from vehicles is estimated
to be no more than 8% of total demand by 2039 for the most optimistic scenario of electric
vehicle uptake investigated. Additional generating capacity required can be reduced
significantly by charging electric vehicles during off peak hours, particularly when parked at
private residences overnight. This has been illustrated by the 80% Uptake Scenario, a rapid
uptake of electric vehicles:
• Undertaking 85% of battery charging during shoulder and off-peak hours and no
charging during the 35 annual “super peak” hours results in significant savings in
generation system costs compared to uniformly spreading the charging load - a 19%
saving for this scenario.
• Additional non-schedulable generation is made economic by the use of off-peak and
shoulder hour battery charging. This results in a significant amount of additional wind
capacity being added to the system, with smaller amounts of hydro, marine and
biomass.
• By displacing some fossil fuelled peaking plant due to additional non-schedulable
renewables becoming economic, total CO2 emissions from the power system are
reduced, despite the increased load.
• By 2025, over 390,000 electric vehicles are in use under this scenario, but total
additional generation capacity has not exceeded 180 MW.
• Assuming 15% of charging occurs randomly, including over the super peak hours, has
no significant effect on the average cost of generation, but might have some effects in
transmission and distribution systems.
• Electric vehicle charging is a load that can be interrupted and offers potential to reduce
reserve capacity requirements to meet peaks and to provide the required reserve
margin. The traditional form of load control in New Zealand has been the ripple control
system, still used by some lines companies to reduce peak loads. Multiple ripple
control channels could be used to progressively switch chargers as necessary. Ripple
December 2010 Page 6Executive Summary
control is inherently a unidirectional system, so some form of “smart” bidirectional
communications would be of benefit eventually, allowing individual premises and
chargers to report on current state of charge.
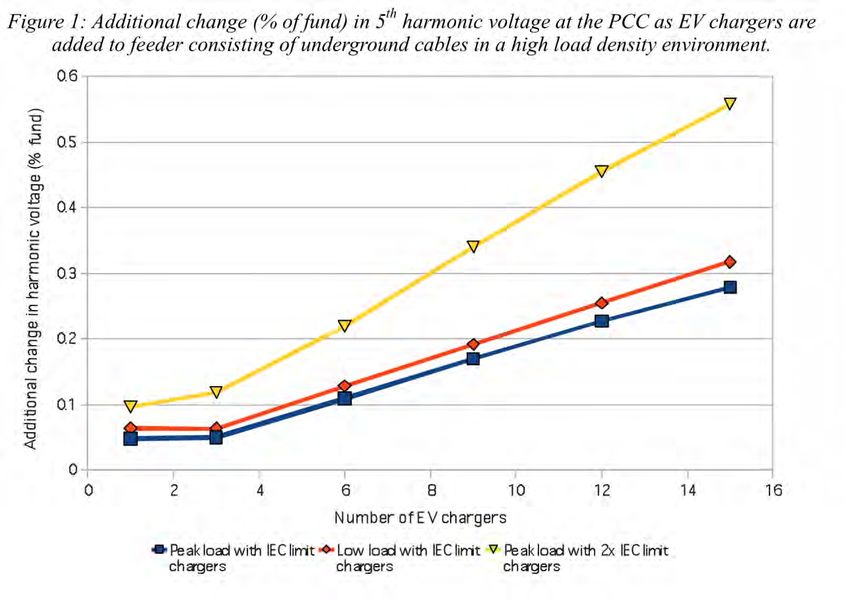
Distribution Impacts
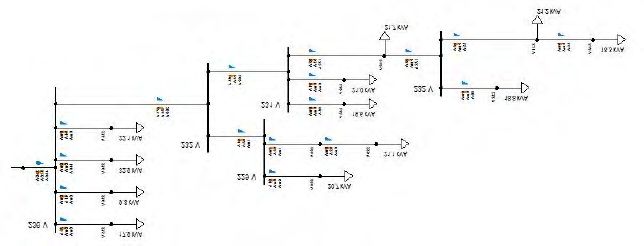
Local electricity distribution networks supplying to residential neighbourhoods are likely to be
impacted by the simultaneous operation of battery chargers if there is widespread use of electric
vehicles. A limited analysis of harmonic voltage effects and voltage drop for typical load low-
density overhead and high-density underground residential feeders, supplying 75 homes
1
respectively , indicates:
• That harmonic distortion would exceed current standards if more than 40% of
households were simultaneously operating chargers at the rated 5kW output.
• The impact could worsen rapidly if the chargers have lower harmonic diversity or
exceed the IEC 61000-3-2 Class A standard assumed in the study.
• Higher power rated EV chargers will have a near proportionate effect on harmonic
levels. For example, the voltage THD for 5kW chargers is likely to be approximately
67% higher than for 3kW chargers.
• There is a range of additional power quality issues that are likely to occur with high
levels of chargers operating that require further analysis that were outside the scope of
this report.
Carbon Dioxide Reduction
One of the primary benefits of utilising electric vehicles is the associated reduction in carbon
dioxide emissions due to the reduced consumption of hydrocarbon fuels by conventional
vehicles displaced by electric vehicles. The reduction of these tailpipe emissions may be offset
by increased consumption of hydrocarbon fuels during the generation of electricity to supply the
electric vehicles. This analysis indicates there may be a significant reduction in total carbon
dioxide emissions:
• In the 80% Uptake Scenario there is a reduction in total electricity generation system
emissions of 0.68% if charging times are controlled. This somewhat counter-intuitive
result is achieved by the flattening of the power system load curve, which favours the
construction of renewable technologies in place of fossil fuel plants. However, the
differences in emissions are small and depend on the level of control. With uncontrolled
charging, across all hours of the day, an increase in emissions of 0.32% occurs over the
30 year study period.
• Reduction in tailpipe emissions will depend on the uptake of electric vehicles and the
type of vehicles displaced by electric vehicles. The displacement of HEV or diesel
vehicles will result in a smaller reduction in emissions than the displacement of
conventional petrol vehicles of similar size and usage. The scale of reductions range
from over 3 million tonnes of CO2 per annum in 2040 for the 80% Uptake Scenarios to
1.5 million tonnes for the lowest scenario investigated. These reductions could be
diminished by about 0.5 million tonnes if the electric vehicles were to displace HEVs
rather than conventional petrol vehicles.
1
Operation conditions assumed to be each house had a normal load of 2 kW (PF=0.97), approximating winter early
morning (1 – 4 am) loading, as an optimal time for residential battery re-charging.
December 2010 Page 7Electric Vehicles
• Overall the tailpipe emissions reductions are significantly greater than the changes in
carbon dioxide emissions from electricity generation. Over the 30 year study period, the
cumulative tailpipe emissions reduction in the 80% Uptake Scenario will be in the order
of 30 million tonnes compared to a reduction of less than one million tonnes in the
power system.
December 2010 Page 81 Introduction
1 Introduction
Electric vehicles (EVs) have emerged as genuine contenders as high-energy efficiency, low
emissions alternatives to conventional internal combustion vehicles, which have totally
dominated road transport for the last century. In the longer term they will compete with such
technologies as biofuels, hydrogen and fuel cells in the diversification away from oil fuels and
the continuing objective of reducing environmental impacts, in particular the reduction of carbon
dioxide emissions from the transport sector, to date a largely intractable problem in the drive to
reduce greenhouse gas emissions.
Compared to the other alternative transport fuels options, electricity already has an established
supply system in New Zealand with a fully integrated system of generation, transmission and
distribution. Supplying electricity to vehicles will place additional demands on each of these
components but not necessarily in proportion to the additional energy consumed, particularly as
much of the electric vehicle battery charging can be undertaken during periods of relatively low
electricity demand and battery charging is potentially a controllable load. The objective of this
study is to investigate the impacts of electric vehicles on electricity supply and identify when
these impacts might become significant.
CAENZ has a long-running interest in the supply of energy to the New Zealand economy and
the development and resilience of the countyʼs infrastructure. Electric vehicles will impact on
both these interests. As yet no independent study of the supply-side issues relating to electric
vehicles has been made public. This report is a first step in providing this information and, as
such, is not intended to promote electric vehicles but rather to provide some substance to the
debate regarding future transport fuels options.
The paucity of public information is partly due to the small number of electric vehicles in
operation today and their anticipated slow uptake as they gradually become economically
competitive with conventional vehicles. It is commonly held that electricity supply will not be a
constraint to the use of electric vehicles in that the gradual uptake of electric vehicles over the
next ten years at least will allow the electricity supply industry to adapt in turn. This report does
not dispute this view but sets out to identify where this adaptation will take place and what
issues and opportunities will arise during the process. It does not address the comparative
economics of operating electric and conventional vehicles but uses different electric vehicle
uptake scenarios based on other studies to place electricity demand from transport into the
context of the otherwise expanding electricity market.
1.1 Status of Electric Vehicle Technology
Electric vehicle technology is not new in principle and has been developing on a number of
fronts:
• Battery-powered vehicles (BEVs) have been available for some time and used
commercially in specialist applications such as small urban delivery vehicles and
forklifts where low noise and emissions are important features. Compared to
conventional road vehicles and other electric vehicles described below, BEVs are
mechanically very simple as most electric motors, unlike internal combustion engines,
deliver full torque from rest over a wide engine speed range, allowing them to be
controlled without the need for multiple gears. However, their performance is
constrained by the cost, weight and comparatively low energy density of the lead-acid
and nickel-metal hydride batteries used to drive the electric motors and they have had
very limited appeal to the wider motoring public. The Californian zero emissions
mandate in the 1990s stimulated interest in the commercialization of EVs but resulted in
only a small number of sales for similar reasons. “Range anxiety”, or the limited range
of electric vehicles compared to conventional vehicles arising from the low energy
density of the batteries, is a major constraint to their commercialisation.
December 2010 Page 9Electric Vehicles
• Hybrid electric vehicles (HEVs) have been successfully commercialized in the 2000s by
a number of vehicle manufacturers. These vehicles integrate combinations of internal
combustion engine, generator, storage battery and electric motor to optimize engine
size and operation, thereby significantly increasing energy efficiency. The operation of
the electric motor complements that of the internal combustion engine with no specific
“electricity only” operation. Batteries used in HEVs are relatively small compared to
2
those in electric vehicles and nickel-metal hydride battery technology is generally used.
HEVs are powered by petrol or diesel only as all the electricity used to drive the electric
motor is generated by the internal combustion engine. Consequently HEVs are not
generally classified as electric vehicles but as highly efficient conventional petrol or
diesel vehicles.
• Battery technology has been a major constraint in developing marketable EVs. Batteries
have low energy density compared to petrol and diesel, are very expensive and have
limited capability in terms of power delivery and number of recharge cycles during their
useful life. However, there have been significant improvements in recent years as
manufacturers have shifted from traditional lead-acid batteries to nickel-metal hydride
used in hybrids and latterly to lithium-ion batteries which are now the future focus for
both HEVs and electric vehicles. Lithium-ion batteries have superior power and
recharging capabilities and, according to most sources, superior energy density than
their nickel-metal hydride counterparts. There is considerable optimism that their cost
and energy density can be significantly improved in the future. Lithium-ion is a generic
term but the batteries usually have a carbon anode and have a number of cathode
variants, including cobalt dioxide, nickel-cobalt-manganese, manganese oxide and iron
phosphate, each providing a different mix of cost, durability, performance and safety.
The cobalt dioxide variant is commonly used in cellphone and portable computer
batteries.
• A number of vehicle manufacturers are introducing plug-in hybrid electric vehicles
(PHEVs). These are variants of HEVs but with a larger battery which can be recharged
from an external electricity source, effectively making them bi-fuel vehicles, fuelled on
both petrol and electricity. Batteries and electric motors are sized on the distance and
speed the vehicle can be driven on electricity alone before the internal combustion
engine is required to provide additional power for higher speeds and to recharge the
3
battery . The drive train configuration is thus a trade-off between the higher costs and
weight of larger electric motors and batteries and the distance and speed the vehicle
can operate using battery electricity only. Typically, this distance is somewhere near
average commuting distances, for example the GM Volt is designed to operate for 40
4
miles on electricity only , although the prototype Toyota Prius is being designed for
about ten miles electric-only operation because of concerns about the costs of the
additional battery capacity. Both the Volt and Prius PHEVs have lithium-ion batteries.
Range anxiety is not an issue with PHEVs as the vehicle can continue to operate on
petrol once the electricity charge has been used up.
1.2 Approach
To investigate the impact of electric vehicles on the electricity supply system, it is necessary to
overlay the electric vehicle demand for electricity over the increasing demand for electricity in
other sectors. This requires an estimation of the level of uptake of electric vehicles over time
and the associated electricity requirement to power these vehicles.
2
The battery capacity of the newer Toyota Prius HEV models is 1.3 kWh.
3
The electric motor delivers high torque at low speed, making it ideal for accelerating from a stationary position.
4
With a 40 mile electric-only range, the Volt is designated a PHEV-40 vehicle.
December 2010 Page 101 Introduction
A generation expansion model is used to determine the new electricity generation capacity
required to meet electricity demand and to compare it with the likely capacity expansion with no
electric vehicle uptake. An important factor in determining generation capacity requirements is
the impact of charging electric vehicles on peak electricity demand and whether vehicle
charging coincides with peak demand for other electricity uses. This necessitated a review of
New Zealand driving patterns and where and when vehicles are likely to be located for battery
charging.
There is considerable uncertainty and debate as to the rate of future uptake of electric vehicles.
Commercialisation will depend on a number of inter-related factors including the future
development and economics of electric vehicle technologies. Consequently, four uptake
scenarios have been developed based on other electric vehicle studies, none of which
investigated the electricity supply-side impacts in any detail. The steps taken in carrying out this
study are summarized as follows:
• Electric vehicle technology was reviewed to ascertain the availability and performance
of electric vehicles and their potential commercialization and rates of electricity
consumption.
• Vehicle driving patterns were reviewed to determine likely electric vehicle usage and
identify possible options for the location and timing of battery charging. This review was
based primarily on data developed by Ministry of Transport surveys.
• Electric vehicle uptake and charging scenarios were developed to determine future
demand for electricity and options for battery charging at different power ratings and
times of day. Electricity demand was determined using a simplified fleet model.
• The impact of battery charging on electricity distribution company overhead and
underground feeder lines was analysed, evaluating harmonic voltage effects and the
voltage drop along feeder lines.
• The four electric vehicle scenarios were evaluated in the generation expansion model
and compared to a base case with no electric vehicles over a 30 year time frame.
Primary outputs were the changes in the capacity and type of new generating plant,
consumption of fossil fuels, relative costs of generation and any impact on the electricity
transmission network.
• Battery charging technology was reviewed and the potential to utilize vehicle charging
as a controllable load in the electricity supply system discussed.
• The potential changes in carbon dioxide emissions from fossil fuels used in electricity
generation and conventional vehicles displaced by electric vehicles were estimated.
December 2010 Page 11Electric Vehicles 1.3 Acknowledgements Dr Phil Bishop at the Electricity Commission assisted with the installation of the GEM model for use in these studies, and provided a great deal of help in explaining the equations solved, and processes to be following when preparing data and running the model. Mark Deane at the Ministry of Economic Development made available a copy of the Energy Outlook database for the GEM model used as the basis for the studies carried out. Sarah Wheaton and Linley Povey at the Ministry of Transport for providing data and interpretation from the Ministryʼs Fleet Model and Ongoing Household Survey. The Electric Power and Engineering Centre (EPECentre) at the University of Canterbury assisted with the modelling of the distribution system effects. 1.4 Acronyms A Ampere Adc Ampere direct current BEV Battery (only) Electric Vehicle CNG Compressed Natural gas CO2 Carbon Dioxide dc Direct Current EIA Energy Information Agency (of US Department of Energy) EPEC Electric Power Engineering Centre EV Electric Vehicle GEM Generation Expansion Model GWh Giga Watt-hour HEV Hybrid Electric Vehicle ICE Internal Combustion Engine kg Kilogram km Kilometre kWh Kilo Watt-hour LFP Lithium Iron Phosphate LV Low Voltage MCB Miniature Circuit Breaker MED Ministry of Economic Development December 2010 Page 12
1 Introduction

MW     Mega Watt

MoT    Ministry of Transport

PQ     Power Quality

PCC    Point of Common Coupling

PHEV Plug-in Electric Vehicle

SUV    Sport Utility Vehicle

THD    Total Harmonic Distortion

V      Volt

VA     Volt-Ampere

VKT    Vehicle Kilometres Travelled

Wh     Watt-hour

December 2010                              Page 13
Electric Vehicles

December 2010           Page 14
2 Outlook for EV Commercialisation

2 Outlook for EV Commercialisation
Despite the progress being made in the development of EV technology, there remain significant
constraints to its commercialization in the short term, particularly in respect to BEV technology.
Opinion is divided as to if and when and under what circumstances these constraints may be
resolved so there is no consensus as to the probable timing and size of the uptake of electric
vehicles. The key constraints as identified at this stage in the development of electric vehicles:

2.1 Battery technology: cost and performance

The high cost and low energy density of EV batteries remain fundamental constraints to EV
commercialisation although there is considerable optimism that these will be largely resolved in
the longer term, for a significant sector of the automobile market at least. Already there has
been significant progress in increasing battery energy density as illustrated in the following
diagram:

                                                  5
Figure 1: Battery Energy Density Trend

Lithium-ion batteries currently have an energy density by mass of about 100Wh/kg and, with
BEV batteries weighing in the order of 150 to 250 kg, typical battery capacities are in the range
                 6
of 15 to 25 kWh . At the higher end, the BEV Tesla Roadster has a battery weight of 450 kg
and, with a stated energy density of 118 Wh/kg, a battery capacity of 53 kWh.

5
  Response to the CARB ZEV Expert Panel Position on Lithium-Ion Full-Performance Battery Electric Vehicles, Andrew
Simpson, Tesla Motors Inc., March 2008
6
  Economic Viability of Electric Vehicles, AECOM Australia Pty Ltd, September 2009

December 2010                                                                                            Page 15
Electric Vehicles
The performance of the various battery technology options is summarized:
• Nickel-metal hydride: a stable and mature technology with typically long life times. They
have a relatively low charging efficiency (70%) but with energy densities of up to 80
Wh/kg. These batteries are used in current HEVs but are likely to be superseded by
lithium-ion technology.
• Lithium cobalt dioxide (LiCoO2) and lithium manganese oxide (LiMn2O4): are earlier
versions of lithium ion technology, the former used widely in portable consumer
electronics. It has a relatively high power density but poses significant safety (oxidation,
fire) and durability (reduced capacity with time) concerns for the larger batteries used in
electric vehicles. The battery is normally a series combination of individual cells (or a
series combination of paralleled cells) making up the EV bus voltage (typically around
300Vdc nominal). Failure of one cell can cause its neighbours to combust, igniting the
whole pack almost instantly. Only Tesla appears to be using this technology in electric
vehicles, incorporating safeguards to ensure a failure in one cell does not ignite its
neighbours. Lithium manganese oxide has higher power and lower cost than cobalt but
a lower energy density.
• Lithium iron phosphate (LiFePO4/LFP): is a more recent lithium-ion variant, finding
favour due to its stability and safety and the relatively low cost of the compound. It is
suitable for large batteries for electric vehicles where safety is a key consideration as it
can fail without overheating. LFP batteries have an energy density by mass of just
under 100Wh/kg. They have a longer lifetime and peak power rating compared with
traditional lithium-ion batteries but up to 60% lower power density.
• Lithium Titanate: a lithium-ion battery with lithium titanate on the anode surface instead
of carbon, providing greater surface area and hence faster charging than traditional
lithium-ion. A strong candidate for EV storage.
• Lithium sulphur (LiS): is attracting considerable attention for use in electric vehicles
because of its potentially high energy density due to the low atomic weight of lithium
and the low cost of sulphur. Its chemistry differs significantly from lithium-ion batteries
having a lithium anode and sulphur cathode, the latter generally mixed with carbon to
enhance conductivity. LiS batteries may be able to achieve 350Wh/kg energy density
but some safety concerns have yet to be solved, possibly with quality charging control.
• Sodium sulphur (NaS): analogous to LiS but operating temperatures over 300 °C
making them unsuitable for electric vehicle electricity storage. They have high energy
7
density, long cycle life and high charge and discharge efficiency (90%) .
With lithium iron phosphate and lithium titanate batteries beginning to offer safe and usable
battery options,, it is likely that the next generation of batteries will combine high safety,
reliability and energy density, giving electric vehicles lower battery costs or greater capacity and
hence range, or most probably a combination of both, and will require more electrical energy to
fully charge. In the longer term, and provided safety issues can be resolved, the high energy
density of LiS battery technology suggests it is not unreasonable to postulate that electric
vehicle stored energy capacity may double, triple or even quadruple over the next 5, 10 or 20
years.
7
Whilst charging efficiencies of the different battery technologies differ, a consistent set of comparative data for future
performance of all technologies is not readily available. A 90% charging efficiency is probably conservative for
determining future electricity demand in this study.
December 2010 Page 162 Outlook for EV Commercialisation
2.2 Electric Vehicle Availability
Following the success of HEVs and improvements in battery technology, a number of
manufacturers have started or have plans for imminent production of electric vehicles, in both
the BEV and PHEV format. There are common inter-related features to all models:
• They are expensive compared to their petrol or diesel vehicle counterparts due to the
cost of batteries, the relatively small scale of production and, in the case of PHEVs, the
complexity of the vehicle drive train.
• Scale of production is small because of the high cost of the vehicles and uncertain
purchasing response of the wider motoring public.
• Vehicle range for BEVs between recharging is small relative to petrol and diesel
vehicles because of the low energy density of current battery technology. Electric-only
range of PHEVs is limited by the size, weight and cost of the additional battery capacity.
The following table summarises surveys of electric vehicle manufacturing undertaken during two
8
recent studies . In the context of the total automobile market, these developments are small but
represent significant confidence in electric vehicle technology.
Table 1: Electric Vehicle Models
The same studies estimate the future costs of electric and conventional vehicles. Electric vehicles
presently are at least 50% to 100% above those of their petrol engine counterparts, primarily due to
the small scale of production of electric vehicles and the high costs of battery manufacture. Batteries
presently cost about US$1,000 per kilowatt-hour or typically over half of the cost of manufacturing a
BEV. In the case of PHEVs, this proportion will depend on the designated electric-only operation but
will be less than that of a BEV because of the latterʼs simpler drive train and the smaller battery size
generally fitted to PHEVs. There is general agreement that this battery cost can be substantially
reduced through higher volumes and better production methods, more conservatively estimated by
two thirds in 20209. Other sources predict that costs will eventually fall below US$200 per kilowatt-
hour and, combined with the benefits of mass-producing complete vehicles, will bring the cost of
electric vehicles in line with conventional vehicles in 203010.
8
op cit AECOM and “National cost-benefit assessment of the early uptake of electric vehicles in New Zealand —
Methodology, assumptions and results”, Hyder Consulting (NZ) Limited
9
John German, International Council for Clean Transportation
10
op cit Aecom, op cit Hyder
December 2010 Page 17Electric Vehicles
The convergence of the cost of electric and conventional vehicles is an important indicator of
the uptake of electric vehicles as the majority of buyers look for a quick payback on additional
vehicle capital costs when evaluating alternative fuel options:
• During CNG programmes both in New Zealand and offshore, private motorists and
owners of commercial passenger cars such as taxis often looked for paybacks on
capital costs of conversion of less than one year.
• In the United States, paybacks on the most popular hybrid, the Toyota Prius, have
11
ranged between about 3.5 and 6 years over the last two years and sales of hybrids
are generally less than 3% of total vehicle sales, indicating that the level of savings from
the improved fuel economy is only attractive to a relatively small number of motorists
travelling significantly greater than average distances or to technology “early adopters”.
• In New Zealand, Toyota sold 386 Prius in 2008 compared to over 15,000 ʻNew Zealand
12
newʼ car models , with a payback of some six years compared to a Camry, suggesting
that the differential in purchase cost should be substantially reduced below the current
level of $6,000 to achieve a substantial market share.
• Whilst the fuel cost saving between an electric vehicle and a conventional vehicle is
13
anticipated to be greater than that for an HEV like the Prius (55% compared to 45%),
the difference is not so great to sustain a significant purchase price premium. It is
anticipated therefore that electric vehicles will only achieve a significant market share
when their purchase price approaches that of conventional vehicles. Fuel cost savings
for electric vehicles in 2040, at the end of this study period, will remain about the same
14
if there is some increase in ICE efficiency as is generally predicted . However, the
saving will fall to below 30% if the typical “conventional” vehicle at that time should be a
hybrid petrol vehicle
The availability and competitiveness of electric vehicles will be a balance between the demand
for vehicles and manufacturing capacity. Vehicle price will influence demand and will be
influenced by the scale of manufacturing and advances in battery technology. Major expansion
of capacity will be required before electric vehicles become competitive and may be accelerated
15
by subsidies for resource, climate change or other environmental benefits but expansion is
likely to be erratic as supply catches up with demand especially in the next few years if demand
remains small. If and when electric vehicles become a significant part of the national vehicle
fleet remains conjecture but it is not unreasonable, given the advancing state of technology, that
this could be the case in twenty years time.
11
Based on an average annual distance of 15,000 miles and fuel consumption data listed in the US DoE/EPAʼs Fuel
Economy Guide, 2009. The payback will vary with the prevailing prices of petrol and the listed prices of the hybrid and
conventional vehicle, in this case a Camry 2.4 litre saloon.
12
NZ Transport Agency. The New Zealand payback on the Prius is about six years compared to the Camry based on
current Toyota list prices (www.toyota.co.nz), current petrol prices and average distance travelled of 12,235 km pa.
13
Fuel cost including RUC. Whilst EVs are currently exempt RUC to promote their use, it is probable that this
exemption will be revoked once they become cost competitive with ICE vehicles. If RUC is excluded, the fuel cost
saving is about 75% at current prices.
14
Assuming an oil price of US$120/barrel and wholesale electricity prices increasing 1.6% pa through to 2040. See
Section 7 for assumptions on energy prices used in the study.
15
Climate change benefits (reductions in CO2) will not be the same in all countries as they depend on the type of
electricity generation used to charge the vehicles. China for example, with a preponderance of coal-fired generation,
will achieve relatively low benefits. Even in this case, it is possible that the addition of the potentially controllable
battery-charging load will facilitate greater penetration of non-dispatchable renewable energy generation, such as wind
power.
December 2010 Page 182 Outlook for EV Commercialisation
As a very small market, New Zealand is likely to have a very limited impact on driving these
developments. Policies such as subsidies may advance the uptake of electric vehicles here
but, without an indigenous automobile industry, mass availability of electric vehicles and major
technical advances will be dependent on developments in large overseas markets and policies
adopted in other jurisdictions.
2.3 Support Infrastructure
The road transport sector involves a wide network of supply and service industries, including
fuel and lubricant supplies; new and second-hand vehicle sales; parts, battery and tyre supplies;
vehicle testing; servicing and repair of vehicle mechanics and bodywork; and the training of
technicians. All these activities are well established throughout New Zealand.
Electric vehicles will require all of these services with the obvious exception of petrol and diesel
supplies in the case of BEVs. The only new technology presented by electric vehicles will be
the electrical system, notably motor, generator and braking systems, and the supply, servicing
and disposal/recycling of batteries. There is considerable experience within both the automobile
and general industry with items such as electric motors and generators so the transfer of
expertise to this area is very unlikely to present difficulties. Dealing with large numbers of large
batteries does present some novel activities, particularly with respect to disposal or recycling of
used batteries, which will require some planning and possibly the establishment of a new
service industry.
At this point in time, it is very unlikely that the support infrastructure will cause an impediment to
the introduction of electric vehicles provided that adequate forethought is given to such issues
as battery disposal and the appropriate training of technicians. The anticipated slow uptake of
electric vehicles in the near term provides opportunity to address these issues. This will best be
managed with an industry-wide approach coordinating government, vehicle suppliers, service
industries and training institutions. This was successfully achieved in the 1980s when the
government led the CNG programme which, after some initial quality problems, developed a
successful industry imitated by a number of other countries. Without the coordinated approach
and establishment of the necessary service infrastructure the programme would not have
succeeded as poor quality of services will quickly lead to consumer resistance to new
technologies as happened in the early stages of the CNG market.
Provision of electricity and the associated vehicle charging options are essential components of
these services for electric vehicles and are discussed in detail in later sections of the report.
2.4 PHEVs versus BEVs
Both PHEV and BEV models have been released or are about to be released by various
manufacturers over the next year or two. BEV manufacturers have concentrated on the smaller
(Mitsubishi iMiEV) and medium (Ford Focus EV and Nissan Leaf) size vehicle categories.
Claimed maximum operating range between battery charges typically falls in the range of 110 to
16
180 km, being limited to by the size and costs of the battery used .
16
These batteries typically have capacities of 15 to 25 kWh and an overall vehicle energy efficiency of some 7 km/kWh.
A more conservative figure of 5.7 km/kWh is used throughout the analysis in this study to account for more rigorous
driving patterns and parasitic demands on the battery such as vehicle air conditioning. It is not expected that this will
improve significantly as the electric motor already operates to a high level of efficiency.
December 2010 Page 19Electric Vehicles
This range is expected to increase significantly as the battery energy density is improved as
expected allowing more energy to be stored in the same weight of battery. The high cost and
17
limited range of the current BEV models are seen as the main impediments to the uptake of
BEVs in present mass vehicle market.
PHEVs provide a partial solution to these concerns with BEVs by complementing the battery
range with petrol operation to extend total vehicle range to levels comparable with ICE vehicles.
There is a compromise between maximizing the electric-only range of the PHEV and reducing
the battery weight and cost. Vehicle manufacturers have taken different approaches when
setting the electric-only range: the BYD F3DM has range of 100 km, the GM Volt 65 km,
whereas the Toyota Prius plug-in has an electric-only range of only 10 km. Toyotaʼs
conservative approach stems from concerns about consumer resistance to the high cost of
extra battery capacity, the unproven technology, and uncertainty about how customers will
operate the vehicles.
Because of the extended range of PHEVs it is commonly believed that they will be more readily
accepted by the market in the shorter to medium term. However, as battery densities increase
and costs fall, the range disadvantage of BEV relative to both PHEV and ICE vehicles will
diminish and BEV will become the predominant electric vehicle technology as it is a simpler
technology than PHEV and potentially cheaper when battery costs are reduced substantially.
It is open to conjecture when that cross-over will occur and what the electric-only range of
PHEVs will be in ten or twenty yearsʼ time. For these reasons, it is assumed when determining
electricity demand in this study that both types of electric vehicles will operate on electricity only.
This is a conservative assumption as it discounts petrol used on longer trips by PHEVs but not
unreasonable given that the electric-only range of some PHEVs is already well in excess of the
average daily distance travelled by vehicles (Section 3) and PHEVs will preferentially operate on
18
electricity than petrol . No distinction is made between the electric-only performance of PHEVs
and BEVs.
17
Compared to over 500 km for ICE vehicles, which can be refueled quickly at service stations.
18
It is estimated that electricity would have to be priced at over 90 c/kWh to match the energy cost of petrol with oil
priced at US$120/barrel (RUC included).
December 2010 Page 203 Driving Patterns and Vehicle Charging Options
3 Driving Patterns and Vehicle Charging Options
Charging of electric vehicle batteries will differ considerably from the fuelling of ICE vehicles as
the rates of charging batteries are considerably slower than pumping fuel and electricity is
available at households allowing EVs to be plugged-in for charging over extended periods. This
section reviews vehicle usage patterns to identify possible battery charging options which are
important determinants of peak electricity demand from electric vehicles.
3.1 Daily Driving Distances
Light petrol and diesel passenger vehicles account for 78% of New Zealand road transport
19
vehicle kilometres (VKT) . This category of vehicles, along with light commercial vehicles
which contribute a further 14% of total VKT, represent the primary target market for electric
vehicles as they are predominantly four wheel vehicles of less than 3.5 tonnes weight.
Figure 2: Private Vehicle Use
Private vehicles are used on average slightly less than one hour per day, travelling some 39
20
kilometres and averaging about three trips each day including the return trip home. Cars
travel slightly less (37 km) as SUVs and van/utility vehicles average somewhat over 45 km.
Distances travelled in rural areas and smaller towns average over 52 km per day whereas those
in the major urban centres average 34.9 km.
As the median distance travelled per day of 23.2 km is significantly less than the average
distance, a disproportionate amount of total VKT can be apportioned to a relatively small
number of vehicles. The distribution of travel amongst private vehicles is shown in Figure 2.
19
Transport Monitoring Indicator Framework, MoT, 2009. VKT is the aggregate distance travelled by a group of
vehicles.
20
Ongoing Household Travel Survey, 2003-2007 data, Ministry of Transport. MoTʼs Transport Monitoring Indicator
Framework graphics and fleet data indicate a lower average for light vehicles (combined passenger and commercial) of
about 33.5 km/day. This lower number is used in the fleet VKT modeling,
December 2010 Page 21Electric Vehicles
It shows that 95% of vehicles travel less than 126 km/day and, with a daily average of 39 km, it
can be deduced that 5% of vehicles account for about 25% of total VKT travelled by private
vehicles (this same proportion applies in the main urban areas despite the 95 percentile being
21
only 106 km per day). Only 0.4% of trip chains are longer than 150 km in driver distance .
VKT is directly related to energy consumption, in the case of electric vehicles the electrical
energy required to charge the batteries. Average annual VKT per vehicle for light passenger
vehicles in New Zealand was 12,235 km in 2007 and remained relatively constant over the
immediate preceding years. For the purposes of this study, it is assumed that the average
travel distance of electric vehicles through to 2040 is 12,235 km per annum and the inclusion of
22
light commercial EVs will add a further 18.4% to the aggregate VKT of light passenger EVs .
This is a simplifying assumption in the determination of electricity demand for electric vehicles
but its impact is small compared to any assumptions around the uptake of electric vehicles in
the New Zealand market. Whilst the population of electric vehicles has been modelled (Section
4), aggregate VKT has not as it is related to future demand for transport and beyond the scope
of this study.
3.2 Trip Purpose and Vehicle Parking
Trip purpose and vehicle parking patterns provide indications as to where electric vehicles can
be charged. Vehicle use patterns may change in the future as drivers adapt to the particular
characteristics of electric vehicles compared to ICE vehicles but as there is no authoritative data
in New Zealand which describes any potential change in behaviour, data is drawn from surveys
23
carried out by the Ministry of Transport of current vehicle use .
The survey data indicates that more than 90% of vehicles are parked overnight at home from 10
pm to 6 am during weekdays (Figure 3 below). From 6 am vehicles are parked at work, home
or at other locations until the early evening and by 6 pm 80% of vehicles are parked at home.
During the weekend the parking pattern is somewhat different with significantly more vehicles
parked at home during the daytime and only a small number taken to work. A slightly smaller
proportion of parked vehicles are located overnight at home during weekends.
Figure 3 also shows the daily distribution of hours all vehicles in New Zealand were parked
during a surveyed year period. It indicates (by the dip in the narrow black lines) that most
driving takes place during daytime hours and that the very large majority of vehicles are parked
at night, predominantly at home. This is most pronounced during weekdays when a lesser
number of cars are parked during the daytime hours, especially during the work and school rush
hours of 6 to 9 am and 3 to 6 pm. The small magnitude of the dip in the graph confirms light
vehicles are utilized on average for only a short time each day, travelling less than 40
kilometres.
21
A trip chain is a series of trips which ends at home, at work or when followed by a stop of 90min or more.
22
In proportion to their contribution to total New Zealand VKT. Light commercial vehicles averaged 14,375 km per year
in 2007.
23
Ongoing Household Travel Survey, 2003-2007, Ministry of Transport
December 2010 Page 223 Driving Patterns and Vehicle Charging Options
Figure 3: Light Vehicles: Parking by Time of Day
Figure 4: Duration of Vehicle Stops
The duration of stops when parking also provides an indication of the best time to be charging
electric vehicles. Average duration of stops of vehicles at home is over seven hours, about one
third for durations of less than two hours, due to day-time activities, and a further third of home
stops between 8 and 20 hours duration. However, the survey methodology probably under-
represents the final return home in the evening, suggesting that home stops are mainly of longer
24
duration .
24
The survey of stop duration excludes the final stop in the survey period, which will have an unknown length. This will
tend to under-represent the stop after the return trip home which will most often be the overnight parking of the vehicle.
December 2010 Page 23You can also read