Enbridge Inc. and Spectra Energy Corp Combine to Create North America's Premier Energy Infrastructure Company - Investor Presentation
←
→
Page content transcription
If your browser does not render page correctly, please read the page content below
Enbridge Inc. and Spectra Energy
Corp Combine to Create North
America’s Premier Energy
Infrastructure Company
Investor Presentation
September 6, 2016

1
All figures presented in Canadian dollars, unless otherwise specified
Legal Disclaimer
This presentation includes certain forward looking statements and information (FLI) to provide Enbridge and Spectra Energy shareholders and potential investors with information about Enbridge, Spectra
Energy and their respective subsidiaries and affiliates, including each company’s management’s respective assessment of Enbridge, Spectra Energy and their respective subsidiaries’ future plans and
operations, which FLI may not be appropriate for other purposes. FLI is typically identified by words such as “anticipate”, “expect”, “project”, “estimate”, “forecast”, “plan”, “intend”, “target”, “believe”, “likely” and
similar words suggesting future outcomes or statements regarding an outlook. All statements other than statements of historical fact may be FLI. In particular, this news release contains FLI pertaining to, but
not limited to, information with respect to the following: the Transaction; the combined company’s scale, financial flexibility and growth program; future business prospects and performance; annual cost,
revenue and financing benefits; the expectation that the Transaction will be neutral to expected ACFFO per share growth guidance through 2019 and additive to the growth rate beyond that timeframe; future
shareholder returns; annual dividend growth and anticipated dividend increases; payout of distributable cash flow; financial strength and ability to fund capital program and compete for growth projects; run-rate
and tax synergies; leadership and governance structure; and head office and business center locations.
Although we believe that the FLI is reasonable based on the information available today and processes used to prepare it, such statements are not guarantees of future performance and you are cautioned
against placing undue reliance on FLI. By its nature, FLI involves a variety of assumptions, which are based upon factors that may be difficult to predict and that may involve known and unknown risks and
uncertainties and other factors which may cause actual results, levels of activity and achievements to differ materially from those expressed or implied by these FLI, including, but not limited to, the following:
the timing and completion of the Transaction, including receipt of regulatory and shareholder approvals and the satisfaction of other conditions precedent; interloper risk; the realization of anticipated benefits
and synergies of the Transaction and the timing thereof; the success of integration plans; the focus of management time and attention on the Transaction and other disruptions arising from the Transaction;
expected future ACFFO; estimated future dividends; financial strength and flexibility; debt and equity market conditions, including the ability to access capital markets on favourable terms or at all; cost of debt
and equity capital; potential changes in the Enbridge share price which may negatively impact the value of consideration offered to Spectra Energy shareholders; expected supply and demand for crude oil,
natural gas, natural gas liquids and renewable energy; prices of crude oil, natural gas, natural gas liquids and renewable energy; economic and competitive conditions; expected exchange rates; inflation;
interest rates; tax rates and changes; completion of growth projects; anticipated in-service dates; capital project funding; success of hedging activities; the ability of management of Enbridge, its subsidiaries
and affiliates to execute key priorities, including those in connection with the Transaction; availability and price of labour and construction materials; operational performance and reliability; customer,
shareholder, regulatory and other stakeholder approvals and support; regulatory and legislative decisions and actions; public opinion; and weather. We caution that the foregoing list of factors is not
exhaustive. Additional information about these and other assumptions, risks and uncertainties can be found in applicable filings with Canadian and U.S. securities regulators, including any proxy statement,
prospectus or registration statement to be filed in connection with the Transaction. Due to the interdependencies and correlation of these factors, as well as other factors, the impact of any one assumption, risk
or uncertainty on FLI cannot be determined with certainty.
Except to the extent required by law, we assume no obligation to publicly update or revise any FLI, whether as a result of new information, future events or otherwise. All FLI in this news release is expressly
qualified in its entirety by these cautionary statements.
This presentation makes reference to non-GAAP measures, including ACFFO and ACFFO per share. ACFFO is defined as cash flow provided by operating activities before changes in operating assets and
liabilities (including changes in environmental liabilities) less distributions to non-controlling interests and redeemable non-controlling interests, preference share dividends and maintenance capital expenditures,
and further adjusted for unusual, non-recurring or non-operating factors. Management of Enbridge believes the presentation of these measures gives useful information to investors and shareholders as they
provide increased transparency and insight into the performance of Enbridge. Management of Enbridge uses ACFFO to assess performance and to set its dividend payout target. These measures are not
measures that have a standardized meaning prescribed by generally accepted accounting principles in the United States of America (U.S. GAAP) and may not be comparable with similar measures presented
by other issuers. Additional information on Enbridge’s use of non-GAAP measures can be found in Enbridge’s Management’s Discussion and Analysis (MD&A) available on Enbridge’s website and
www.sedar.com.
Enbridge will file with the U.S. Securities and Exchange Commission (SEC) a registration statement on Form F-4, which will include a proxy statement of Spectra Energy that also constitutes a prospectus of
Enbridge, and any other documents in connection with the Transaction. The definitive proxy statement/prospectus will be sent to the shareholders of Spectra Energy. INVESTORS AND SHAREHOLDERS OF
SPECTRA ENERGY ARE URGED TO READ THE PROXY STATEMENT/PROSPECTUS, AND ANY OTHER DOCUMENTS FILED OR TO BE FILED WITH THE SEC IN CONNECTION WITH THE
TRANSACTION WHEN THEY BECOME AVAILABLE, AS THEY WILL CONTAIN IMPORTANT INFORMATION ABOUT Enbridge, Spectra Energy, THE TRANSACTION AND RELATED MATTERS. The
registration statement and proxy statement/prospectus and other documents filed by Enbridge and Spectra Energy with the SEC, when filed, will be available free of charge at the SEC's website at
www.sec.gov. In addition, investors and shareholders will be able to obtain free copies of the proxy statement/prospectus and other documents which will be filed with the SEC by Enbridge on Enbridge’s
website at www.Enbridge.com or upon written request to Enbridge’s Investor Relations department, 200, 425 First St. SW, Calgary, AB T2P 3L8 or by calling 800.481.2804 within North America and
403.231.5957 from outside North America, and will be able to obtain free copies of the proxy statement/prospectus and other documents filed with the SEC by Spectra Energy upon written request to Spectra
Energy, Investor Relations, 5400 Westheimer Ct. Houston, TX 77056 or by calling 713.627.4610. You may also read and copy any reports, statements and other information filed by Spectra Energy and
Enbridge with the SEC at the SEC public reference room at 100 F Street N.E., Room 1580, Washington, D.C. 20549. Please call the SEC at 800.732.0330 or visit the SEC's website for further information on its
public reference room. This communication shall not constitute an offer to sell or the solicitation of an offer to buy any securities, nor shall there be any sale of securities in any jurisdiction in which such offer,
solicitation or sale would be unlawful prior to appropriate registration or qualification under the securities laws of such jurisdiction. No offering of securities shall be made except by means of a prospectus
meeting the requirements of Section 10 of the U.S. Securities Act of 1933, as amended.
This communication is not a solicitation of proxies in connection with the Transaction. However, Enbridge, Spectra Energy, certain of their respective directors and executive officers and certain other members
of management and employees, under SEC rules, may be deemed to be participants in the solicitation of proxies in connection with the Transaction. Information about Enbridge’s directors and executive
officers may be found in its Management Information Circular dated March 8, 2016 available on its website at www.Enbridge.com and at www.sedar.com. Information about Spectra Energy's directors,
2
executive officers and other members of management and employees may be found in its 2015 Annual Report on Form 10-K filed with the SEC on February 25, 2016, and definitive proxy statement relating to
its 2016 Annual Meeting of Shareholders filed with the SEC on March 16, 2016. These documents can be obtained free of charge from the sources indicated above. Additional information regarding the
interests of such potential participants in the solicitation of proxies in connection with the Transaction will be included in the proxy statement/prospectus and other relevant materials filed with the SEC when they
become available.
Highlights of Strategic Combination

        Global energy                         Unparalleled secured                Stable and predictable
    infrastructure leader                      growth program of                        cash flows           Diversified

                                              $26+                                                           assets and

$165      Billion EV                          $48
                                                                  Billion

                                                                  Billion
                                                                                     96%                        strong
                                                                                                             investment
                                                                                                            grade balance
                                                                                     Take-or-pay and            sheet
                                                 in probability weighted          equivalent or regulated
                                              development project pipeline

                                                                                                            Superior annual
                                                                                                            dividend growth

                                                                                     4.6%
                                                 Industry leading
                                                   total return
                                                     potential                                              10-12%
                                                                                           Yield             Through 2024

3    Note: 4.6% yield implied by the current share price and the 2017 increase.
Transaction Details
    Transaction                        –    Based on Enbridge’s September 2, 2016 closing price of $53.25, total consideration for each Spectra
                                            share is 0.984 shares of Enbridge common stock
    Terms                              –    Offer price represents a premium of approximately 11.5% to Spectra’s closing price on September 2,
                                            2016

                                       –    Enbridge and Spectra shareholders will own 57% and 43% of the combined entity, respectively
                                       –    $37 billion total purchase price
                                            • Approximately 694 million new shares issued
                                       –    Enbridge will assume approximately $22 billion of existing Spectra debt
    Transaction                        –    Maintain robust sponsored investment vehicles and MLPs
    Highlights                         –    DCP will continue to operate as a 50/50 JV with Phillips 66
                                       –    12% - 14% ACFFO1 per share CAGR guidance maintained for the 2014-2019 period
                                       –    15% dividend growth in 20172, 10-12% annual growth through 2024
                                       –    The deal is expected to be neutral to Enbridge’s 12%-14% secured ACFFO/share CAGR guidance
                                            for the 2014-2019 plan horizon, and strongly additive to growth beyond that timeframe

                                       –    Head office in Calgary with natural gas business located in Houston
                                       –    Current Enbridge CEO, Al Monaco, will continue to serve as CEO of Enbridge
    Combined Entity
                                       –    Current Spectra CEO, Greg Ebel, will serve as Chairman
    Governance                         –    New Enbridge Board to be comprised of 13 total directors: 8 directors designated by Enbridge and 5
                                            directors designated by Spectra

                                       –    Transaction is expected to close in Q1 2017, subject to shareholder vote at both Enbridge and
    Timing and                              Spectra
    Approvals                          –    Regulatory approvals including HSR, Canada Competition Act and CFIUS

4    (1)   See appendix for definition of ACFFO which remains unchanged.
     (2)   Contingent on deal closing.
Compelling Benefits to Enbridge and Spectra Shareholders
Enbridge                                                                                 Spectra

– Diversifies Enbridge to be balanced                                                  – Delivers upfront premium and participation
  between crude and natural gas                                                          in significant value uplift potential
– “Best-in-class” assets and commercial                                                – Intended to qualify as a tax deferred
  underpinning                                                                           transaction for Spectra shareholders

– Adds three new strategic platforms with                                              – Increases and extends future dividend
  immense scale for organic growth                                                       growth from approximately 8% to 15% in
                                                                                         year 12 and 10-12% annually through 2024;
– More than doubles total growth program                                                 enhances DCF coverage
  and visibly extends premium dividend
                                                                                       – Materially diversifies company by adding
  growth through 2024
                                                                                         industry-leading liquids pipeline, utility and
– Reinforces 12-14% ACFFO1 per share                                                     power assets
  growth CAGR for 2014-2019 by diversifying                                            – Allows for the continued development of
  secured capital program                                                                Spectra's existing, attractive expansion
– Launches Enbridge into a unique global                                                 program
  investment category                                                                  – Creates significant cost and tax synergies

    Combination provides step-change growth opportunities, scale, strength
5    (1)   See appendix for definition of ACFFO. Growth rate only includes impact of existing businesses secured growth programs
     (2)   Contingent on deal closing.
Right Combination; Right Time
Two Premium Franchises Positioning for the Future
Increasing opportunities for
large scale infrastructure
investments
Converging
markets
gas and liquids
Changing global financial and
commodity market conditions
Acting proactively from
positions of strength
Now is the right time to act
6Best-In-Class Value Proposition
Highest quality liquids and gas infrastructure assets in North America, all housed
under one roof
Largest and most secure program of diversified organic growth projects in the
industry
Unparalleled commercial underpinning drives highly predictable and growing
ACFFO per share in the range of 12% – 14% annually2
Adds scale, balance sheet strength, financial flexibility and free cash flow to
comfortably fund growth
Attractive 4.6% 1 dividend yield with visible organic 10% - 12% annual dividend
growth through at least 2024
7 (1) 4.6% yield implied by the current share price and anticipated 2017 dividend.
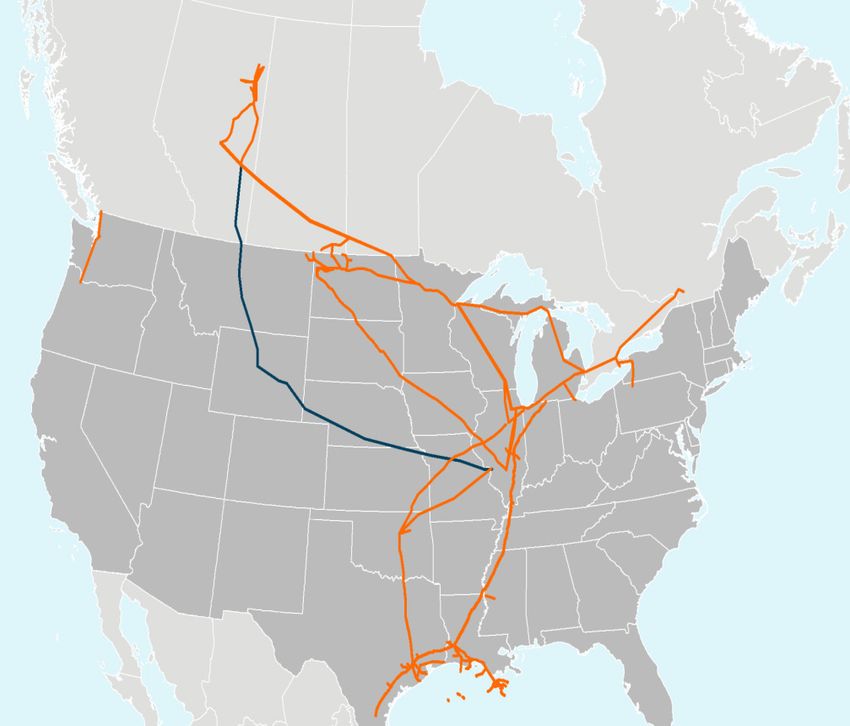
(2) 2014-2019 planning horizonThe Premier North American Energy Infrastructure Asset Base
Spanning Key Supply Basins and Demand Markets
Enbridge Spectra Combined
Liquids pipelines (in Km) 27,600 2,720 30,320
Liquids terminals capacity (in MMbbls) 79 5 84
Gas pipelines (in Km) 24,800 140,800 165,600
Gas storage capacity (in Bcf) 115 300 415
Gas distribution customers (in MM) 2.1 1.4 3.5
Gas processing capacity (in Bcf) 5 4 9
Net generating capacity (in MW) 1,800 - 1,800
Pro Forma EBITDA
Power
4%
Liquids
Gas 49%
47%
Enbridge Spectra
Liquids long-haul Liquids long-haul
Gas long-haul Gas long-haul
G&P pipelines G&P pipelines
Processing plants Processing plants
Geothermal power Gas storage facility
Wind assets Crude storage
Solar assets NGL storage
Gas distribution Gas Distribution
Terminals / storage Propane terminals
Power transmission
Demand-pull assets and strong counterparties
8Scale Enhances Competitive Position
Enhances Financial Flexibility and Access to Capital
North American Energy Infrastructure Canadian Listed Companies Global Energy Companies
Enterprise Value ($ in billions) Market Capitalization ($ in billions) Enterprise Value ($ in billions)
$600
$180 $140
$160
$120
$140
$300
$100
$120
$100 $80
$80 $60
$150
$60
$40
$40
$20
$20
$- $- $-
NEE
BCE
Enbridge PF
Enbridge
EPD
TRP
Spectra
BNS
TD
KMI
ETE
ETP
Enbridge PF
BMO
Enbridge
BAM
TRI
DUK
RY
CM
WMB
WPZ
CNR
SU
CNQ
SLB
CVX
BR Petro.
RDSB
Sinopec
Enbridge PF
Enbridge
EPD
KMI
XOM
DUK
BP
PetroChina
Total
Largest North American One of the largest publicly One of the largest energy
energy infrastructure company listed Canadian companies companies globally
9
Source: Market Data from FactSet as of 09/02/2016.
Note: Based on spot F/X rate as of 09/02/2016.Fundamentals Support Growth and Sustainable Long Term
Cash Flow
Extending and diversifying growth
Liquids: Highly Stable & Growing Base Cash Flows… Natural Gas: Steady Long Term Growth…
… further upside optionality in an oil recovery scenario …from demand pull assets into U.S. northeast, southeast, and
(Kbpd) Gulf Coast
Pipeline Capacity v. WCSB Supply Sources of demand
6,000 (Bcf / d)
Ex-WCSB pipeline capacity WCSB Supply
TMX 116
5,000
4,000
Exports by
Power LNG and
Demand Pipeline
Coal/ Nuclear
3,000 Enbridge Retirements
Industrial
80
2,000 Residential/
Commercial
Other existing pipelines
1,000
Western Canadian refineries
0
2016 2017 2018 2019 2020 2021 2022 2023 2024 2025 2016 2025
WCSB short >500 kbpd pipeline capacity by 2021 Significant expansion potential
10
Sources: Company estimates.Multiple Strategic Growth Platforms
Enbridge Platforms for Growth Spectra Platforms for Growth
Highly predictable North North Positioned for sustained
growing cash flows with American American demand-pull organic
significant further growth for the
Liquids Gas foreseeable future
upside optionality
Pipelines Pipelines
Utilities deliver Positioned on a combined
significant customer basis to compete with
and shareholder Canada’s leading
Canadian midstream players on gas
benefits; Compelling Utilities
platform for Midstream and NGL midstream
extension to electric infrastructure
utilities
Spectra U.S. presence Positioned to provide
and utility customer Renewable U.S. integrated gas/liquids
base enhances growth Power Midstream midstream services across
opportunities for the hydrocarbon chain
Enbridge’s top-10 North
American position
Leading positions in all six platforms
11Industry-Leading Growth Program – Stronger Together
Pro Forma Secured Expansion Program Enjoys Unrivaled Scale
($ in billions)
$26 $23
Risked
100% in
execution $17
$13
$8
$6
1
Pro Forma Enbridge TRP KMI ETP EPD WMB
Large Diverse Opportunity Set
[xxx]
($ in billions)
Major Components of Risked Capital2, 3
$48B of – De-bottlenecking liquids pipelines / market access
Development – Northeast gas pipelines expansion / extension
Projects – Southeast gas pipeline capacity
(Risked) – Gas pipelines for exports
– EDF – Offshore wind
– Other offshore wind
– Utility organic growth
– Organic midstream expansion
– Others
Pro Forma
12 Enbridge Note: KMI, ETP, EPD and WMB secured expansion capex figures converted to CAD using a 1.28 USD to CAD F/X rate.
(1) Secured growth capital program reflects only publicly announced secured projects entering into service between 2017 and 2019.
(2) Probability weighted development growth capital.
(3) Capital spending (predominantly post-2020) will further extend growth beyond the next decadeDiversifies and De-risks 2017-2019 Growth Guidance
Capital In-service 2017 – 2019
($ in billions)
$12.9
Diversity of secured
growth programs by
$7.0 $8.6
$0.4
– Commodity type
– Expenditure profile
$4.1
$8.2
$5.9 $2.6 – Geography
$1.4
– Size of project
2017E 2018E 2019E
Enbridge Spe ctra
~$26 billion in projects to come online between 2017 and 2019
13Strong Commercial Underpinning: Maintains Enbridge’s Low
Risk and Capital Discipline
Low Risk Business Model Limited Commodity Price Risk Investment Grade Customers
96% of cash flowSignificant and Highly Visible Combination Synergies
Annual Run-Rate Synergies Multiple Synergy Opportunities
Full run-rate cost synergies expected to be
achieved by end of 2018:
Increase in
purchasing power – Identifiable and achievable cost synergies;
conservative estimates
13%
Other costs – Potential to optimize funding / financing
12% synergies (not included)
– Extends Spectra’s current favorable
75% cash tax position beyond 2018
General operations
and administrative – Assumes no benefits from future
costs commercial and structuring synergies
Total run-rate synergies of $540 million
(Excludes tax synergies in 2019)
Significant value created through operating and financial synergies
15Supports, De-risks, and Enhances Current Plan
$6.00
$4.50 $5.50
per
share
$3.80
$3.72
$3.02
2014A 2015A 2016E 2017E 2018E 2019E
Based on organic secured growth only
16
(1) See appendix for definition of ACFFO.Visible Organic Dividend Growth with Upside Potential
– 15% dividend increase in 20171
– 10-12% annual dividend growth from 2018 through 2024
– Conservative ACFFO payout ratio of 50-60%
Extended dividend growth through:
– Industry-leading growth platform and
backlog
– Significant scale, strength and diversity
– Enhanced financial flexibility
– Significant potential cost, commercial
and structuring synergies
2016E 2017E 2018E 2019E 2020E 2021E 2022E 2023E 2024E
Materially extends runway to grow dividends beyond 2018 at a premium
pace while maintaining a conservative payout ratio
17 (1) Contingent on deal closing.No Requirements for Follow-on Enbridge Inc. Equity
Enbridge Group Funding Requirements (2017E – 19E) Ample Sources of Alternative Equity Financing
Secured Capital Program
$8 billion of alternative sources of equity capital (2017-19):
($ in billions)
Spectra Energy Partners ATM
$2
Enbridge Income Fund Common Equity
$10 $8
Enbridge Energy Partners PIK
Enbridge Inc. DRIP
$9 Hybrids
Planned monetization of ~$2 billion in non-core assets over
$23 next 12 months to provide additional financing flexibility
$14 Other identified asset monetizations could provide an
incremental $5 – 6 billion of capital
Significant Free Cash Flow Generation Beyond 2019
Uses Sources
JointDebt maturities
Benefits
JV Contributions Cumulative $14 to $18 billion1 free cash flow enables
company to grow organically, acquire assets, and
DRIP / Sponsored Investments/
Secured Capital
Monetizations
raise dividends without equity issuance at corporate
expenditures
level
Debt Issuances
Internal Cash Flow, Net of More competitive in capturing new organic opportunities
Dividends
Immediate and strengthening financial flexibility
18
(1) Cumulative free cash flow (net of dividends) generated between 2020E to 2024E from commercially secured growth.Strong Investment Grade Credit
Strong Credit Metrics
Increased size, scale and asset diversity significantly enhances the credit profile of the combined
entity
Debt/EBITDA naturally improves as high quality projects under construction are placed into
service and begin generating cash flows
Committed to achieving targeted reduction in credit metrics and maintaining credit ratings
across the family of companies as new projects are pursued
Key Credit Metrics and Targets Significant Balance Sheet Strengthening by 2019
Projected Pro Forma Debt / EBITDA
Credit Metric Target 6.2x
6.2x
6.2x 5.5x
5.5x
5.5x 5.1x
5.1x
5.1x 4.4x
FFO / Debt ≥15% 4.3x 5.0x
Total Debt / EBITDA
Total Debt / EBITDA 4.3x1
Debt / EBITDA ≤5.0x
2016 2017E 2018E 2019E
2016 2017E 2018E 2019E
19
(1) Additional funding capacity post 2018 as metric significantly better than target.Peer-Leading Total Return Proposition
Pro Forma Total Return vs Diversified Peers
16%
Dividends
12%
13%
9% 8% 5%
9% 5%
6%
4%
6%
4% 4% 4% 4% 4%
3% 3% 3%
Pro forma Nextera TransCanada Emera Sempra Enterprise Fortis Duke Hydro One
Enbridge
1
Yield Growth Average total return (11%)
Positioned with best-in-class total return compared to diversified peers
Source: Company guidance.
20
Note: Average excludes pro forma Enbridge. Growth calculated as 2016E – 2018E DPS CAGR.
Pro forma Enbridge 2016E – 2018E DPS CAGR includes 15% dividend growth.
(1) Current yield as of 09/02/2016.Timeline to Transaction Closing
Prepare File final
documents Mail proxy
proxy
with circulars to Shareholder
Shareholder
circular and
securities Enbridge and Votes
Votes
Announcement
registration
commissions Spectra
statement
shareholders
Prepare and
submit regulatory
Respond to
filings
regulator
Regulatory Approvals
Transaction
information Closing
(CFIUS, Canadian
requests
Competition Act,
HSR)
Sep 2016 Q4 2016 Q1 2017
21Key Takeaways
Premier N.A. Energy Infrastructure Company
Highest quality liquids and natural gas
infrastructure assets in North America
diversified
Largest and most secure program of
organic growth projects in
the industry
Six leading strategic growth platforms
balance
Ample access to capital and strong
sheet to fund large capital
program
with
Secure, low-risk commercial structure
stable long-term cash flow
visibility
4%+
Premium total return proposition with
current yield plus 10%-12%
annual long-term dividend growth
22
Must Own InvestmentAppendix North American Liquids Pipelines North American Gas Pipelines Utilities Canadian Midstream U.S. Midstream Renewable Power Secured Growth Program Detail Pro forma Funding Strategy Available Cash Flow from Operations 23
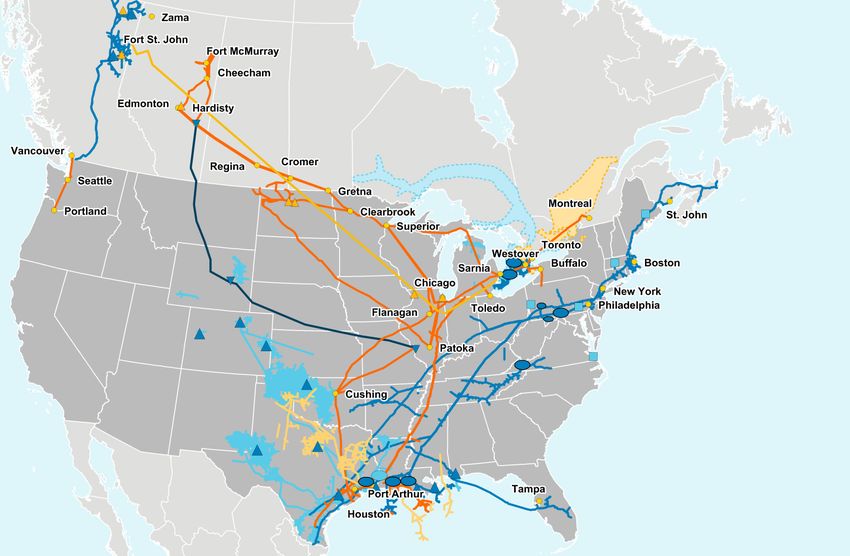
North American Liquids Pipelines
Segment Highlights Our Combined Footprint
– Highly competitive position with low-cost, fee-based Enbridge Spectra Combined
cash flows Liquids pipelines (in Km) 27,600 2,720 30,320
Liquids terminals capacity (in MMbbls) 79 5 84
– Multiple cross border and market access systems
provide unparalleled ability to deliver to key strategic
demand zones
– Ability to optimize capacity and operational flexibility
across the system – potential for low cost expansions
– World class counter-parties with >95% investment
grade customers
Growth Projects Overview ($ in billions)
Risked Growth (through 2024)
– Low cost mainline and market access expansions
– Regional system expansions
$9 – USGC development opportunities
Secured Growth Capital ISD
Enbridge liquids long-haul
– JACOS Hangingstone $0.2 2017
– Athabasca Pipeline Twinning 1.3 2017 Enbridge liquids terminals
– Norlite Diluent Pipeline 0.9 2017 Spectra liquids long-haul
– Bakken Pipeline 1.9 2017 Spectra crude storage
– Wood Buffalo Extension 1.3 2017
$14 – Stampede Lateral 0.2 2018
– U.S. Mainline PH2 (SA to 1200) 0.4 2019
– Line 3 Replacement Program 7.5 2019
24
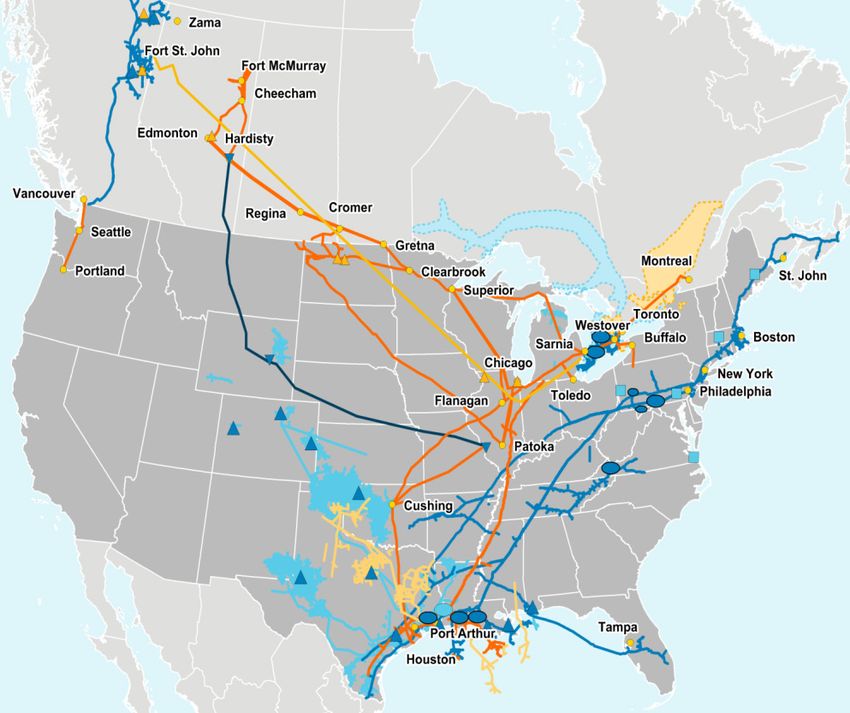
Secured RiskedNorth American Gas Pipelines
Segment Highlights Our Combined Footprint
Enbridge Spectra Combined
– One of the premier natural gas transportation systems
in North America Long-haul gas pipelines (in Km) 3,560 27,520 31,080
Gas storage capacity (in Bcf) 115 300 415
– Existing assets serve major north American demand
centers and supply regions
– Potential to serve growing market demand (i.e., power
market in Mexico, LNG exports and U.S. industrial
market)
– Cash flows primarily underpinned by take-or-pay
contracts with ~9 years average contract life
Growth Projects Overview ($ in billions)
Risked Growth (through 2024)
– Northeast and Southeast U.S. pipeline expansions
– Power generation connections
– Mexico and LNG connections in U.S. and Canada
Secured Growth Capital ISD Enbridge gas long-haul
$18 – Sabal Trail $2.0 2017
Enbridge offshore pipelines
– Gulf Markets 0.2 2017
Spectra gas storage facility
– Atlantic Bridge 0.6 2017
Spectra gas long-haul
– NEXUS 1.4 2017
– STEP 0.2 2018
– Valley Crossing 1.9 2018
$8 – Stratton Ridge 0.3 2019
– Other projects 1.4 Various
25
Secured RiskedUtilities
Segment Highlights Our Combined Footprint
Enbridge Spectra Combined
– Two major North American utilities with
Gas distribution customers (in MM) 2.1 1.4 3.5
significant organic growth Average base rate growth (5 years) 6% 4% 5%
Gas storage capacity (Bcf) 115 160 275
– Provides a low risk commercial model with
rate-based contracts underpinning cash flows
– Compelling platform for extension into electric
utilities
Growth Projects Overview ($ in billions)
Risked Growth (through 2024)
– Community Expansion / Distribution Assets Renewal
– Gas Storage Assets Renewal
– Ongoing Dawn Parkway expansions
Distribution pipelines
– East Coast LNG
$5 Spectra gas storage facility
Enbridge gas distribution
Secured Growth Capital ISD Spectra gas distribution
– 2017 Dawn - Parkway $0.6 2017
– Panhandle Reinforcement 0.3 2018
– Traditional Growth 0.6 Various
$1
26
Secured RiskedCanadian Midstream
Segment Highlights Our Combined Footprint
– Makes Enbridge the top player in the Montney,
Duvernay and the Horn River
– Opportunities for NGL pipelines
– Provides critical gathering and processing services
– Complementary asset base that provides take away to
premium markets in the West and East
• Well positioned to serve West Coast LNG and export
growth BC Pipeline
Alliance
– Ability to generate low risk, predictable growth Pipeline
Growth Projects Overview ($ in billions)
Risked Growth (through 2024) Enbridge gas processing facility
– West coast LNG related expansions Spectra processing plants
– Tupper Expansion
Spectra G&P pipelines
– WCSB NGL Pipeline and Fractionator
$5 North American gas pipeline assets
– Alliance Expansion
Secured Growth Capital ISD
– Jackfish Lake $0.2 2017
– High Pine 0.4 2017
– RAM 0.5 2017
$1 – Wyndwood 0.2 2018
27
Secured RiskedU.S. Midstream
Segment Highlights Our Combined Footprint
– Assets located in some of the most desirable,
resource-rich basins
• The largest natural gas processor and NGL producer in
the U.S.
• Strong positions in multiple plays including the Midcon,
Permian and DJ Basin
– Significant upside to a commodity price recovery
– Extensive asset network allows optimization of
transportation from well head to high value markets
– G&P is a must-run business that will continue to
rebound with increased E&P activity
– In process of transitioning to highly stable fee-based
cash flows
Growth Projects Overview ($ in billions)
Midcoast Energy gas processing facility
DCP Midstream a propane terminals
Risked Growth (through 2024) DCP Midstream processing plants
$1 – Permian and DJ Basin Expansions DCP Midstream NGL storage
– Texas Fractionation Midcoast Energy G&P pipelines
DCP Midstream G&P pipelines
Secured Growth Capital ISD
– Various growth projects $0.3 Various
0.3
28
Secured RiskedRenewable Power
Segment Highlights Our Combined Footprint
– Renewable power assets provide stable cash flows Enbridge Spectra Combined
from long term contracts with primarily government Net generating capacity (in MW) 1,800 – 1,800
offtakers
– Strong fundamentals for North American and
European renewables
– 1.8 MW of net renewable power capacity
– Growing backlog of development projects (>2GW)
Growth Projects Overview ($ in billions)
Risked Growth (through 2024)
– On-Shore Renewable Power Development
Enbridge wind assets
– French Offshore Wind Project Enbridge solar assets
– Off-Shore Renewable Power Development Enbridge geothermal power
$9 – East-West Tie Line Transmission Project UK Enbridge power transmission
Secured Growth Capital ISD
– Rampion Wind Project $0.8 2018
$1
29
Secured RiskedCombined Secured Growth Program
Capital
Project Segment ($ in Bn)
In-service 2017:
JACOS Hangingstone Liquids Pipelines $0.2
Athabasca Pipeline Twinning Liquids Pipelines 1.3
Norlite Diluent Pipeline Liquids Pipelines 0.9
Wood Buffalo Extension Liquids Pipelines 1.3
Bakken Pipeline Liquids Pipelines 1.9
Other Growth Capital Gas Pipelines 0.1
Sabal Trail Gas Pipelines 2.0
Gulf Markets Gas Pipelines 0.2
Access South, Adair Southwest & Lebanon Extension Gas Pipelines 0.6
Atlantic Bridge Gas Pipelines 0.6
NEXUS Gas Pipelines 1.4
TEAL Gas Pipelines 0.2
PennEast Gas Pipelines 0.2
Other EGD Capital Utilities 0.2
Dawn - Parkway Utilities 0.6
Jackfish Lake Canadian Midstream 0.2
High Pine Canadian Midstream 0.4
RAM Canadian Midstream 0.5
Other Growth Capital U.S. Midstream 0.1
In-service 2018:
Stampede Lateral Liquids Pipelines $0.2
Valley Crossing Gas Pipelines 1.9
STEP Gas Pipelines 0.2
Bayway Gas Pipelines 0.0
Other Growth Capital Gas Pipelines 0.2
Panhandle Reinforcement Utilities 0.3
Other EGD Capital Utilities 0.2
Wyndwood Canadian Midstream 0.2
Other Growth Capital U.S. Midstream 0.1
Rampion Wind Project Renewable Power 0.8
In-service 2019:
U.S. Mainline PH2 (SA to 1200) Liquids Pipelines $0.4
Line 3 Replacement Program Liquids Pipelines 7.5
Other Growth Capital Gas Pipelines 0.1
Stratton Ridge Gas Pipelines 0.3
Other EGD Capital Utilities 0.2
Other Growth Capital U.S. Midstream 0.1
Total ~$26
30Pro Forma Funding Alternatives
Common Equity Senior Notes Hybrid
Entity Ratings
(S&P / Moody’s / DBRS)
New Issue DRIP ATM / MTN Securities
ENB BBB+ / Baa2 / BBBH
ENF NR / Baa2 / BBBH
EEP BBB / Baa3 / BBB
EPI BBB+ / NR / A
EGD BBB+ / NR / A
SEP BBB / Baa2 / BBB/BBB*
Union Gas BBB+ / NR / A
Westcoast BBB / NR / AL
Diversified funding alternatives to maintain financial flexibility
31
* Fitch rating.Available Cash Flow from Operations
ACFFO reconciliation
Cash provided by operating activities – continuing operations
(+ / –) Adjustments for changes in operating assets and liabilities 1
Adjusted cash provided by operating activities
(–) Distributions to non-controlling interests
(–) Preference share dividends
(–) Maintenance capital expenditures 2
(+ / –) Other significant adjusting items 3
Available cash flow from operations (ACFFO)
(1) Changes in operating assets and liabilities include changes in regulatory assets and liabilities and environmental liabilities, net of recoveries.
(2) Maintenance capital expenditures are expenditures that are required for the ongoing support and maintenance of the existing pipeline system or that are necessary to
maintain the service capability of the existing assets (including the replacement of components that are worn, obsolete, or completing their useful lives). For the purpose of
ACFFO, maintenance capital excludes expenditures that extend asset useful lives, increase capacities from existing levels or reduce costs to enhance revenues or
provide enhancements to the service capability of the existing assets.
(3) Other significant adjusting items include among other employee severance costs, weather normalization items and project development and transaction costs.
32You can also read