Energy Economics and Policy - By Brian Roach and Jonathan M. Harris - An ECI Teaching Module on Social and Environmental Issues in Economics
←
→
Page content transcription
If your browser does not render page correctly, please read the page content below
Energy Economics and Policy
   By Brian Roach and Jonathan M. Harris

 An ECI Teaching Module on Social and Environmental Issues in Economics

                                        Global Development Policy Center
                                                       Boston University
                                                      53 Bay State Road
                                                      Boston, MA 02155
                                                             bu.edu/gdp
ENERGY ECONOMICS AND POLICY

Economics in Context Initiative, Global Development Policy Center, Boston University, 2021.

Permission is hereby granted for instructors to copy this module for instructional purposes.

Suggested citation: Roach, Brian and Jonathan M. Harris. 2021. “Energy Economics and
Policy.” An ECI Teaching Module on Social and Economic Issues, Economics in Context
Initiative, Global Development Policy Center, Boston University.

Students may also download the module directly from:
http://www.bu.edu/eci/education-materials/teaching-modules/

Comments and feedback from course use are welcomed:

Economics in Context Initiative
Global Development Policy Center
Boston University
53 Bay State Road Boston, MA 02215
http://www.bu.edu/eci/

Email: eci@bu.edu

NOTE – terms denoted in bold face are defined in the KEY TERMS AND CONCEPTS
section at the end of the module.

                                                                                               1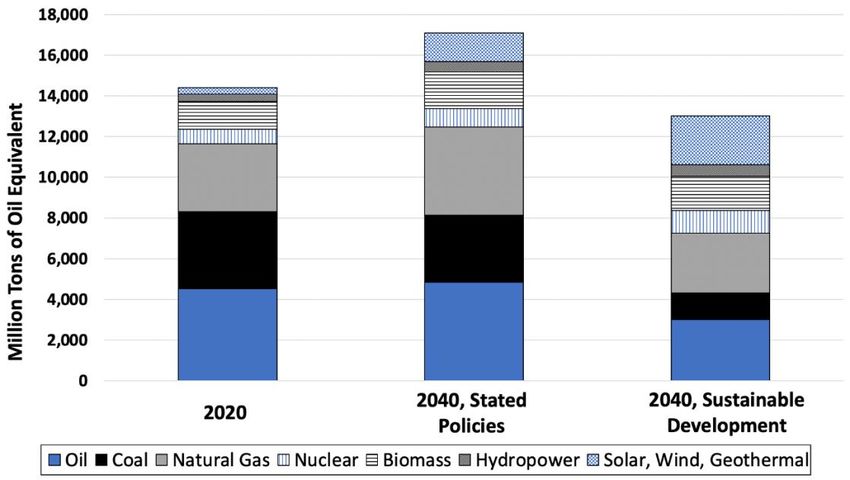
ENERGY ECONOMICS AND POLICY

                                               TABLE OF CONTENTS

1.     FOUR GLOBAL ENERGY CHALLENGES ............................................................... 3
2.     NONRENEWABLE ENERGY....................................................................................... 9
     2.1      Oil .............................................................................................................................. 9
     2.2      Coal .......................................................................................................................... 12
     2.3      Natural Gas .............................................................................................................. 13
     2.4      Nuclear Energy ........................................................................................................ 16
3.     RENEWABLE ENERGY SOURCES.......................................................................... 17
     3.1      Wind Energy ............................................................................................................ 18
     3.2      Solar Energy............................................................................................................. 19
     3.3      Other Renewable Energy Sources ........................................................................... 22
4. ENERGY ECONOMICS: CURRENT ANALYSES AND ALTERNATIVE
FUTURES ............................................................................................................................... 24
     4.1      Cost Comparisons of Energy Sources...................................................................... 24
     4.2      Externality Costs of Different Energy Sources ........................................................ 26
     4.3      Energy Projections ................................................................................................... 27
     4.4      Carbon-Neutral Energy Systems.............................................................................. 29
     4.5      The Importance of Energy Efficiency...................................................................... 31
5.     POLICIES FOR THE GREAT ENERGY TRANSITION ........................................ 32
     5.1      Internalizing Externalities ........................................................................................ 32
     5.2      Energy Subsidy Reform ........................................................................................... 33
     5.3      Demand-side Energy Management .......................................................................... 37
     5.4      Addressing Global Energy Disparities..................................................................... 39
6.     SUMMARY .................................................................................................................... 40
DISCUSSION QUESTIONS ................................................................................................. 41
KEY TERMS AND CONCEPTS ......................................................................................... 41
REFERENCES....................................................................................................................... 42
WEBSITES ............................................................................................................................. 49

                                                                                                                                               2
ENERGY ECONOMICS AND POLICY

1. FOUR GLOBAL ENERGY CHALLENGES

The Industrial Revolution in the 18th and 19th centuries was driven by a transition away from
traditional energy sources such as wood and animal power to fossil fuel energy. If humanity is
to achieve a sustainability revolution in the 21st century, it will be driven by a transition away
from fossil fuel energy to renewable sources such as wind and solar power. Modern economies
are absolutely dependent on a continual supply of energy. While energy expenditures only
represent about 6% of GDP in the United States, the other 94% of the economy would collapse
without sufficient energy supplies. 1

The great transition away from fossil fuels is already underway, being driven by changes in
technology, prices, and government policies. But the transition is not occurring fast enough to
prevent unacceptable climate change – the world’s first energy challenge we consider in this
section.2 Currently the world obtains over 80% of its energy from fossil fuels, as shown in
Figure 1 – a percentage which has remained essentially constant over the last few decades.
While the amount of global energy obtained from wind and solar power has tripled in the last
10 years, these sources are still only a small percentage of total energy use. 3 According to a
2019 report:

                       Figure 1. Global Energy Supplies by Source, 2018

      Source: International Energy Agency, Data and Statistics, “Total Energy Supply by Source”.

1
  U.S. EIA, 2019a.
2
  Climate Action Tracker, https://climateactiontracker.org/.
3
  International Energy Agency, Data and Statistics, https://www.iea.org/data-and-
    statistics?country=WORLD&fuel=Energy%20supply&indicator=TPESbySource.
                                                                                                   3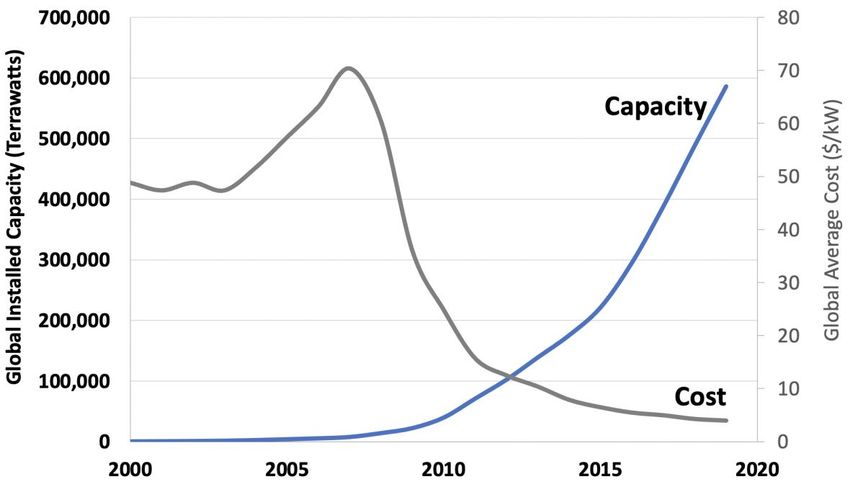
ENERGY ECONOMICS AND POLICY

         the energy transformation must happen much faster. To meet global climate
         objectives, the deployment of renewables must increase at least six-fold
         compared to current government plans. This would require the impressive
         progress that we are already witnessing in the power sector to accelerate even
         further, while efforts to decarbonise transport and heating would need to be
         stepped-up significantly.4

The challenge of transitioning away from fossil fuels raises the related challenge of
electrification of the world’s energy system. Fossil fuels provide energy both directly through
combustion and indirectly by generating electricity. For example, when gasoline is burned in a
car engine or natural gas is burned in a furnace, we use the resulting energy directly to drive a
car or heat a home. Indirectly, fossil fuels can generate electricity that is then used for various
purposes. The energy from renewable sources such as wind and solar energy can also be
converted to electricity for final use.

Currently only about 25% of the world’s energy comes from electricity, including electricity
generated from renewable and nonrenewable sources. For a large-scale transition to renewable
energy, processes that currently rely on the direct burning of fossil fuels will have to be
converted to electric power. For example, rather than powering vehicles by burning gasoline
we can switch to electric vehicles powered indirectly from wind or solar energy. Fortunately,
electric technologies for transportation, heating, industrial production, and other uses are
developing rapidly, along with battery technology to store electric energy. (See Box 1 for more
on electric vehicles.) The global infrastructure to deliver electricity will also need to be
expanded and modernized.

BOX 1: THE ADVANTAGES OF ELECTRIC VEHICLES

Electric Vehicles (EVs) are starting to penetrate the global automobile market. A step beyond
hybrids and plug-in hybrids, which use both gasoline and electric power, fully electric vehicles
use electricity only. EVs offer numerous advantages over traditional vehicles.

According to an analysis by the Union of Concerned Scientists, over a vehicle’s lifetime EVs
produce less than half the greenhouse gas emissions of a typical vehicle, even when the higher
emissions of EV production are taken into account.5 As a greater share of electricity is
generated from renewable sources, the environmental benefits of EVs will increase further.
With fewer moving parts, EVs also require less maintenance. For example, EVs require no oil
changes or tune-ups, and have no exhaust systems, belts, or complex transmissions. Another
advantage of EVs is lower fuel costs. According to a 2020 analysis from the U.S. Department
of Energy, a driver can save as much as $14,500 in lower fuel costs over 15 years by driving
an EV instead of a comparable gas vehicle. 6

4
  IRENA, 2019a, p. 3.
5
    Nealer et al., 2015.
6
    NREL, 2020.
                                                                                                 4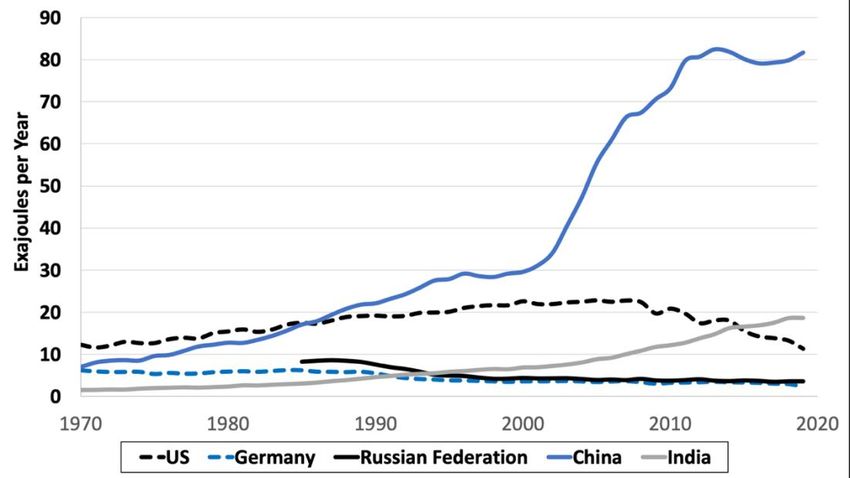
ENERGY ECONOMICS AND POLICY

EVs are generally more expensive to purchase than comparable gas vehicles, primarily due to
the high cost of the batteries. But the cost savings from lower maintenance and operational
costs means that total vehicle ownership costs tend to be less for EVs. For example, a 2020
report by Consumer Reports compared the total ownership cost of nine popular EVs to similar
gas-powered vehicles. The results showed that for “all EVs analyzed, the lifetime ownership
costs were many thousands of dollars lower than all comparable ICE vehicles’ costs, with most
EVs offering savings of between $6,000 and $10,000.”7 Also, EV battery costs are rapidly
declining—dropping by 87 percent between 2010 and 2019.8 With expected further declines in
battery prices, EVs are expected to become cost-competitive with gas vehicles based on
purchase price alone as soon as 2023. Once this occurs, “electric vehicles will probably move
beyond niche applications and begin to penetrate the market widely, leading to a potential
paradigm shift in vehicle technology.”9

While sales of EVs are growing, they still comprise only about 2% of all new vehicle sales. 10
A 2020 forecast developed by the consulting company Deloitte projects that annual EV sales
will increase more than ten-fold during the 2020s, reaching about one-third of all new vehicles
sold by 2030.11

Norway is an example of how government incentives can dramatically boost the sales of EVs.
EV owners in Norway are exempt from purchase taxes, including a 25 percent value-added tax,
and pay reduced fees for parking and tolls. EV drivers can use bus lanes and have access to an
extensive network of charging stations. 12 As a result of such policies, in the first half of 2020
EVs comprised 48% of all new vehicle sales in Norway.13

While technological changes and market forces increasingly favor renewable energy and
electrification over fossil fuels, government policies will ultimately determine how fast the
transition occurs. Policies that focus on changing a society’s energy mix, such as shifting from
fossil fuels towards renewables, are referred to as supply-side energy management. For
example, Germany has set a target of obtaining 65% of its electricity from renewable sources
by 2030.

The world’s energy challenge is not simply about switching energy sources. Global energy
demand has been increasingly steadily, as shown in Figure 2. While the world’s consumption
of renewable energy increased by a factor of 13 between 2000 and 2019, overall demand for
fossil fuels is also increasing. During this same period, the global demand for oil increased by
30%, and demand for natural gas increased by 56%. Despite growth in renewables (seen as the
top two sections in Figure 2), the main trend of recent decades has been overall growth in
almost all energy sources. (An exception is nuclear energy, with global demand declining
slightly in the 2010s.)

7
     Harto, 2020.
8
     Gearino, 2020.
9
     Nykvist and Nilsson, 2015, p. 330.
10
     McKinsey & Company, 2020.
11
     Woodward et al., 2020.
12
     Norwegian EV Policy, https://elbil.no/english/norwegian-ev-policy/.
13
     Doyle, 2020.
                                                                                                5
ENERGY ECONOMICS AND POLICY

                 Figure 2. Global Energy Demand by Source, 1965-2019

                  Source: BP Statistical Review of World Energy, various editions

Most projections indicate that global energy demand will continue to increase. The U.S. Energy
Information Administration (EIA) projects that the world’s energy demand will increase by
66% between 2020 and 2050, as shown in Figure 3. Most of this increase is expected to occur
in low- and middle-income countries, with energy demand increasing by 71% in China, 116%
in Africa, and 293% in India. Figure 3 illustrates the world’s third energy challenge – a focus
on demand-side energy management, or policies that seek to reduce energy demand (or at
least reduce the growth in demand). The projection in Figure 3 is from the EIA’s “reference
case” which is based on current national energy policies and specific assumptions about future
energy prices, technology, and economic growth. Later in the module we will consider whether
significant growth in global energy demand can be avoided through energy efficiency
improvements, energy pricing, and other policies. Efforts to slow the increase in global energy
demand should complement policies that transition the world’s energy mix away from fossil
fuels, speeding the attainment of a sustainable energy system.

supply-side energy management energy policies that seek to change the energy mix in a
society, such as switching from fossil fuels to renewables
demand-side energy management energy policies that seek to reduce total energy
consumption, such through energy efficiency improvements

                                                                                             6
ENERGY ECONOMICS AND POLICY
Figure 3. Projected Global Energy Demand 2020-205, by Country/Region
Source: U.S. EIA, 2020.
One interpretation of Figure 3 is that policy efforts should be directed toward limiting the
growth in energy demand in developing countries such as China and India. But this perspective
neglects the world’s fourth energy challenge – addressing the global disparity in access to, and
consumption of, energy. About 800 million people across the world lack access to electricity. 14
According to the World Bank, as of 2018 there are 28 countries, most in Sub-Saharan Africa,
where less than half of the population have access to electricity. 15 While the majority of
households in developed countries have access to personal vehicles, a 2015 survey found that
only 17% of households in China own a car, 6% in India, and 2% in Bangladesh.16
The global disparity in energy consumption is illustrated in Figure 4, which shows annual
energy consumption per capita in various countries. The average American consumes more
than twice as much energy as the average European, three times as much as the average
Chinese, and over 10 times as much as the average Indian. And compared to the average person
in Sub-Saharan Africa, Americans consume about 50 times as much energy.
A 2020 paper finds that the world’s lowest-income 50% consume less than 20% of all energy,
while the richest 10% consume nearly 40% of the world’s energy. The authors note that:
14
IEA et al., 2020.
15
World Bank, World Development Indicators database.
16
Poushter, 2015.
7ENERGY ECONOMICS AND POLICY
Energy provision is considered a fundamental and integral development
challenge. A minimum level of energy consumption is required to enable decent
well-being. Our results demonstrate that energy consumption is far from
equitable and varies to extreme degrees across countries and income groups. …
Many people suffer from energy deprivation and quite a few are consuming far
too much.17
Figure 4. Annual Energy Consumption per Capita in Select Countries/Regions, 2019
Source: BP Statistical Review of World Energy 2020.
Most economic studies find that access to energy is an important factor explaining long-term
economic growth.18 Thus reducing disparities in access to energy is critical to reducing global
economic inequality. The world cannot meet its first two energy challenges – transitioning to
renewables and demand-side energy management – by limiting the development aspirations of
the world’s poorest. But developing countries cannot take the same energy path that the
developed countries took, which has been heavily dependent on fossil fuels. International
cooperation between rich and poor countries will be required to ensure that developing
countries can utilize their energy resources in a sustainable manner.
In summary, the world’s four major energy challenges are:
1. The transition away from fossil fuels toward renewable energy sources needs to be
accelerated if the world is to avoid unacceptable climate change.
17
Oswald et al., 2020.
18
See, for example, Ouedraogo, 2013.
8ENERGY ECONOMICS AND POLICY
2. Expanding the world’s reliance on renewable energy will require the electrification of
most of the world’s energy system.
3. This transition needs to be accompanied by efforts to restrain the growth in energy
demand, mainly in developed countries.
4. Progress toward the other goals must coincide with a reduction in global energy
inequality, ensuring that developing countries have access to the clean energy that is
needed to increase their well-being. Accordingly, the United Nation’s Sustainable
Development Goal #7 is to “Ensure access to affordable, reliable, sustainable, and
modern energy for all.”
While these challenges are significant, as we proceed through the module we will see there
are reasons for optimism. In the next section we will discuss nonrenewable energy sources –
fossil fuels and nuclear energy. Then we will discuss renewable energy sources, including
wind, solar, and hydroelectric energy. In the final two sections we will focus on energy
economics and policies to address the world’s energy challenges.
2. NONRENEWABLE ENERGY
Nonrenewable energy sources are those that do not regenerate through natural processes, at
least on a human time scale. We consider four nonrenewable energy sources in this section:
1. Oil
2. Coal
3. Natural gas
4. Nuclear energy
The first three energy sources are fossil fuels, formed from the fossilized remains of plants and
animals that lived millions of years ago. As these energy sources are nonrenewable, one issue
to consider is the availability of supplies. Is running out of any of these sources a significant
concern? We also need to consider the environmental impacts of relying on these sources.
Average prices, along with the volatility of prices, is another important factor to consider when
evaluating different energy sources.
nonrenewable energy sources energy sources that do not regenerate through natural
processes, at least on a human time scale, such as oil and coal.
2.1 Oil
Oil is a broad term including all liquid petroleum products such as gasoline, diesel fuel, aviation
fuel, and motor oils. Oil is predominately used for transportation – currently about 95% of the
world’s energy for transportation comes from oil. 19 As an energy source for transportation, oil
offers the advantages of being easier to store than other fossil fuels and having a relatively high
19
BP, 2020a.
9ENERGY ECONOMICS AND POLICY
energy density (i.e., a high energy to weight ratio). In our evaluation of oil we consider three
main issues: oil supplies, oil prices, and environmental impacts.
From the mid-20th century until recently, many oil analysts expressed concern over limited oil
supplies. Like other fossil fuels, oil is ultimately a nonrenewable resource that is available in a
fixed global quantity. The idea of “peak oil” production states that global oil production will
eventually peak and then decline as supplies are depleted. Along with rising demand, declining
oil production would lead to rapidly rising oil prices, along with broader negative economic
and social impacts such as economic recessions and conflicts over limited oil supplies.
While the global quantity of oil is ultimately limited, new discoveries and technologies can
expand the known reserves. Current proven oil reserves are actually 2.5 times larger now than
they were in 1980, even as global oil demand has steadily increased. Proven reserves could
meet global demands for nearly 50 years at current consumption rates, and new discoveries
continue to be made.20
Given that oil supplies do not appear to be a limitation on production for the foreseeable future,
the focus in oil markets has shifted from the supply side to the demand side. As transportation
becomes less reliant on oil and more reliant on electricity and other energy sources, oil market
experts are now asking when peak oil demand, rather than peak oil production, will occur. For
example, the 2020 World Oil Outlook, published by the Organization of the Petroleum
Exporting Countries (OPEC), predicts that global demand for oil will peak sometime in the late
2030s.21 But the most stunning prediction is that peak oil demand may have already occurred!
The COVID-19 pandemic reduced global oil demand in 2020 by about 9%, and the oil company
BP (British Petroleum) has predicted that oil demand may never recover to its 2019 peak. As
one 2020 energy analysis indicates:
Until the pandemic none of the major oil forecasters had seen an
imminent demand peak. … Most analysts had only predicted declining demand
for oil in improbably green scenarios that could only be achieved with far
stronger global climate policies. … Like any forecast, only time will tell if peak
oil demand happened already or won’t come until 2040. That inescapable
uncertainty is less important than the newfound agreement that a turning point
is here.22
One of the other reasons for oil’s historical dominance in the transportation sector is that it is
normally quite affordable. But the price of oil is also highly volatile, as shown in Figure 5. We
see that after adjusting for inflation oil prices were particularly high in the late 1970s and early
1980s, and again in the late 2000s and early 2010s. More the price of oil is more difficult to
forecast than any other energy source, as the price depends not only on economic conditions
but also on political factors such as conflicts in the Middle East.
Significant uncertainty about future oil prices complicates long-term investment decisions
between energy sources. Consider, for example, a delivery business trying to decide whether
20
BP, 2020b.
21
OPEC, 2020.
22
Randall and Warren, 2020.
10ENERGY ECONOMICS AND POLICY
to purchase a fleet of delivery vehicles that operate on gasoline or electricity from renewable
energy. The business may reasonably assume the price of renewable energy will decline in the
future, but will not be able to predict the future price of oil with any certainty. Thus even if the
current price of oil is slightly higher than the price of renewable energy, a business may favor
renewables as future costs will be known with more certainty.
Figure 5. Crude Oil Prices in Constant Dollars, 1970-2020
Sources: U.S. Energy Information Administration, Crude Oil Spot Prices; U.S. Bureau of Labor
Statistics, Historical Consumer Price Index for All Urban Consumers
All fossil fuels are carbon-based, meaning they emit carbon dioxide (the main greenhouse gas)
when burned. Using fossil fuels generates local air pollutants including nitrogen oxides,
particular matter, and sulfur oxides. The environmental impacts of fossil fuels also include
habitat destruction and water pollution from mining and the damage from accidental spills.
Table 1 compares the human health impacts and greenhouse gas emissions of various energy
sources per unit of energy generated. We see that coal is the most environmentally destructive
energy source. Oil is the second most-damaging energy source per unit of energy, both in terms
of human deaths and greenhouse gas emissions. Oil is responsible for about 34% of the world’s
carbon emissions.23 While large oil spills receive a great deal of media attention, the majority
of oil that is released into coastal and marine environments comes from runoff that washes oil
from roads and parking lots and leakage from ships other than oil tankers. 24
23
Our World in Data, CO2 Emissions by Fuel, https://ourworldindata.org/emissions-by-fuel.
24
Global Marine Oil Pollution Information Gateway, http://oils.gpa.unep.org/facts/sources.htm.
11ENERGY ECONOMICS AND POLICY
2.2 Coal
Coal is the world’s second-largest source of energy, behind only oil. Coal is primarily used to
generate electricity – it provides over one-third of the world’s electricity, more than any other
source. China is by far the world’s largest consumer of coal, with 52% of global demand in
2019. China’s rapid expansion of coal consumption, particularly after 2000, is shown in Figure
6. While the United States was the world’s largest coal consumer up to 1985, it has since fallen
to third after being overtaken by China and then India in 2015. Russia and Germany rank fourth
and fifth in coal consumption, with demand less than one-third of the U.S.
Table 1. Human Health Impacts and Greenhouse Gas Emissions of Various Energy
Sources, per Unit of Energy
Human Deaths from Accidents Greenhouse Gas Emissions per
Energy Source and Air Pollution per Terawatt of Gigawatt of Energy (Tons)
Energy
Coal 24.6 820
Oil 18.4 720
Natural Gas 2.8 490
Biomass 4.6 78-230
Nuclear 0.07 3
Hydropower 0.02 34
Wind 0.04 4
Solar 0.02 5
Source: Ritchie, 2020.
Figure 6. Coal Consumption, Top Five Coal Consuming Countries, 1970-2019
Source: BP, 2020b.
12ENERGY ECONOMICS AND POLICY
Although coal is a nonrenewable resource, the world’s coal reserves are extensive. Coal is the
most abundant fossil fuel, with known reserves sufficient to meet current global demand for
more than 130 years.25 As shown in Table 1, it also the most environmentally destructive
energy source. Even though the world obtains more energy from oil than coal, coal is
responsible for 18% more CO2 emissions than oil.26 Coal is also the main source of local air
pollutants such as sulfur dioxide and nitrogen oxides. The World Health Organization estimates
that local outdoor air pollution kills over 4 million people per year, mainly from burning coal,
with over 90% of these deaths in middle- and low-income countries.27 Coal pollution is also a
significant source of premature mortality in developed countries. Each year burning coal kills
an estimated 15,000 people in the United States, and is responsible for over 10% of the
country’s health care costs.28
Prior to the COVID-19 pandemic, global demand for coal was anticipated to peak sometime
before 2030. But as a result of the pandemic, global coal demand fell by about 7% in 2020.29
Like oil, global demand for coal may never recover to pre-pandemic levels as the world
transitions toward more reliance on renewables. Projections revised in the wake of the
pandemic by the International Energy Agency show that global coal demand will recover
slightly in the short-term as economic activity increases (but not to its 2019 peak), and then
gradually decline.30 Forecasts developed by BP show global coal demand falling more rapidly
– by 25% in 2050 under a business-as-usual scenario but by 85-90% in a more aggressive
policy scenario.31
2.3 Natural Gas
Natural gas is frequently touted as a “transitional” or “bridge” fuel as societies move away
from coal and oil but are not able to expand renewable energy rapidly enough due to technical
or financial reasons. Natural gas’s main advantage over other fossil fuels is that it is generally
less environmentally damaging, as we saw in Table 1. Natural gas is more flexible than other
fossil fuels. It can be burned directly to power vehicles, heat buildings, and operate industrial
machinery. It can generate electricity more efficiently than coal, and generally at lower cost
per unit of energy.
The displacement of coal by natural gas has been facilitated by new natural gas extraction
technologies, specifically improvements in hydraulic fracturing (or “fracking”). Fracking
involves injecting water and chemicals deep underground to fracture surrounding rock,
releasing pockets of natural gas, and potentially oil as well, that are then pumped to the surface.
While fracking has been used to a limited extent for several decades, it became much more
common in several countries starting in the 2000s and 2010s. In 2000 only about 10% of the
natural gas produced in the U.S. came from fracking, but by 2015 that share rose to two-thirds.32
25
Ibid.
26
Our World in Data, CO2 Emissions by Fuel, https://ourworldindata.org/emissions-by-fuel.
27
WHO, 2018.
28
Conca, 2017.
29
IEA, https://www.iea.org/news/a-rebound-in-global-coal-demand-in-2021-is-set-to-be-short-lived-but-no-
immediate-decline-in-sight.
30
IEA, 2020a.
31
BP, 2020a.
32
U.S. EIA, 2015.
13ENERGY ECONOMICS AND POLICY
Despite (or perhaps because of) this rapid expansion, fracking is a controversial technology,
and some countries have banned the practice (see Box 2).
BOX 2. TAINTED WATER AND EARTHQUAKES LINKED TO
HYDRAULIC FRACTURING FOR NATURAL GAS
Fracking can contaminate drinking water supplies in several ways. The chemicals injected
during fracking or the natural gas extracted can leak through the well casing, normally
constructed out of steel or cement, into groundwater aquifers. Fracking wastes are temporarily
stored in above ground ponds, with toxic chemicals that can leach into drinking water supplies.
Final disposal of fracking wastes is commonly done by deep well injections, presenting another
opportunity for water contamination. A comprehensive 2016 report on fracking by the U.S.
EPA concluded that it “can impact drinking water resources under some circumstances.” 33
Regulation of fracking in the United States is largely left to the individual states, with different
requirements regarding disclosure, containment, and monitoring.
Another concern with fracking is that disposal of the wastes in deep wells increases pressure
on underground rock structures, leading to an increase in earthquakes. Fracking activities have
been linked to a 900-fold increase in earthquakes in Oklahoma starting in 2008. Four of the
state’s five largest recorded earthquakes have occurred since then. As a result of stricter
fracking regulations, the number of earthquakes in Oklahoma have fallen by about 90% from
a peak in 2015.34
Some energy analysts assert that fracking for natural gas is an important tool in reducing carbon
emissions (as compared to using coal) and can be done safely with better regulations. 35 For
example, stricter requirements for the lining of wastewater ponds can reduce leakage into water
supplies. Stronger standards for well casing construction can also reduce leaks. Other analysts
conclude that the risks of fracking outweigh any benefits, and that the practice should be
banned. Both Vermont and New York have banned fracking, along with four of Canada’s 10
provinces. Countries that have banned fracking include Germany, France, and the United
Kingdom.36
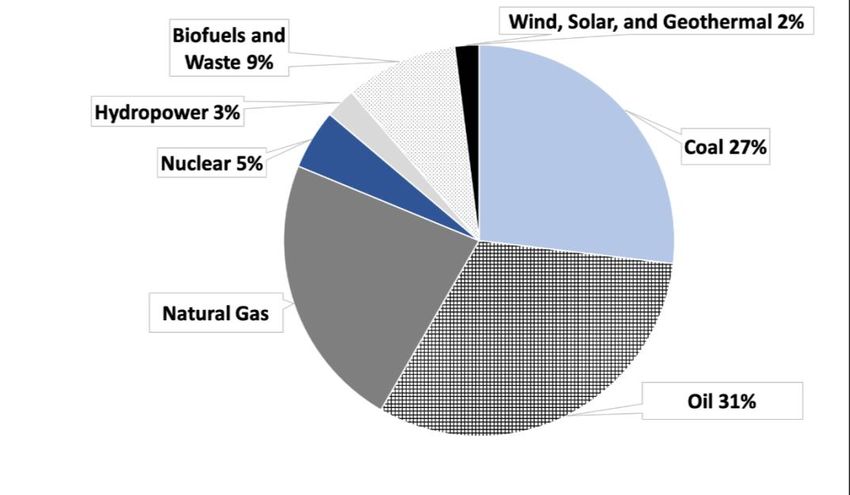
The switch away from coal toward natural gas in the United States is shown in Figure 7. Up to
about 2005 both coal and natural gas provided about one-quarter of the U.S.’s energy supply.
But as improvements in fracking technology reduced the cost of natural gas extraction, a rapid
increase in natural gas consumption coincided with a reduction in coal consumption. As the
total energy obtained from coal and natural gas has changed little since 2005, it is accurate to
say that natural gas has been directly displacing coal in the U.S. According to the International
Energy Agency, switching electricity generation from coal to natural gas reduces greenhouse
gas emissions by 50% on average.37 The displacement of coal by natural gas in the U.S. is
33
U.S. EPA, 2016.
34
Kuchment, 2019.
35
See, for example, Gold, 2014.
36
https://en.wikipedia.org/wiki/Hydraulic_fracturing_by_country.
37
IEA, 2019.
14ENERGY ECONOMICS AND POLICY
largely responsible for the country’s 14% decrease in greenhouse gas emissions from 2005 to
2019.
Figure 7. Energy Consumption in the United States, by Source, 1980-2019
Source: U.S. EIA, 2020b.
The environmental benefits of natural gas relative to other fossil fuels, however, are not always
unambiguous. Natural gas is primarily composed of methane, which is a greenhouse gas that
causes about 25 times the warming effect of an equivalent amount of CO 2. When burned,
methane is converted into CO2, but methane can be directly released to the atmosphere during
natural gas extraction and transportation by leaking production facilities and pipelines. Recent
analyses indicate that methane leakage rates are higher than previously estimated. A 2019
journal article found that methane emissions from major cities along the East Coast of the U.S.,
which rely upon natural gas for heating and electricity, are more than twice the levels reported
by the U.S. Environmental Protection Agency. 38 Methane monitoring by satellites has recently
revealed several large pipeline leaks, including along the Yamal pipeline that supplies natural
gas to Europe from Siberia, and from facilities in Northern Africa. A leak identified in
Turkmenistan in 2019 is the largest on record, releasing greenhouse gases equivalent to one
million cars.39
The other concern with switching to natural gas as a transitional energy source is that it
postpones the adoption of renewable energy. Though natural gas is generally “greener” than
coal or oil, it is clearly more environmentally damaging than renewables (see Table 1). As a
2020 paper explains:
38
Plant et al., 2019.
39
Nasralla, 2020.
15ENERGY ECONOMICS AND POLICY
Although natural gas might help the energy transition by reducing emissions
compared to coal, there are other long-term implications of investing in natural
gas which can work against reaching climate goals. One concern is that
investments in natural gas might crowd out investments in renewable
alternatives. … Our research warns that natural gas’ negative delayed and global
effects can easily outweigh the positive immediate and local effects unless
precautions are taken.40
Further, natural gas’s role as a transitional fuel rests on the assumption that it should be used
until renewable energy technologies develop to the point where they can be widely deployed
and cost competitive. As will see shortly, renewable energy technologies have progressed much
faster than anticipated, leading to dramatic price reductions. The role of natural gas as a
transitional fuel thus appears unnecessary, as a direct transition from all fossil fuels to
renewable energy becomes more feasible.
2.4 Nuclear Energy
The final nonrenewable energy source we consider is nuclear energy. Nuclear is a
nonrenewable energy source as its fuel, normally plutonium or uranium, is a nonrenewable
mineral. In the 1950s nuclear power was promoted as a safe, clean, and cheap source of energy.
Proponents of nuclear power stated that it would be “too cheap to meter” and predicted that
nuclear power would provide about one-quarter of the world’s commercial energy and most of
the world’s electricity by 2000. 41
Currently, nuclear power provides only about 4.9 percent of the world’s primary energy
consumption and about 10 percent of the world’s electricity. Most of the world’s installed
nuclear power capacity predates 1990. The decommissioning of older plants, which had an
expected lifespan of 30 to 40 years, has already begun. Recently, however, some people have
called for a “nuclear renaissance,” mainly because carbon emissions from the nuclear power
life cycle are much lower than with fossil fuels (see Table 1).
The catastrophic 2011 Fukushima accident in Japan caused many countries to reconsider their
nuclear power plans. Japan is currently re-evaluating its use of nuclear power, with most of its
reactors sitting idle. Germany has decided to phase out the use of nuclear power entirely by
2022. In Italy, the debate over nuclear power was put to voters, with 94 percent rejecting plans
for an expansion of nuclear power. But other countries are moving ahead with plans to expand
their use of nuclear power, particularly China. Currently 11 nuclear plants are under
construction in China. Other countries currently expanding use of nuclear power are India,
Russia, and South Korea.
The role of nuclear power in the future global energy mix thus remains uncertain. The
Fukushima accident has lowered baseline projections of future energy supplies from nuclear
power. While some see the accident as evidence that we need to focus more on renewables like
wind and solar, others worry that a decline in nuclear power will make it more difficult to meet
40
Gürsan and Gooyert, 2020, p. 1.
41
Miller, 1998.
16ENERGY ECONOMICS AND POLICY
climate targets. Despite the initial promise of affordable nuclear energy, the cost of building
and operating nuclear power plants has generally increased, while the cost of renewable energy
has declined. Ultimately, economic factors, rather than safety concerns, may present the main
barrier to a nuclear renaissance. As a 2018 MIT report explains:
we contend that, as of today and for decades to come, the main value of nuclear
energy lies in its potential contribution to decarbonizing the power sector.
Further, we conclude that cost is the main barrier to realizing this value. Without
cost reductions, nuclear energy will not play a significant role. 42
3. RENEWABLE ENERGY SOURCES
Renewable energy sources are those that are supplied by nature on a continual basis. They are
clearly less environmentally damaging than fossil fuels, both in terms of air and water pollution
and greenhouse gas emissions (see Table 1). That doesn’t mean renewable energy isn’t without
negative environmental impacts, including damage to river habitats from hydroelectric dams,
bird deaths from wind turbines, and land degradation from mining minerals for solar panels. 43
renewable energy sources energy sources that are supplied on a continual basis, such as wind,
solar, water, and biomass energy
In one sense, renewable energy is unlimited, as supplies are continually replenished through
natural processes. The total amount of energy embodied in renewable sources is also extremely
abundant. The world’s current electricity demands could be entirely met by installing wind
turbines on an area smaller than Spain. 44 Even more impressive, enough solar energy reaches
the earth in a single day to power the planet for an entire year! 45 But solar energy and other
renewable energy sources are limited in the sense that their availability varies geographically
and across time. Some regions of the world are particularly well suited to wind or solar energy.
For example, solar energy potential is highest in areas such as the southwestern United States
and northern Africa. Geothermal energy, energy from the heat of the earth, is abundant in
countries such as Iceland and the Philippines.
A further limitation with renewable energy is that its embodied energy is much less
concentrated than for fossil fuels. Consider that the energy density, or the amount of energy
stored within a given weight, of gasoline is about 100 times higher than the energy density of
the electricity stored in a lithium-ion battery in an electric car. 46 Renewable energy sources are
also intermittent – the wind isn’t always blowing and the sun isn’t always shining. This
suggests that either renewable energy needs to be supplemented with another source, such as
natural gas, in order to provide a continuous supply of energy, or that renewable energy needs
42
Buongiorno et al., 2018.
43
See, for example, UCS, 2013a.
44
Garfield, 2016.
45
Chandler, 2011.
46
Schlachter, 2012.
17ENERGY ECONOMICS AND POLICY
to be stored in batteries to make up for the times when the energy flow isn’t sufficient to meet
demand.
Perhaps renewable energy’s main historical weakness compared to fossil fuels has been price.
For example, in 2009 the cost of electricity from solar panels was about three times higher than
for coal.47 But the price of renewable energy has been declining dramatically, making
comparisons that are even a few years old obsolete. Rather than being uncompetitive in price,
renewable energy is increasingly achieving a price advantage over fossil fuels that will make
an energy transition inevitable. Other limitations of renewable energy are also being addressed
with improvements in technology, such as higher energy density in batteries and wind turbine
designs that reduce the threat to birds.
We now consider various renewable energy sources, focusing on wind and solar power. We
will discuss each source’s advantages and disadvantages, along with relevant trends.
3.1 Wind Energy
For hundreds of years humans have harnessed wind energy to perform tasks such as pumping
water and grinding grain. Modern wind turbines, some more than 500 feet tall, generate
electricity by spinning a geared generator. Wind energy currently provides about 1% of the
world’s energy total supply, and about 5% of its electricity.
Wind energy can be harnessed from onshore and offshore turbines. Onshore wind energy is
generally cheaper. Onshore turbines are easier to access for maintenance and repairs, and less
subject to damage from severe storms and salt water. On the other hand, winds tend to be
stronger and more consistent offshore. As some people consider onshore wind turbines
unsightly, offshore turbines may be more aesthetically acceptable, especially if they are located
far offshore. Offshore wind turbines are less likely to harm bird populations, although the
number of birds killed by onshore wind turbines is rather low. According to a 2015 journal
article, collisions with vehicles kill 350 times as many birds as wind turbines. Domestic cats
are the largest source of bird mortality, killing over 4,000 times as many as wind turbines. 48
As mentioned above, wind energy is more abundant in certain regions of the world, such as the
central United States, northern Europe, Russia, and southern South America. 49 China has the
most installed wind energy, with 36% of the world’s capacity. Other top wind energy countries
include the United States (16%), Germany (9%), and India (6%). 50
As wind energy technologies have improved costs have declined and installed capacity has
increased, as shown in Figure 8. From 2000 to 2019 the global capacity of wind energy has
increased by a factor of 36. During the same period, the cost of generating electricity from wind
has declined by 63%.
47
Lazard, 2018.
48
Loss et al., 2015.
49
Lu et al., 2009.
50
https://en.wikipedia.org/wiki/Wind_power_by_country.
18ENERGY ECONOMICS AND POLICY
Figure 8. Global Wind Energy Installed Capacity and Average Cost, 2000-2019
Sources: Capacity data from BP, 2020b. Cost data from IRENA, 2019b.
Although wind energy currently produces a relatively small share of the world’s energy, it is
the fastest-growing energy source in many countries, including the United States. 51
Considering only the new energy capacity installed globally in 2019, about 25% was wind
energy.52 This suggests that the share of energy obtained from wind will continue to increase,
as we will discuss further later in the module.
3.2 Solar Energy
While there are several ways to convert solar energy into electricity, photovoltaic (PV) cells
(i.e., solar panels) are the most common. PV cells transfer solar energy to electrons, creating
an electrical current. Solar energy currently provides only 0.5% of the world’s total energy and
3% of the world’s electricity.
photovoltaic (PV) cells devices that directly converts solar energy into electricity (i.e., solar
panels)
Solar panels, like wind turbines, are often arrayed in large “farms”. But unlike wind turbines,
solar panels can also be employed at smaller scales, such as on household roofs. In general,
51
EIA, 2019b.
52
Bloomberg NEF, 2020.
19ENERGY ECONOMICS AND POLICY
larger “utility-scale” solar energy is more efficient and less costly than residential-scale solar.
But household solar has become increasingly popular, appealing to many people as a way of
avoiding dependence on grid electricity. Smaller-scale solar projects can also reach areas not
connected to modern energy infrastructure.
The potential for solar energy tends to be greatest in equatorial and arid regions, including the
Middle East, most of Africa, Australia, and desert regions in the United States and Central
America. China is the world’s leader in solar power, with about one-third of the world’s
capacity. Other leading solar countries include the United States (12%), Japan (10%), Germany
(8%), and India (7%).53
Solar energy is a particularly appealing option for addressing energy needs in developing
countries. Low-income countries tend to have relatively abundant solar resources. A 2020
report by the World Bank found that many of the world’s poorest countries are also those with
the highest solar potential, including Namibia, Lesotho, Afghanistan, and Sudan.54 Solar panels
can be installed in remote rural areas not connected to existing energy infrastructure such as
power lines and gas pipelines. As a 2018 paper explains:
[For developing] countries, particularly the poorest ones, modern energy is
necessary to stimulate production, income generation and social development
plus reduce the serious health issues that are caused by the use of fuelwood,
charcoal, animal dung and agricultural waste. Solar energy is the best answer to
energy poverty and it can provide excellent opportunities for reduction of GHG
emissions and indoor air pollution through substituting kerosene for lighting
and firewood for cooking. Solar photovoltaic (PV) can be an appropriate
technology for a source of renewable electricity in developing nations especially
in remote rural areas where grid extensions are financially or technically not
viable.55
The World Bank’s Lighting Africa has provided energy to 32 million people by 2020, primarily
through the development of solar powered “mini-grids” connecting several homes. Households
then pay for the electricity they use at subsidized rates.56 China has made large investments to
provide solar power to low-income rural areas of the country. Their Solar Energy for Poverty
Alleviation Program (SEPAP) seeks to provide solar power to about 35,000 remote villages. A
2020 journal article finds that the SEPAP program has a positive and significant effect on
income levels in the years after solar panels are installed in a village. The potential for solar
power to alleviate poverty under the SEPAP program is the largest in the poorest regions. 57
Particularly when compared to fossil fuel energy, the environmental impacts of solar energy
are minimal. The main environmental impacts of solar power include the land used to install
PV panels and the impacts of producing the panels. Unlike wind power, where land can be used
simultaneously for energy and agricultural production, land used for large-scale solar farms
53
https://en.wikipedia.org/wiki/Solar_power_by_country.
54
World Bank, 2020a.
55
Shahsavari and Akbari, 2018, p. 275.
56
World Bank, 2020b.
57
Zhang et al., 2020.
20ENERGY ECONOMICS AND POLICY
generally cannot be used for agricultural purposes. PV panels are largely constructed of silicon,
a mineral that can harm mining workers when breathed in small particles. Large-scale mining
of silicon can also decrease biodiversity and create air and water pollution. Toxic materials
such as hydrochloric acid are used in the production of PV panels. Proper environmental
regulation can mitigate these impacts.
No other energy source has seen such dramatic changes in prices and installed capacity in the
past decade as solar. As PV technology rapidly improves, the cost of solar energy has
plummeted. As shown in Figure 9, the cost of solar energy has decreased by more than 90%
since the late 2000s (the increase in solar energy costs in the mid-2000s was due to a temporary
shortage of silicon). Solar energy is world’s fastest-growing energy source, with global
capacity up by a factor of 900 from 2000 to 2010.
Figure 9. Global Solar Energy Installed Capacity and Average Cost, 2000-2019
Sources: Capacity data from BP, 2020b. Cost data from Lazard, 2020 and Shahan, 2014.
As recently as 10 years ago solar energy was widely considered a niche product that was
heavily dependent on subsidies. Now, with costs rapidly declining, solar energy is poised to
dominate energy markets in the coming decades. Nearly half (45%) of all new energy installed
globally in 2019 was solar.58 And while the expansion of solar energy is a critical tool in
addressing climate change and air pollution, the primary driver of solar energy’s growth is cost.
58
Bloomberg NEF, 2020.
21ENERGY ECONOMICS AND POLICY
As we will see in Section 4 solar energy has now become, on average, the world’s cheapest
energy source.
3.3 Other Renewable Energy Sources
Other sources of renewable energy include hydroelectricity, biomass, and geothermal.
Hydroelectricity (or hydropower) involves using the energy from moving water to spin an
electric turbine. Most commonly turbines are installed inside a dam that creates a reservoir of
water behind it. The passage of water through the dam and turbines is regulated, producing a
relatively reliable, constant supply of electricity. Hydropower currently provides about 3% of
the world’s energy.
hydroelectricity (or hydropower) using the energy from moving water to spin an electric
turbine and generate electricity
Hydropower offers a number of advantages. First, it doesn’t create local air pollution or direct
carbon emissions. While building a hydroelectric dam entails a significant capital investment,
its low operating costs make hydropower one of the lowest-cost energy sources on a lifecycle
basis. Hydropower doesn’t suffer from the intermittency problems of wind and solar energy;
hydroelectric dams operate continuously. Dams reduce flooding and can provide a reliable
supply of water for irrigation and municipal needs. Finally, reservoirs can provide recreation
benefits such as boating and swimming.
Despite these benefits, the amount of energy generated globally from hydropower is not
expected to grow significantly in the future due to its drawbacks. Hydropower dams block the
natural flow of rivers, which degrades aquatic habitats. Migrating fish species such as salmon
are particularly affected as dams block their movement upstream to spawn. Dams also block
the downstream flow of sediment, which builds up behind dams. This not only impacts aquatic
species, it also reduces the storage capacity of the reservoir and can affect the operation of
turbines. Finally, many of the best locations for hydropower dams have already been
developed, especially in the United States and Europe. Besides large dams, other types of
hydropower are available with lower environmental impacts, including “run of river”
installations that store little to no water in reservoirs and wave and tidal plants in coastal areas.
While these technologies appear worthwhile in certain locations, they are not expected to
provide a significant share of the world’s future energy.
Biomass energy is a broad term referring to the burning of plant or animal material to generate
heat or electricity. It includes burning wood or animal dung for cooking, using ethanol made
from corn to power a vehicle, and burning agricultural wastes to generate electricity. Biomass
currently provides about 9% of the world’s energy.
biomass energy generating heat or electricity from burning plant or animal material
Biomass energy is a renewable resource with some advantages but also some significant
disadvantages. Many low-income households in developing countries, without affordable
access to electricity or fossil fuels, rely on biomass for cooking and heating. Some materials
used for biomass energy, such as crop residues and animal dung, can be considered waste
22ENERGY ECONOMICS AND POLICY
materials and thus a “free” energy source. Biomass energy can also allow a country to reduce
its dependence on imported energy.
Biomass energy is sometimes touted as being carbon neutral. For example, the CO 2 emissions
from a wood-burning electricity plant can in theory be offset by planting new trees that will
eventually absorb a similar quantity of CO2. But numerous scientific papers have found that
increasing our reliance on biomass energy will result in a significant net increase in carbon
emissions.59 One problem is that there is no assurance that enough new biomass will be created
to fully offset current carbon emissions. A second problem is timing – even if current carbon
emissions are fully offset by future biomass absorption, in the interim that atmospheric carbon
will contribute to climate change. When standing forests are cut, the resulting surge in carbon
emissions will last for fifty years or longer, even if the forest eventually regrows.
Burning biomass also emits local air pollutants such as carbon monoxide, nitrogen oxides, and
particulate matter. This is particularly unhealthy when biomass is burned indoors without
adequate ventilation. The World Health Organization estimates that 1.6 million people die each
year in developing countries from indoor burning of biomass, with over half of these deaths
being children.60
Finally, geothermal energy is energy from the subsurface heat of the earth. In some locations,
this heat reaches the surface as hot water or steam. In other locations, wells can be drilled to
tap into geothermal reservoirs. Geothermal energy can be used directly to heat water and
buildings, or used to generate electricity, normally by using steam to power an electric turbine.
Geothermal energy currently provides less than 1% of the world’s energy.
geothermal energy energy from the subsurface heat of the earth.
The main limitation of geothermal energy is that it is cost-effective only in certain regions of
the world. One country with extensive geothermal resources is Iceland, which relies on it for
about half of its total energy supply, including almost all its heating needs. While the world’s
geothermal resources are mostly untapped, further development of geothermal is normally not
the lowest-cost or least environmentally-damaging energy source. Per unit of energy generated,
geothermal energy tends to emit more carbon than solar or wind energy. 61 Tapping into
geothermal reservoirs can also release air pollutants such as hydrogen sulfide and ammonia.
Another concern with developing geothermal sites is that it may increase the risk of
earthquakes.62
59
Catanoso, 2020.
60
WHO, Indoor Air Pollution and Household Fuels,
https://www.who.int/heli/risks/indoorair/en/#:~:text=Indoor%20air%20pollution%20generated%20largely,u
nder%20five%20years%20of%20age.
61
Li, 2013.
62
UCS, 2013b.
23ENERGY ECONOMICS AND POLICY
4. ENERGY ECONOMICS: CURRENT ANALYSES AND
ALTERNATIVE FUTURES
The main reason that fossil fuels currently provide over 80% of the world’s energy is that they
have historically been cheaper than other energy sources. But the economics of energy is
changing rapidly – more rapidly than most energy experts have predicted. Energy cost
comparisons from just a few years ago, which showed that fossil fuels had a clear cost
advantage over renewables, are now obsolete. Various economic analyses in 2020 reached the
stunning conclusion that “the era of cheap wind and solar has arrived.” 63
4.1 Cost Comparisons of Energy Sources
Comparing the costs of different energy sources is not straightforward. Capital costs vary
significantly—a new nuclear power plant can cost $5 billion to $8 billion. Some energy sources
require continual fuel inputs, while other sources, such as wind and solar, only require
occasional maintenance. We also need to account for the different lifespans of various
equipment and plants.
Cost comparisons between different energy sources are made by calculating the levelized cost
of obtaining energy. Levelized costs include the present value of building and operating a plant
over an assumed lifetime, expressed in real terms to remove the effect of inflation. For energy
sources that require fuel, assumptions are made about future fuel costs. The levelized
construction and operations costs are then divided by the total energy obtained to allow direct
comparisons across different energy sources.
levelized costs the per-unit cost of energy production, accounting for all fixed and variable
costs over a power source’s lifetime.
Figure 10 presents a 2020 comparison of the levelized costs using various energy sources to
generate electricity, without any subsidies. The horizontal bars show the typical range of
levelized costs worldwide for new energy construction. We see that utility-scale solar and wind
energy is clearly cheaper than new nuclear energy, and cheaper than new coal plants in most
cases. On average, solar and wind energy is also cheaper than constructing new natural gas
plants. In other words, solar and wind energy are now, on average across the world, the two
cheapest energy sources, without any subsidies.
63
Fieber, 2020.
24You can also read