ENERGY PRICES IN EUROPE: (A COSTLY) WINTER IS COMING - Euler Hermes
←
→
Page content transcription
If your browser does not render page correctly, please read the page content below

ALLIANZ RESEARCH

 ENERGY PRICES IN EUROPE:
(A COSTLY) WINTER IS COMING
11 October 2021

                                  Pent-up demand, tight supply, green policy and bad timing are the
                                  recipe for skyrocketing energy prices, which could take three to six
                                  months to cool down. Europe is particularly at risk due to low stocks
                                  and its high dependence on natural gas. In recent weeks, energy prices
 ANO KUHANATHAN
 Sector Advisor
                                  and especially natural gas prices have surged sharply (see Figure 1),
 ano.kuhanathan@eulerhermes.com   prompting countries to reactivate coal-fired electricity generation. This has
                                  caused carbon prices to spike in turn.

                                  Figure 1 – Energy prices (January 2021 = 100)
                                    700
                                                         Natural gas NL TTF
                                    600                  London Natural Gas
                                                         Brent
                                    500                  APX Electricity NL
                                                         EEX-EU CO2 Emissions
                                                         Coal ICE API2
                                    400

                                    300

                                    200

                                    100

                                      0
                                      Jan-21             Apr-21              Jul-21        Oct-21

                                  Sources: Refinitiv, Euler Hermes, Allianz Research

                                  The shock comes from a combination of demand and supply factors. From
                                  a demand perspective, the strong global recovery is pushing up demand
                                  for electricity and fuels. Moreover, after a quite severe winter 2020/2021 in
                                  the Northern hemisphere, inventories of liquefied natural gas (LNG) were
                                  left at low levels and now countries are rushing to restock in order to
                                  prepare for colder weather. To add to this, China has also decided to
                                  implement new environmental regulations that have further raised
                                  demand and encouraged firms to stock up on LNG.

                                  On the supply side, in the US, about 40% of gas supply had been taken out
                                  in the aftermath of hurricanes. Although Russia has been fullfiling its
                                  contractual obligations on its long-term agreements, it has been keeping
                                  a lid on exports because it needs to restock massively for winter before
                                  increasing supply to global markets (see Figure 2). And global trade
                                  remains constrained due to limited shipping and port capacities across the
                                  globe.
                                                                                                                  1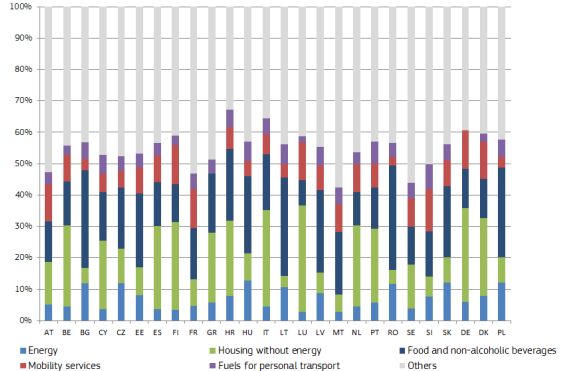
Figure 2 – Russia gas inventories (BCM)
80
72.6
70
60
50
40 37.1
30
20
11.7
10
0
April 2021 June 2021 Target for October
Sources: Gazprom, Bloomberg, Euler Hermes, Allianz Research
Compounding the problem are several adverse events occurring at the
same time:
Some nuclear plants are under maintenance in the UK and
Germany.
Europe is seeing lower wind power generation (see Figure 3),
leaving countries such as the UK or Spain short of several GW of
power.
In Brazil, rivers are at extremely low levels, which is a disaster for
hydropower generation.
Figure 3 – Wind power generation in Europe
30000
GW
25000
20000
15000
10000
5000
0
OECD Europe - Wind power
June 2019 June 2020 June 2021
Sources: IEA, Euler Hermes, Allianz Research
Europe is losing the bidding war and late to restocking. Surging natural
gas prices are a particularly big challenge for Europe as the region
depends heavily on imports (see Figure 4). But Asian countries, which lack
the EU’s pipeline supplies and are thus desperate to restock, have been
winning the bidding war on LNG shipments. China in particular appears
willing to stock up on gas “no matter the cost”. Consequently, while many
non-EU countries have managed to recover stocks levels close to Q3 2020
or even higher in the case of UK, the EU is still 25pp below full storage
capacity (see Figure 5).
2Figure 4 – Share of imports in consumption for energy and gas
160
140
120
100
80
60
40
20
0
-20
Energy Natural gas
Sources: Eurostat, Euler Hermes, Allianz Research
Figure 5 – Gas storage filling for the EU and the UK (%)
100
90
80
70
60
50
40
30
20
10
0
J F M A M J J A S O
2021-EU 2020-EU 2021-UK 2020-UK
Sources: GIE-AGSI, Euler Hermes, Allianz Research
We expect natural gas prices to peak by spring 2022 in a range
between EUR110 and EUR130 (Natural Gas TTF NL 1st Future
Monthly), depending on the intensity of winter. Should it be very cold in
the Northern hemisphere, we could see further temporary surges on
energy commodities and power markets. But even if the winter is mild,
countries could be inclined to restock as a precautionary measure. Overall,
we believe demand should remain strong until spring 2022. In the US, the
Energy Information Agency already forecasts a sharp increase of propane
demand this winter, especially in the Midwest. From a supply perspective,
Nord Stream 2, even if approved swiftly, would take at least four to five
months to ramp up towards significant capacity. The phasing out of OPEC
quotas will also provide downward pressure to energy commodities but
will only be (almost) complete by May 2022. In addition, China has recently
decided to restart some coalmines, but again reserves will replenish at a
slow pace.
3Figure 6 – Natural gas price forecast (euros)
160
140
120
100
80
60
40
20
0
Natural Gas TTF NL Baseline
Severe winter Mild winter
Sources: Refinitiv, Euler Hermes, Allianz Research
Nevertheless, we do not expect a prolonged energy crisis, mostly because
supply will eventually normalize and, most importantly, in most areas
demand is seasonal and will fall in the spring. In Europe, for instance,
natural gas consumption decreases sharply each year in April (see
Figure 7).
Figure 7 – Natural gas consumption in the EU (terajoule)
2000000
1800000
1600000
1400000
1200000
1000000
800000
600000
400000
200000
0
Jan-08 Jan-10 Jan-12 Jan-14 Jan-16 Jan-18 Jan-20
Sources: Refinitiv, Euler Hermes, Allianz Research
The futures market is also pointing towards a price consolidation: The
current spot price for gas has decoupled from market expectations 12
months from now. In other words, markets are in a strong backwardation
mode and suggest a normalization starting in Q2 2022 by about 30% (see
Figure 8).
4Figure 8 – Natural gas spot, futures and cross-correlation
Spot Future 12M
15
12
9
6
3
0
2000 2002 2004 2006 2008 2010 2012 2014 2016 2018 2020 2022
Rolling Coefficient spot vs. futures; 6M
1.2
1.05
0.9
0.75
0.6
2000 2002 2004 2006 2008 2010 2012 2014 2016 2018 2020 2022
Sources: Refinitiv, Euler Hermes, Allianz Research
While we do not expect any disruption in industries, the energy sector
could see higher insolvency risk, especially in the UK but also in
Germany. In the EU, natural gas is mostly consumed by industry and
households (see Figure 9). From a sector point of view, some segments of
manufacturing such as food, paper, chemicals, metals or refining activities
are quite energy-intensive and large consumers of natural gas. Based on
our previous research on European firms’ pricing power1, refined oil
products and the food sector should remain rather immune to current
developments. They have improved profitability in recent years and have
sufficient pricing power to offset higher input prices. Iron and steel should
also fare quite well as their end market should prove resilient. Eurozone
automotive manufacturers have regained pricing power, thanks to the
chip shortage2 and could pass on higher prices and the construction sector
also benefits from strong pricing power.
Figure 9 – Breakdown of final natural gas consumption in the EU
Sources: Eurostat, Euler Hermes, Allianz Research
However, small utility companies have already seen financial stress,
particularly in the UK. In a very fragmented market (see Figure 10), a
number of small UK distribution companies, which buy power on the
1
See our report “Pricing superpowers: Which sectors have them in the Eurozone?”
2
See our report “Chip shortages to boost carmakers’ pricing power in Europe”
5wholesale market and sell it to final clients but did not hedge their supply
while offering guaranteed low prices to customers, have requested
government support. As the government has refused to act, some will likely
go bust. In a normal year, about seven to eight power distribution
companies file for bankruptcy in the UK; as of October 2021, eight have
already done so and the count will likely go higher. However, this situation
is not a direct consequence of fragmentation. Other markets are also very
fragmented but market participants are managed more responsibly, have
the ability to pass on price increases and/or are under a tighter regulatory
framework. For example, in Spain, although the market is highly
concentrated and there are many small local actors, because most
consumers are on dynamic contracts (which allows for daily price revision),
they are not in the same situation as small distributors in the UK.
Germany’s market structure is similar to that of the UK’s as it chose to
liberalize the energy sector in order to create choice for consumers and
dismantle monopolies. In addition, there are no utility price caps in
Germany and households buy energy in a mostly unsupervised market. As
power futures are at very high levels, some distributers and suppliers with
fragile cash positions could run into liquidity issues or even become
insolvent in the coming months. And as in the case of UK, firms will not be
able to rely on policy support: Recently the Bundesnetzagentur (BNetzA),
the German energy regulator, said it was not its role to monitor
procurement strategies or pricing mechanisms.
Figure 10 – Power suppliers by countries (2018)
Spain 231
UK 91
Germany 91
Italy 90
France 44
Portugal 29
Belgium 21
0 50 100 150 200 250
Sources: Vlados et al. (2019), Euler Hermes, Allianz Research
Households will take most of the hit from higher energy prices, and
France, Italy and Spain are firefighting with strong support. While
households in Germany and Eastern European spend more on energy
than those in France, Italy or Spain (see Figure 11), higher prices pose a
problem for poorer households across the EU. According to the European
Commission, on average in the EU, the lowest income decile households
spent 8.3% of their revenues on energy in 2018, while middle-income decile
households spent only 6.3%. Higher energy prices also pose an inflationary
risk as the energy component accounts for almost 11% of CPI in Germany
and Spain and about 9% in the Eurozone HICP.
6Figure 11 – Breakdown of household consumption in Europe
Sources: European Commission – DG ENER, Euler Hermes, Allianz Research
In response, France, Italy and Spain are reacting strongly with policy
support as the matter is socially sensitive (see Table 1). The UK and
Germany have not reacted as strongly, though in the latter support
measures could be implemented after the new government is formed.
Table 1 – Policy support in Europe
P rice Specific new
Measures
caps financial aid
- Freeze on gas prices, a cap at +4% on the increase of
electricity prices.
France a a - 5.8mn households to receive a “one-off energy check” of
EUR100.
- Potential support against gasoline price increase.
No measures yet, some support could be implemented after the
Germany r r new government is formed.
- Announcement of a EUR3bn raid on energy companies'
profits to support households.
Spain a a - VAT on energy will fall from 21% to 10% until the end of the
year, and the special electricity tax will decrease from 5.1% to
0.5%.
- Spent €1.2bn to mitigate the surge in power prices in Q2 and
potential new round.
Italy a a - Intervention limited the increase in electricity prices to +9% vs
+20% before.
- Price cap increased by 12% vs +50% rise in energy costs over
the last six months.
UK a r - No new financial support, some specific aid already in place.
- Disconnections have been suspended, prepayment customers
can get emergency credit.
Source: Euler Hermes, Allianz Research
The current crisis could create political momentum for reforming the EU
energy market and designing an energy strategy for Europe via
markets and/or strategic alliances, especially as the green transition
will create rising volatility in energy markets. According to IRENA,
electricity production needs to double to support the green transition and
renewables need to grow substantially to meet greenhouse gas reduction
7targets (see Figure 12). Nevertheless, renewable energies are electricity-
generation sources that are difficult to manage as smart grids and storage
capacities are still inadequate and the current approach is to install
overcapacities and use curtailment to match grid demand. As climate
change could make extreme weather events more frequent and could
change long-term wind cycles, we should expect more volatility in power
supply in the future. This speaks for the need of huge investments in the
necessary infrastructure; in particular, sector coupling is a promising path
to tackle the storage problem. In the meantime, however, in case of
frequent power crunches, should carbon prices remain relatively low, we
could even see setbacks in terms of greenhouse gas emission targets as
electricity producers would switch to coal or oil – what we see happening
today. This could be even more acute as Europe has been underinvesting
in natural gas facilities despite natural gas being the fossil fuel with the
lowest carbon footprint.
Figure 12 – Electricity generation by type (%)
100
90
80
70
60
50
40
30
20
10
0
2019 2050
Manageable Non-manageable
* Manageable includes fossil fuel generation and nuclear
Sources: IRENA, Euler Hermes, Allianz Research
France and Spain both back an overhall of European electricity markets
by revamping the marginal system, which pegs the next day's final power
price to the most expensive fuel needed to meet anticipated demand. This
should help crack down on speculation and ensure greater accuracy in
pricing. Spain has also demanded a common EU approach, including
natural gas purchases to counteract vendors’ market power and the
building of strategic reserves. Luxembourg and France also back a
possible return to long-term gas supply contracts to ensure price stability,
which would demand a shift in the Commission's current policy.
European countries made the mistake of thinking that pipelines alone
were sufficient to secure gas supply from Russia. Yet, the recent months
have shown that countries with strong strategic vision and purchasing
power were able to squeeze Europe out of supply. In order to avoid future
energy crises and resorting repeatedly to emergency spending to support
households, Europe needs to design and implement a proper energy
strategy. This could be done using market instruments to hedge price
volatility and secure supply or by making strategic alliances with large
exporting countries such as Russia, Qatar, Australia or the US.
8These assessments are, as always, subject to the disclaimer provided below.
FORWARD-LOOKING STATEMENTS
The statements contained herein may include prospects, statements of future expectations and other forward -looking
statements that are based on management's current views and assumptions and involve known and unknown risks
and uncertainties. Actual results, performance or events may differ materially from those expressed or implied in such
forward-looking statements.
Such deviations may arise due to, without limitation, (i) changes of the general economic conditions and competitive
situation, particularly in the Allianz Group's core business and core markets, (ii) performance of financial markets
(particularly market volatility, liquidity and credit events), (iii) frequency and severity of insured loss events, including
from natural catastrophes, and the development of loss expenses, (iv) mortality and morbidity levels and trends, (v)
persistency levels, (vi) particularly in the banking business, the extent of credit defaults, (vii) interest rate levels, (vi ii)
currency exchange rates including the EUR/USD exchange rate, (ix) changes in laws and regulations, including tax
regulations, (x) the impact of acquisitions, including related integration issues, and reorganization measures, and (xi)
general competitive factors, in each case on a local, regional, natio nal and/or global basis. Many of these factors may
be more likely to occur, or more pronounced, as a result of terrorist act ivities and their consequences.
NO DUTY TO UPDATE
The company assumes no obligation to update any information or forward -looking statement contained herein, save
for any information required to be disclosed by law.
9You can also read