EPA's Final 111(d) Emission Guidelines - Stakeholder Meeting Iowa DNR Air Quality Bureau September 9, 2015 - Iowa Department of ...
←
→
Page content transcription
If your browser does not render page correctly, please read the page content below

EPA’s Final 111(d) Emission Guidelines
             Stakeholder Meeting
         Iowa DNR Air Quality Bureau
             September 9, 2015
EPA’s Final 111(d) Emission Guidelines

    • Key Changes between the proposed and final guidelines

        – Iowa’s 2030 and Interim Goals

        – Summary of Best System of Emission Reductions (BSER)

        – Plan Pathways

2
Key Changes to EPA’s Final CPP Rule
    Topic                Change
    Timing               Interim compliance period extended 2-years, starting in 2022.

    Initial compliance   EPA has added three stepped goals for interim compliance period:
                         2022-2024, 2025-2027, 2028-2029
    Baseline             Still 2012, but with some adjustments (such as outages) for some states – (none for Iowa)

    Emission Limit       Best System of Emission Reduction (BSER) now a performance rate determined using a
    Approach             regional basis based on NERC electricity interconnections.
    Emission Limit       Includes heat rate improvement, increased existing NGCC dispatch, and renewables.
    Basis                Adds new utility-scale renewables based on potential beginning in 2013.
                         EPA removed existing nuclear and energy efficiency.
    Goal Type            Emission rate (lbs./CO2 Net-MWh) or EPA-determined mass cap (tons).

    Early reduction      EPA added the Clean Energy Incentive Program (CEIP) to incentivize early investments that
    credits              generate wind and solar power or reduce end-use energy demand during 2020 and 2021
    Reliability          EPA requires demonstration in state plan that reliability was considered and provides safety
                         valve for unforeseen emergencies.

3
                                                                                                                        3
Timeline
    • Interim compliance period starts two years later, in 2022.

                State Plan                     Interim
                                             Compliance                 Final Goal
               Development
               and Approval                 (2022 – 2029)                 (2030)

     •   State Plan or Initial      •   Must meet interim goal   •   Compliance begins
         Submittal 9/6/16               on-average over 8-year       1/1/30
     •                                  period, plus interim
         Progress Update for                                     •   Ongoing 2-year
         states with extensions         steps:
                                                                     compliance periods:
         9/6/17                          Step 1 (2022-2024)
                                                                      Period 1 (2030-2031)
     •   Final Plan submittal for        Step 2 (2025-2027)
                                                                      Period 2 (2032-2033)
         states with extensions          Step 3 (2027-2029)
                                                                      Period 3 (2034-2035)
         9/6/18                                                       etc.
     •   EPA has 12 months to
         approve/disapprove

4
Extension for Submitting Final Plan

    • States may receive a 2-year extension, regardless of whether they are
      submitting an individual state plan or participating in a multistate plan.

    • The criteria for receiving an extension have been reduced to 3
      components:

        1. Identification of final plan approaches under consideration, and progress
           made to date;
        2. Why additional time is needed; and
        3. Demonstration of opportunity for public comment and meaningful
           stakeholder engagement.

    • EPA has 90 days to deny - no news is good news.

5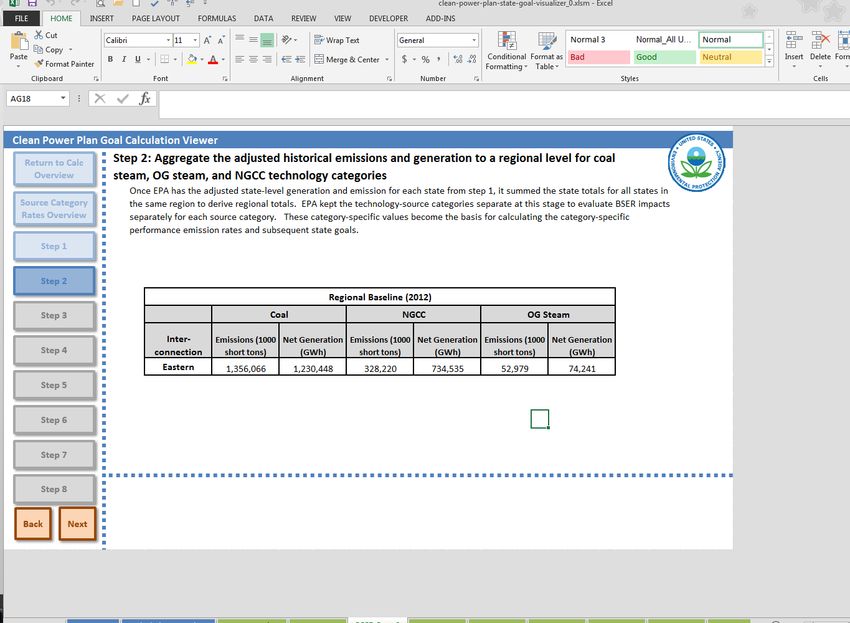
Affected Units
    • Affected units are any steam generating unit, IGCC, or stationary
      combustion turbine that commenced construction on or before
      01/08/2014 and:
        1. Serves as a generator connected to a utility power distribution system with a
           nameplate capacity of 25 MW-net or greater;
        2. Has a base load rating greater than 250 MMBtu/hour heat input fossil fuel;
           and
        3. Stationary combustion turbines that meet the definition of either a combined
           cycle or combined heat and power combustion turbine.

    • Iowa’s list of affected facilities has not changed (21), but we believe the
      number of affected units has been reduced from 42 to 37 units.

6
Affected Units (continued)
• EGUs may be excluded from being affected units per §60.5850 if they are:
– Subject to the 111(b) standards (40 CFR 60 Subpart TTTT) because of their
date of construction or became subject to Subpart TTTT because of
modification or reconstruction.
– Steam units and IGCC units that are currently and have always been subject to
a federally enforceable permit limiting annual net-electric sales to 1/3 or less
of its potential electric output, or 219,000 MWh or less;
– Non-fossil units that have always historically limited the use of fossil fuels to
10% or less of the annual capacity factor, or are subject to a federally
enforceable permit limiting fossil use to 10% or less of the annual capacity
factor.
7Corn Belt Power Coop 111(d)
IPL—Emery Station IPL—Lansing
Affected
Facilities
Cedar Falls—
Streeter Station IPL—Dubuque
MidAmerican Energy—
George Neal North
MidAmerican Energy—
Ames Electric Services IPL—Sutherland MidAmerican
George Neal South
Power Plant Energy—
IPL—Prairie
Riverside
Creek
MidAmerican IPL—M.L.
Energy— Kapp
Greater Des Pella Municipal MidAmerican
Moines Energy—Louisa CIPCO—Fair
MidAmerican
Muscatine Power Station
Energy—
Walter Scott, Jr. & Water
CIPCO— IPL—Ottumwa
Summit Lake
IPL—
Burlington
8Iowa Goals 9
New Iowa Goals
     • New “subcategory” Emission Performance Rates - nation-wide
         – 1,305 lbs. CO2/MWh* for fossil fuel-fired steam generating units
         – 771 lbs. CO2/MWh* for stationary combustion turbines

     • New Iowa Goals:
      Goal Type    Timing                Units Covered       Proposed          Final
      Rate         Interim (2022-2029)   existing affected   1,341 lbs./MWh*   1,505 lbs./MWh*
      Rate         2030 Final            units               1,301 lbs./MWh*   1,283 lbs./MWh*
      Mass         Interim (2022-2029)   existing affected   24,088,889 tons   28,254,411 tons
      Mass         2030 Final            units               23,358,609 tons   25,018,136 tons
      Mass         Interim (2022-2029)   existing affected          -          28,553,345 tons
                                         units + new
      Mass         2030 Final            source                     -          25,281,881 tons
                                         complement

10
              *net generation
Source: NACAA
Iowa has the 9th least stringent goal in the
contiguous U.S.
11Glide Path – Rate-based Goals
Iowa Rate Goals (lbs./MWh)
2012 = 2,195 lbs./MWh
1800
1,706
1600
1400
1,283
1200
1000
lbs/MWh
800
600
400
200
0
2022 2023 2024 2025 2026 2027 2028 2029 2030
Source: EPA CPP State Goal Visualizer
12Iowa Rate Goals 13
Glide Path – Mass-based Goals

                                                       Iowa Mass Goals (million short tons)

 2012 = 38,135,454 tons

                                   35
                                        31,173,035
                                   30

                                   25
              million short tons

                                                                                                            25,018,136
                                   20

                                   15

                                   10

                                    5

                                    0
                                     2022       2023   2024       2025      2026       2027   2028   2029      2030

 Source: EPA CPP State Goal Visualizer

14
Iowa Mass Goals 15
Best System of Emission Reduction

16
Best System of Emission Reduction (BSER)
     •   State-level data is aggregated to the regional level – 3 interconnections
     •   The building blocks are then applied at the regional level, not the state level.
     •   EPA then determined individual “subcategory” performance rates for fossil steam
         and natural gas combined cycle (NGCC) for each region, and selected the least
         stringent as BSER.
     •   BSER and the goal calculations may be a topic for a future stakeholder meeting.
             Heat Rate Improvement       Add New Utility-Scale            Increase Dispatch of
                    4.3% East                 Renewables                     Existing NGCC
                   2.3% West              (technical/economic              (75% Net Summer
                   2.1% Texas             potential after 2012)                Capacity)

                                                         EPA’s BSER Performance Rate for 111(d) Units
                                                                     (lbs CO2/Net-MWh)
                                                      Region       Existing Coal         Existing NGCC

                                                    Eastern            1,305                     771

                                                    Western             360                      690

                                                    Texas               237                      697

17
Building Block #1 - Heat Rate Improvement (HRI)
• Heat rate is the amount of fuel energy input needed to produce 1 KWh of
net electrical output.
• HRI changed from 6% in proposed rule to a separate rate for each
interconnection:
• Eastern Interconnection: 4.3%
• Texas Interconnection: 2.3%
• Western Interconnection: 2.1%
• HRIs were calculated by using 2012 as a baseline, then comparing it to the
best historical gross heat rate of each EGU in the region.
• EPA stresses that Block 1 should be implemented in combination with the
other building blocks.
18Building Block #2 – Shifting Generation from Fossil
Steam to Existing NGCC
• Proposed Rule:
– 70% nameplate capacity factor for existing and under construction
natural gas combined cycle (NGCC)
– Achieved by 2020
• Final Rule:
– 75% summer capacity factor for existing and under construction NGCC
• Represents a unit producing ¾ of the electricity it could have produced in
that time had it utilized its entire capacity
– Achieved in 2030, with glide path from 2020
– Applied after Building Block 3 when setting goals
19Building Block #3 – Shifting Generation to Renewables
• Proposed Rule:
– No retirement of “at risk” nuclear capacity; included under construction
nuclear
– Regional RE generation targets derived from existing RPS goals and applied to
each state
• Final Rule:
– Used on-shore wind, utility scale solar photovoltaic, concentrating solar
power, geothermal, and hydropower
– Nuclear is no longer included in BSER (can use as compliance option)
– Incremental RE only
• Used National Renewable Energy Laboratory (NREL) studies
• 25% increase in RE potential; based on economic modeling
• Applied at regional interconnection level
• Incremental RE was calculated using 7 steps (see p. 755 of final rule)
20Building Block #4 – No longer exists
• Proposed Rule:
– Annual improvement of 1.5% demand-side energy efficiency
• Final Rule:
– Demand-side Energy efficiency was not included in BSER
– Can still be used as a compliance option
21Goal Calculations (continued)
• Recommend looking at the Clean Power Plan State Goal Visualizer Tool
located in EPA’s Clean Power Plan Toolbox
22EPA’s New BSER Goal Calculation
• National “subcategory” performance rates were applied to each state based
on 2012 generation mix.
– Iowa’s 2012 mix was 96% coal and 4% natural gas
National 2012 State Unique State State CO2 Mass
Subcategory
Emission
X Generation Mix
(% of baseline)
= CO2 Goal
Rates
Budget
(tons)
Performance Rates (lbs./MWh)
(lbs./MWh)
Iowa Calculation
= (1,305 Fossil Steam national rate X 96%) +(771 NGCC national rate X 4%) =
= 1,283 lbs. CO2/MWh
23State Plan Pathways
24
24State Plan Pathways
1. Emission Standards Plan –
– Federally enforceable emission standards on affected EGUs
• Can use CO2 “subcategory” emission performance rates, state goal, or
varied emission rates
2. State Measures Plan –
– State includes, a least in part, measures implemented by the state that are not
included as federally enforceable emission standards
– Designed to achieve the state mass-based goal
– Ready path forward for states currently implementing mass-based trading
programs
– May require legislation
– Includes federally enforceable measures as a backstop
• Emission standards that would go in effect if state measures aren’t
meeting the goal
25State Plan Pathway Options
27
26Rate-based Plans Overview
• Sources must meet emission standard set by the final rule.
• If sources emit above the emission standard, they must acquire a
sufficient number of emission rate credits (ERCs) to bring them into
compliance.
• Emission Rate Credits (ERCs)
– Unit of trade for a rate-based program, produced in MWh for:
• Low or no-emissions resources installed in 2013 or thereafter, or
• Affected unit generation below subcategory rate, or
• Incremental NGCC generation (gas-shift ERCs)
– ERCs only accrue after 2022 (Earlier if participating in CEIP)
– ERCs can be banked indefinitely
– Gas-shift ERCs can only be used by coal units in a plan using
subcategory rate goals
27Rate-based Plans (continued)
• ERCs may be issued to:
– Measures that are installed after 2012, but
– Only the quantified and verified MWh of electricity generation or electricity
savings they produce in 2022 and future years can be used to adjust a CO2
emission rate.
– Examples:
• Renewables (wind, solar, geothermal, hydro, wave, tidal),
• New or uprated nuclear, Qualified biomass,
• Waste-to-energy, Combined heat and power,
• Energy efficiency, Transmission & distribution improvements
– Cannot be issued to energy storage or new stationary sources.
• The final rule also includes the Clean Energy Incentive Plan (CEIP), which
gives additional credits to early investments that generate wind and solar
power or reduce end-use energy demand during 2020 and 2021
• ERCs may be a good topic for a future meeting.
28Using ERCs to Achieve Compliance
CO2 Emission Rate =
Measured CO2 emissions (pounds)
Total net energy output (MWh) + ERC replacement generation for an EGU (MWh)
Hypothetical Example:
A coal-fired unit emits 230,000,000 pounds of CO2 during the compliance
period, generates 100,000 MWh of net electricity and owns ERCs from
renewable sources equal to 100,000 MWh.
The unit’s adjusted CO2 Emission Rate = 230,000,000 lbs.
(100,000 + 100,000) MWh*
= 1,150 lbs. CO2/MWh*
Emission rate would otherwise be 2,300 lbs. CO2/MWh* without ERCs
29 *net generationRate-based Plan Pathways
1. Use Subcategorized CO2 Emission Performance Rates
(771 lbs./MWh for turbines; 1305 lbs./MWh for steam generating units - nationwide)
– Trading Options:
• Intrastate trading ???
• Interstate trading - Trading Ready
– EPA Model Rule
– Plan must include:
• Evaluation measurement & verification (EM&V)
• Measurement & verification (M&V) and documentation of EE/RE savings
2. Use State CO2 Emission Goal Rate for Existing Units
(1,283 lbs./MWh for all affected units - Iowa)
– Trading Options:
• Intrastate
• Interstate - with multistate plan (weighted average)
– Plan must include:
• Evaluation measurement & verification (EM&V)
• Measurement & verification (M&V) and documentation of EE/RE savings
30Rate-based Plan Pathways (continued)
3. Use Varied CO2 Emission Rates Among Existing Units
– Trading Options:
• Intrastate trading
– Plan must include:
• Projection that plan will achieve the goal
• Evaluation measurement & verification (EM&V)
• Measurement & verification (M&V) and documentation of EE/RE savings
31Mass-based Plans Overview
• EPA gives state an emissions budget of how many tons of CO2 can be
emitted by affected EGUs.
• State can choose how to distribute the allowances.
– 1 allowance = 1 short ton of CO2 emitted during compliance period.
• EGUs must have a sufficient number of allowances at the end of the given
compliance to cover their actual emissions.
• Allowances may be traded and banked; a portion of allowances may be
set-aside by the state.
• If using the new source complement, leakage does not have to be
addressed.
32Mass-based Plan Pathways
1. EPA Mass Goal for Existing Units with EPA New Unit Complement
(25,281,881 tons)
– Trading Options:
• Intrastate ???
• Interstate: Trading Ready
– EPA Model Rule???
2. EPA Mass Goal for Existing Units Only (25,018,136 tons)
– Trading Options:
• Intrastate
• Interstate: Trading Ready
– EPA Model Rule
– Plan must address potential leakage
• Where shifts in generation to unaffected fossil fuel-fired sources result in increased
emissions, relative to what would have happened had generation shifts consistent with
the BSER occurred
• Results in higher emissions
33Mass-based Plan Pathways (continued)
3. State Measures, Can Include Mass Limit for Existing and New
– Ideal for states that are already trading – RGGI and California
– Trading Options: Can be made Trading Ready
– Plan must:
• Address potential leakage
• Include projection that it will achieve the goal
• Include backstop emission standards in case state measures fail to achieve compliance
– Additional reporting required
34Multistate Coordination
• States may participate in more than one multistate plan.
• A subset of affected EGUs in a state may participate in a multistate plan.
• Midcontinent States Environmental and Energy Regulators (MSEER)
– Regional stakeholder workshop on October 19th in Little Rock, Arkansas
– See for http://bipartisanpolicy.org/events/understanding-the-final-clean-power-plan-
implications-for-implementation-in-the-midcontinent-states/ to register or for webcast
35Reliability
• Plan must include demonstration that the reliability of the electrical grid
has been considered (new).
• Reliability safety valve (new)
– Triggered when there is conflict between the requirements of the state plan
and maintaining electric system reliability due to catastrophic or unforeseen
events
• When triggered, a source is exempted from the applicable emission standards for
90 days.
• During the 90 days, the source must meet an alternative emission standard that will
not jeopardize grid reliability.
– If the reliability issue cannot be resolved, the state must revise their plan to
address the reliability issue.
36Current Litigation
• West Virginia, No. 15-1277 filed in U.S. Court of Appeals for the DC Circuit
– Emergency request by 15 states to stay the Clean Power Plan
– EPA argues premature because the CPP has not been published in the Federal
Register
– DC Circuit rejected a similar challenge to the proposed CPP because a final
rule had not been published yet
37For More Information
Marnie Stein
111(d) Project Manager
Marnie.Stein@dnr.iowa.gov
515-725-9555
DNR Website:
http://www.iowadnr.gov/111d
EPA Clean Power Plan Website:
http://www2.epa.gov/carbon-pollution-standards
EPA Toolbox (including Visualizer Tool)
http://www2.epa.gov/cleanpowerplantoolbox
38You can also read