Epileptiform discharges relate to altered functional brain networks in autism spectrum disorders
←
→
Page content transcription
If your browser does not render page correctly, please read the page content below
doi:10.1093/braincomms/fcab184                                                                                   BRAIN COMMUNICATIONS 2021: Page 1 of 13                          | 1

Epileptiform discharges relate to altered
functional brain networks in autism spectrum

                                                                                                                                                                                          Downloaded from https://academic.oup.com/braincomms/article/3/3/fcab184/6355029 by guest on 17 January 2022
disorders
Tetsu Hirosawa,1,2,3 Kyung-min An,2,3 Daiki Soma,1 Yuka Shiota,2,3 Masuhiko Sano,1
Masafumi Kameya,1 Shoryoku Hino,4 Nobushige Naito,1 Sanae Tanaka,2,3 Ken Yaoi,2,3
Sumie Iwasaki,2 Yuko Yoshimura2,3,5 and Mitsuru Kikuchi1,2,3

Many individuals with autism spectrum disorders have comorbid epilepsy. Even in the absence of observable seizures, interictal epi-
leptiform discharges are common in individuals with autism spectrum disorders. However, how these interictal epileptiform dis-
charges are related to autistic symptomatology remains unclear. This study used magnetoencephalography to investigate the rela-
tion between interictal epileptiform discharges and altered functional brain networks in children with autism spectrum disorders.
Instead of particularly addressing individual brain regions, we specifically examine network properties. For this case-control study,
we analysed 70 children with autism spectrum disorders (52 boys, 18 girls, 38–92 months old) and 19 typically developing children
(16 boys, 3 girls, 48–88 months old). After assessing the participants’ social reciprocity using the Social Responsiveness Scale, we
constructed graphs of functional brain networks from frequency band separated task-free magnetoencephalography recordings.
Nodes corresponded to Desikan–Killiany atlas-based 68 brain regions. Edges corresponded to phase lag index values between pairs
of brain regions. To elucidate the effects of the existence of interictal epileptiform discharges on graph metrics, we matched each of
three pairs from three groups (typically developing children, children with autism spectrum disorders who had interictal epilepti-
form discharges and those who did not) in terms of age and sex. We used a coarsened exact matching algorithm and applied
adjusted regression analysis. We also investigated the relation between social reciprocity and the graph metric. Results show that,
in children with autism spectrum disorders, the average clustering coefficient in the theta band was significantly higher in children
who had interictal epileptiform discharges. Moreover, children with autism spectrum disorders who had no interictal epileptiform
discharges had a significantly lower average clustering coefficient in the theta band than typically developing children had.
However, the difference between typically developing children and children with autism spectrum disorder who had interictal epi-
leptiform discharges was not significant. Furthermore, the higher average clustering coefficient in the theta band corresponded to
severe autistic symptoms in children with autism spectrum disorder who had interictal epileptiform discharges. However, the asso-
ciation was not significant in children with autism spectrum disorders who had no interictal epileptiform discharge. In conclusion,
results demonstrate that alteration of functional brain networks in children with autism spectrum disorders depends on the exist-
ence of interictal epileptiform discharges. Interictal epileptiform discharges might ‘normalize’ the deviation of altered brain net-
works in autism spectrum disorders, increasing the clustering coefficient. However, when the effect exceeds tolerance, it actually
exacerbates autistic symptoms.

1 Department of Psychiatry and Neurobiology, Graduate School of Medical Science, Kanazawa University, Kanazawa 920-0934,
  Japan
2 Research Center for Child Mental Development, Kanazawa University, Kanazawa 920-8641, Japan
3 Division of Socio-Cognitive-Neuroscience, Department of Child Development United Graduate School of Child Development, Osaka
  University, Kanazawa University, Hamamatsu University School of Medicine, Chiba University and University of Fukui, Kanazawa
  920-8640, Japan

Received April 20, 2021. Revised May 23, 2021. Accepted June 22, 2021. Advance Access publication August 19, 2021
C The Author(s) (2021). Published by Oxford University Press on behalf of the Guarantors of Brain.
V
This is an Open Access article distributed under the terms of the Creative Commons Attribution License (http://creativecommons.org/licenses/by/4.0/), which permits unrestricted reuse,
distribution, and reproduction in any medium, provided the original work is properly cited.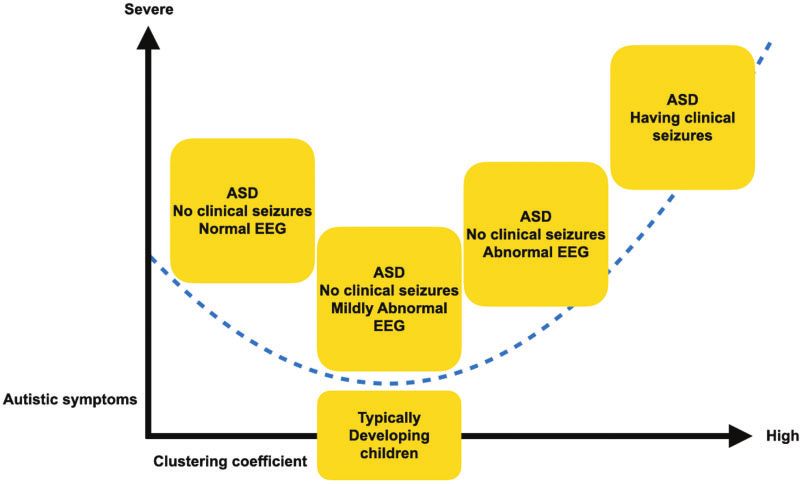
2    | BRAIN COMMUNICATIONS 2021: Page 2 of 13                                                                      T. Hirosawa et al.

4 Department of Neuropsychiatry, Ishikawa Prefectural Takamatsu Hospital, Ishikawa 929-1214, Japan
5 Faculty of Education, Institute of Human and Social Sciences, Kanazawa University, Kanazawa 920-1164, Japan

Correspondence to: Tetsu Hirosawa
Research Center for Child Mental Development, Kanazawa University
13-1 Takara-machi, Kanazawa 920-8641, Japan
E-mail: hirosawatetsu1982@yahoo.co.jp

Keywords: autism spectrum disorder; graph theory; interictal epileptiform discharge; magnetoencephalography; Social
Responsiveness Scale
Abbreviations: ASD ¼autism spectrum disorder with no interictal epileptiform discharge; ASDþ ¼autism spectrum disorder
with interictal epileptiform discharge; C ¼average clustering coefficient; CEM ¼coarsened exact matching; IED ¼interictal epilepti-
form discharge; K-ABC ¼Kaufman Assessment Battery for Children; L ¼average shortest path length; MEG ¼magnetoencephalo-

                                                                                                                                         Downloaded from https://academic.oup.com/braincomms/article/3/3/fcab184/6355029 by guest on 17 January 2022
magnetoencephalography; PLI ¼phase lag index; SRS ¼Social Responsiveness Scale; SW¼ small world-ness; SWN ¼Small-World
Network; TD children ¼typically developing children

    Graphical Abstract

Introduction                                                          In addition to social impairment, many people with aut-
                                                                    ism spectrum disorder have co-occurring epilepsy. As
Autism spectrum disorder, a neurodevelopmental syn-                 many as 5–46% of children with autism spectrum disorder
drome, is characterized by impaired social cognition and            develop epilepsy. That prevalence is much higher than in
communication as well as repetitive or obsessive behav-             typically developing (TD) children, which is only 2–7%.3–5
iour and interests.1 Signs of autism spectrum disorder              Also, 32% of patients with epilepsy meet the diagnostic
emerge early in life, typically during infancy. Whereas             criteria of autism spectrum disorder.6 That association has
symptoms might change over the course of development,               attracted attention: abnormal neurophysiological activities
autism spectrum disorder is generally considered a chron-           are often investigated in individuals with autism spectrum
ic, lifelong condition with no known spontaneous remis-             disorder. In this context, electroencephalography and mag-
sion. Furthermore, its prevalence is increasing constantly.2        netoencephalography (MEG) are used to visualize those
People with autism spectrum disorder require intensive              abnormal brain activities. Such abnormal activities include
support. Investigating its biological underpinnings is              interictal epileptiform discharges (IEDs), defined as sharp
becoming increasingly important to establish tools for              waves or complex peak waves that occur in the absence
early diagnosis and for effective intervention.                     of observable changes in behaviour. It is particularly
Brain networks in autism spectrum disorder BRAIN COMMUNICATIONS 2021: Page 3 of 13 | 3
interesting that 6.7–50% of patients with autism spectrum regions.21 This ‘functional’ connectivity has been inferred
disorder show IEDs in their EEG,7,8 even in the absence as arising from, for example, the synchronization of pre-
of co-occurring epilepsy. This rate is much higher than synaptic potentials in a set of neurons, which enhances
that of TD individuals, which is 1–4%.9,10 their effect on postsynaptic neurons in targeted areas.22
The limited available information related to association be- In terms of brain connectivity, a popular hypothesis is
tween autistic symptomatology and IEDs is complicated.11–16 that autism spectrum disorder is one of long-range under-
Our earlier study11 investigated the association between connectivity combined with local overconnectivity.23
IEDs and cognitive function in children with and without However, in light of the brain’s inherent complexity, any
autism spectrum disorder who did not have epilepsy. For hypothesis based on such a simple measure (i.e. mean of
that study, after we recruited 163 TD children (84 boys, 79 the strength of connectivity) might be an oversimplifica-
girls, 32–89 months old) and 107 children with autism spec- tion. To meet this challenge and to describe the proper-
trum disorder (85 boys, 22 girls, 36–98 months old), we ties of complex networks on a large scale, the field of
Downloaded from https://academic.oup.com/braincomms/article/3/3/fcab184/6355029 by guest on 17 January 2022
evaluated the association between their numbers of IEDs neuroscience has provided network theory.24
(per unit time) and their level of intelligence. Regarding the Using network theory, also designated as graph theory,
TD group, we observed that higher numbers of IEDs corre- one can describe properties of a given complex system
sponded to lower intelligence. However, the opposite rela- using the same parameters, irrespective of their constitu-
tion was found for the autism spectrum disorder group. In ent elements.25 Particularly in the field of EEG/MEG, we
the group, higher numbers of IEDs corresponded to higher consider the complex networks of brain regions, in which
intelligence. For a subsequent study, we recruited 40 TD brain region activity is expressed as electrophysiological
children and 26 children with autism spectrum disorder in signals. Brain regions are mutually interacting over the
the similar age range. Results demonstrated that higher course of time. Within the framework of graph theory,
numbers of IED corresponded to better sociality.12 Hartley- such a complex network is reduced to a set of nodes and
McAndrew and Weinstock15 reported similar results, but edges called a ‘graph’.26 Nodes represent brain regions.
Milovanovic et al.13 reported that the association was not Edges represent functional connectivity linking any pair
significant. Other reports described an opposite association of nodes. The information included in the graph can be
(i.e. existence of EEG abnormalities correlated with severe summarized further using various measures. Well-estab-
autistic symptoms).14,16 Although association between IED lished measures include the mean clustering coefficient
and either intelligence or autistic symptoms remains unclear, (C) and average shortest path length (L). These derive
it is noteworthy that large-scale studies consistently show originally from statistical physics, although they have
the existence of epilepsy (i.e. observable clinical seizures) as been used widely in the field of neuroscience during re-
associated with severe autistic symptoms. For instance, after cent decades. C represents the tendencies of nodes to
Yasuhara17 investigated 1064 children with autism spectrum form local clusters. In networks of the brain, higher C
disorder, the author reported that epilepsy is more likely to indicates functionally segregated information processing.27
occur among children with autism who also have lower in- L stands for the average shortest ‘distance’ between two
telligence. More recently, after Ewen et al.18 examined 6975 nodes (i.e. number of edges to cross to get from one
children with autism spectrum disorder for their large-scale node to another), which indicates integration of informa-
cohort study, they reported that severe autism spectrum dis- tion from remote brain regions.27 A graph having high C
order symptoms is an independent risk factor of epilepsy. and short L is called a ‘small-world network (SWN)’.
Combining those results from earlier reports of the literature Conceptually, SWN is somewhere between an ordered
reveals that severe autistic symptoms are likely to be associ- (high C and long L) and a random (low C and short L)
ated with epileptic discharges causing observable seizures network.28 In this sense, SWN is well-connected both lo-
(possibly representing severer forms of epileptic activity). cally and globally. For that reason, it is regarded as a
However, epileptic discharges in the absence of clinical seiz- balance of integration and segregation. It is particularly
ures (possibly representing milder forms of epileptic activity) interesting for our purposes that the existing literature
might or might not be beneficial for autistic symptoms. The suggests that a healthy human brain network possesses
present study investigated the neurological underpinnings of SWN properties,26,29 which have been attributed to evo-
this association using MEG. lutionary processes gradually culminating in an optimal
In the field of brain imaging, researchers have specific- balance between cost and efficiency.26 Furthermore,
ally emphasized the characterization of the functions of reports of some reports have described that brain net-
individual brain regions. However, accumulating evidence works deviate from the SWN property when affected by
suggests that autism spectrum disorder is a disorder of some neurological diseases such as Alzheimer’s disease,30
abnormal brain connectivity, i.e. dysfunction in coordin- depression31 and schizophrenia.32 In people affected by
ation over widely distributed brain regions.19 Brain con- those disorders, C and L are reportedly smaller than in
nectivity is a multi-faceted concept,20 but in the field of healthy controls.
MEG or EEG, connectivity usually refers to statistical Many EEG/MEG researchers have examined interictal
dependencies that have been identified between time ser- brain networks in patients with epilepsy. Their results
ies of electromagnetic signals from different brain suggest that the interictal epileptic brain network is also4 | BRAIN COMMUNICATIONS 2021: Page 4 of 13 T. Hirosawa et al.
deviated from the SWN property, but in the opposite dir- autism spectrum disorder and reported lower C (in the
ection. C in epilepsy is reportedly larger than in healthy theta, alpha and beta bands) and increased L (in the beta
controls. Nevertheless, reports describe conflicting results band and broadband) compared to healthy controls. It is
for L. For instance, Pegg et al.33 reported in their system- noteworthy that one study including children with autism
atic review that studies of idiopathic generalized epilepsy spectrum disorder, but not explicitly excluding children
tend to report higher C in lower frequency bands and with autism spectrum disorder having epilepsy, found no
decreased L in the beta band. Particularly, among four significant difference in either C or L in an autism spec-
studies of idiopathic generalized epilepsy brain network trum disorder group48 compared to healthy controls.
in which C was evaluated,34–37 two studies demonstrated Similarly, after Takahashi et al.49 analysed children with
increased C in the theta34 and extended alpha (5–15 Hz) autism spectrum disorder, but without excluding children
bands36 in patients with idiopathic generalized epilepsy who had epilepsy, they reported that neither the differ-
compared to healthy controls. The other two studies ence in C nor in L was significant. Here again, although
Downloaded from https://academic.oup.com/braincomms/article/3/3/fcab184/6355029 by guest on 17 January 2022
found no significant difference. In terms of L, among direct comparison of these results is difficult, the existing
three studies of idiopathic generalized epilepsy34,35,37 that literature suggests that brain networks of autism spectrum
evaluated L, results of only one study35 indicated a disorder show lower C and increased L over widely vari-
decreased L in the beta band. The other two found no ous frequencies in a broad age range, but they might de-
significant difference. Higher C in lower frequency bands pend on the presence of epilepsy. A notable exception is
was also reported for patients with focal epilepsy, but a report of a study conducted by Ye et al.50 Based on
here also the results for L were conflicting. Particularly, their examination of autism spectrum disorder in adoles-
Horstmann et al.38 reported higher C and increased L in cents with IQ higher than 65 and without epilepsy, they
patients with epilepsy than in healthy controls. The dif- reported higher C and shorter L in the theta band.
ference was most evident in the delta band, but was This study was designed to assess the role of IEDs on
observed in other frequency bands, except for the alpha functional brain networks in children with autism spec-
band. Quraan et al.39 reported higher C in the theta trum disorder in relation to autistic symptoms. Based on
band and decreased L in the alpha band. Also, Wang the evidence presented above, we speculated that IEDs
and Meng40 found higher C in the theta and beta bands can ‘normalize’ altered functional brain networks in
and increased L in alpha and theta bands for patients children with milder autism spectrum disorder by
with epilepsy. Although it is difficult to compare these increasing C. Furthermore, the relation between C and
results directly because of methodological differences such autistic symptoms can be an inverted U shape (i.e. ex-
as sample size, participant characteristics, imaging modal- cessively higher C, represented as having clinical seiz-
ities (EEG/MEG), measures of synchronization, properties ures, corresponding to severe autistic symptoms)
of graphs (weighted or unweighted), behavioural condi- (Fig. 1). We constructed functional brain networks using
tion (eyes-closed or eyes-open), a consensus holds that MEG for three groups of young children: children with
interictal brain networks in focal or generalized epilepsy autism spectrum disorder who have IEDs but who have
show higher C in lower frequency bands. The results for no observable epilepsy, children with autism spectrum
L are inconsistent depending on the experimental condi- disorder who have no IED, and TD children. We
tions. A possible exception is benign epilepsy with centro- hypothesized the following: (i) In children with autism
temporal spikes. Three studies particularly addressing spectrum disorder who have no IED, C is lower than in
patients with benign epilepsy with centrotemporal spikes TD children and children with autism spectrum disor-
consistently showed lower C in the theta and other fre- ders who have IEDs. (ii) In children with autism spec-
quency bands for the patient group.41–43 trum disorder who have IEDs, higher C corresponds to
Although few MEG/EEG studies of brain networks of severe autistic symptoms. In children with autism spec-
autism spectrum disorder have been reported, evidence trum disorder who have no IED, higher C corresponds
suggests that brain networks in autism spectrum disorder to milder autistic symptoms. We also analysed L and
are also deviated from the SWN property, but in a differ- small world-ness (SW, adjusted ratio of L and C) for
ent direction. The first report was that of a study by completeness, but we formulated no particular hypothesis
Pollonini et al.44 They investigated young adults with for those measures because the results for L in earlier
high function autism spectrum disorder and reported studies are inconsistent. In addition, strictly speaking, paths
lower C and increased L (in broadband signal) in an aut- in graphs of functional networks merely represent sequen-
ism spectrum disorder group than in healthy controls. ces of statistical associations. Therefore, paths might not
Tsiaras et al.45 reported a non-significant trend in the correspond to information flow, and consequently, might
same direction for adolescents with autism spectrum dis- be less straightforward to interpret.27
order. For a subsequent study in which adults with aut- Among imaging modalities, MEG has great merit for
ism spectrum disorder were recruited, Barttfeld et al.46 this study. First, MEG reportedly has higher sensitivity for
reported lower C (in the theta combined with alpha IEDs than EEG does.51 Second, MEG has higher spatial
band, and beta band) and increased L (in beta band). resolution than EEG, which is a great merit when measur-
Furthermore, Boersma et al.47 analysed children with ing functional connectivity because higher spatialBrain networks in autism spectrum disorder BRAIN COMMUNICATIONS 2021: Page 5 of 13 | 5
Downloaded from https://academic.oup.com/braincomms/article/3/3/fcab184/6355029 by guest on 17 January 2022
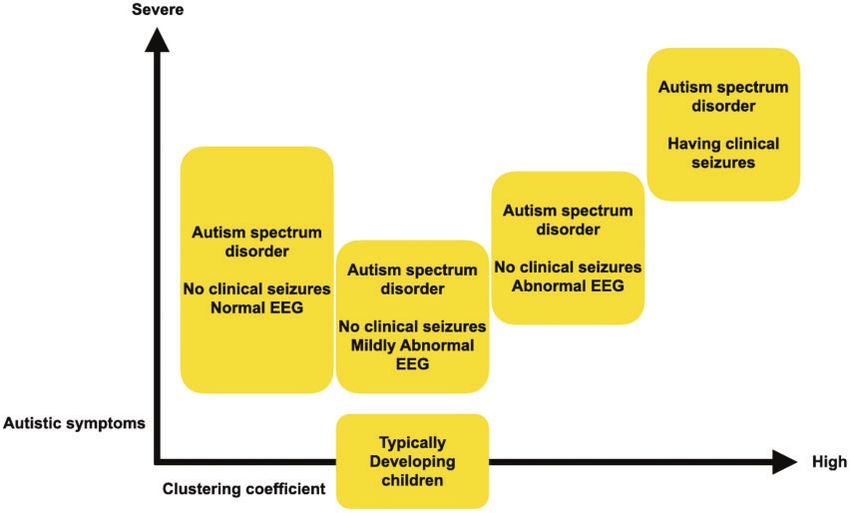
Figure 1 Estimated inverted U-shaped relation between average clustering coefficient in lower frequency and autistic
symptoms. Interictal epileptiform discharges might ‘normalize’ the deviation of autism spectrum disorders brain by
increasing C. However, when the effect goes beyond tolerance, it can exacerbate autistic symptoms. ASD 5 autism
spectrum disorders; IED 5 interictal epileptiform discharge
resolution yields more precise signal source mapping. The autism spectrum disorder diagnosis was made
Third, unlike fMRI, MEG is particularly suitable for according to the Diagnostic and Statistical Manual of
young children because it is completely silent. Moreover, it Mental Disorders (4th edition)52 using the Diagnostic
uses no radioactive agent, as positron emission tomog- Interview for Social and Communication Disorders53 or
raphy and single-photon emission computed tomography the Autism Diagnostic Observation Schedule-Generic.54
do. The exclusion criteria were (i) blindness, (ii) deafness, (iii)
any other neuropsychiatric disorder including epilepsy
and (iv) ongoing medication. Written informed consent
was obtained from parents before participation by chil-
Materials and methods dren. The Ethics Committee of Kanazawa University
Hospital approved the methods and procedures, all of
Participants which were conducted in accordance with the
Declaration of Helsinki.
From Kanazawa University and affiliated hospitals, we
We are continually recruiting participants as part of a
recruited 78 children with autism spectrum disorders (58
single large project (Bambi plan, http://bambiplan.w3.
boys, 20 girls, 38–92 months old) and 19 TD children (16
kanazawa-u.ac.jp/pdf/jusen_english.pdf). As a result, some
boys, 3 girls, 48–88 months old). Four boys with autism
participants overlap with those in our earlier studies,11,55
spectrum disorders were unable to complete MEG recording
but no results overlap. In addition, the emphases of those
because of their severe psychomotor agitation. We were un- earlier studies were completely different from those of
able to identify the electrical dipole current for P100M for this study.
one boy and two girls with autism spectrum disorders, as
described below in co-registration of MEG on MRI imag-
ing. One boy with autism spectrum disorders was excluded
Assessment of social reciprocity and
from the analysis in the course of MEG data pre-process- intelligence
ing, as described below in the description of pre-processing. We assessed participants’ social reciprocity using the
These children were excluded from statistical analyses. Social Responsiveness Scale (SRS),56 a 65-item rating
Therefore, we analysed 70 children with autism spectrum scale that measures sociality and autistic mannerisms, as
disorders (52 boys, 18 girls, 38–92 months old) and 19 TD a quantitative trait for TD children and children with
children (Table 1). We described sample size calculation in autism spectrum disorders. A parent of each participant
Supplementary materials. filled out the SRS. We used gender-normed T scores6 | BRAIN COMMUNICATIONS 2021: Page 6 of 13 T. Hirosawa et al.
Table 1 Characteristics of the participants
ASD TD v2 or t P
ASD with no ASD with ASD1 ASD1 ASD2 ASD1 ASD1 versus ASD2 versus
IEDs IEDs versus versus versus versus TD TD
ASD2 TD TD ASD2
N 52 18 19
Sex (% male)a 79% 61% 84% 2.20 2.50 0.25 0.138 0.114 0.615
Age in monthsb 65.5 (11.8) 62.1 (10.2) 68.1 (10.7) 1.11 1.75 0.83 0.270 0.089 0.410
SRS total scoreb 73.0 (11.6) 70.8 (9.3) 52.1 (8.2) 0.74 6.40 7.04 0.464Brain networks in autism spectrum disorder BRAIN COMMUNICATIONS 2021: Page 7 of 13 | 7
used a suitable MRI brain template for each child based exist or do not exist: they have no graded values. We
on the individual head surface shapes. We co-register the binarize the matrix because binary networks are, in most
MEG and template MRI image according to the electrical cases, simpler to characterize. More importantly, weak
dipole current location, which is generated at the supra- connectivity might represent spurious connections, particu-
temporal auditory cortex in response to auditory syllable larly in functional networks. These connections tend to ob-
sound stimulation. We were unable to identify the elec- scure the topology of strong and significant connections.62
trical dipole current for P100M for one boy and two Therefore, we discarded such weak connections by applica-
girls with autism spectrum disorders. These children were tion of a proportional weight threshold. We set the pro-
excluded from subsequent analysis. Details of this proced- portion of total connections retained, j, as 20% according
ure are described in Supplementary materials. This pro- to our earlier study.49
cedure was the same as that used for one of our earlier Among all the available graph metrics, we adopted the
studies.60 most commonly used: The clustering coefficient (C), the
Downloaded from https://academic.oup.com/braincomms/article/3/3/fcab184/6355029 by guest on 17 January 2022
characteristic path length (L) and small world-ness (SW).27
Magnetoencephalography data Our primary interest was on C, but in pursuit of com-
pleteness, and for comparison with earlier studies, we also
analysis investigated L and SW. We describe what those metrics
The following MEG analyses were performed using quantify in Supplementary materials, but we omit their
Brainstorm,61 which is documented and freely available complex mathematical definitions. A formal mathematical
for download online under the GNU general public li- definition is presented elsewhere.27,28
cense (http://neuroimage.usc.edu/brainstorm).
Statistical analysis
Pre-processing We used Student’s t-tests to examine differences in ages
After we downsampled MEG recordings to 500 Hz, we and scores in K-ABC and SRS between children with aut-
pre-processed the MEG data in compliance with that ism spectrum disorders who had IEDs and those who did
described in the Brainstorm tutorial (https://neuroimage. not. Sex differences were tested using chi-square tests.
usc.edu/brainstorm/Tutorials/). During the acquisitions, sig- Then, we compared each of those two groups similarly
nal quality was poor in some sensors. First, we excluded with TD children.
noisy sensors from the analysis. Second, we applied a To investigate the effects of existence of IEDs on graph
notch filter to remove the 60 Hz harmonics (i.e. 60, 120 metrics in children with autism spectrum disorders, we
and 180 Hz); then, we applied a band-pass filter (0.5– matched the two groups (children with autism spectrum
100 Hz). Third, we used the Independent Component disorders who had IEDs and those who did not) in terms
Analysis method to remove the cardiac and blink artefacts. of age and sex. To improve the balance, we used coars-
Fourth, segments containing apparent motion noise were ened exact matching (CEM).63 Then, we performed
excluded based on visual inspection of the waveforms. At adjusted regression analysis. Particularly, we predicted each
this step, the motion noise in one boy with autism spec- graph metric based on the condition (with and without
trum disorders was excessive. We excluded this child from IEDs) with the CEM weight for weighting. In the CEM al-
subsequent analyses. Fifth, segments containing IEDs were gorithm, we temporarily coarsen (or categorize) each vari-
excluded based on visual inspection of the waveforms. able using Sturge’s rule as a binning algorithm. Each
participant is then assigned to one of a specified set of
Graph construction and graph strata in which the participant characteristics are matched
exactly on a set of coarsened variables. A weighting vari-
metrics able (CEM weight) is generated to equalize the number of
Details of atlas-guided source reconstruction and segment- treated and control cases in one stratum. It is used for
ing are described in Supplementary materials. A graph is a subsequent regression analysis.63 This report describes the
basic topographical representation of a network consisting degree of imbalance before and after matching by measur-
of ‘nodes’ and ‘edges’ connecting pairs of nodes. In this ing the multivariate L1 distance. The L1 distance repre-
study, nodes corresponded to 68 brain regions. Edges were sents how two groups are balanced in terms of matched
weighed by corresponding phase lag index (PLI) values be- variables (in our case, sex and age). The L1 distance is a
tween pairs of brain regions. We provided a detailed de- value between zero and one, with a smaller value repre-
scription of PLI in Supplementary materials. Particularly senting better balance. We tested for three graph metrics
for each epoch, undirected weighted functional connectivity (i.e. C, L and SW) for each frequency band (i.e. delta,
matrix (68 68) was constructed based on PLI for each theta, alpha, beta and gamma). Therefore, significance was
frequency band (i.e. delta, theta, alpha, beta and gamma). inferred for P < 0.0033 after Bonferroni correction was
The first step in applying graph theoretical analysis to applied for 15 comparisons. We similarly compared graph
these functional connectivity matrices consists of converting metrics in TD children with those in each of two autism
the matrix into a binary graph, in which the edges either spectrum disorders groups.8 | BRAIN COMMUNICATIONS 2021: Page 8 of 13 T. Hirosawa et al.
Table 2 Difference between ASDþ and ASD in graph metrics for matched participants
Frequency band Graph metrics Coeff. SE 95% CI t P
Delta C 0.006 0.011 0.017 to 0.028 0.51 0.611
L 0.006 0.007 0.008 to 0.019 0.83 0.410
SW 0.003 0.031 0.059 to 0.065 0.09 0.931
Theta C 0.042 0.013 0.015 to 0.069 3.14 0.0028*
L 0.011 0.008 0.005 to 0.029 1.41 0.164
SW 0.013 0.021 0.055 to 0.029 0.63 0.532
Alpha C 0.019 0.024 0.028 to 0.067 0.83 0.413
L 0.026 0.011 0.003 to 0.049 2.31 0.025
SW 0.018 0.021 0.026 to 0.061 0.82 0.418
Beta C 0.163 0.011 0.005 to 0.038 1.52 0.013
L 0.006 0.015 0.024 to 0.036 0.38 0.703
Downloaded from https://academic.oup.com/braincomms/article/3/3/fcab184/6355029 by guest on 17 January 2022
SW 0.010 0.030 0.069 to 0.050 0.32 0.749
Gamma C 0.008 0.019 0.030 to 0.045 0.40 0.689
L 0.006 0.022 0.050 to 0.039 0.26 0.800
SW 0.016 0.027 0.069 to 0.038 0.59 0.560
ASD ¼ Autism Spectrum Disorder with no interictal epileptiform discharges; ASDþ ¼ Autism Spectrum Disorder with interictal epileptiform discharges; C ¼ average clustering
coefficient; L ¼ average shortest path lengths; SW ¼ small world-ness.
*Indicates significant effect (p < 0.0033).
For children with autism spectrum disorders, if a signifi-
cant effect of IEDs was found for any graph metric, we
Results
investigated the relation between social reciprocity and the For three children with autism spectrum disorders having
graph metric. Particularly, we applied linear regression no IED, we were unable to obtain SRS scores because
models to predict the graph metric based on the partici- their parents became unreachable after MEG recording.
pant condition (i.e. with or without IEDs), SRS-T score, Three children (two children with no IED and one child
interaction between condition and SRS-T score, age and with IEDs) were unable to complete K-ABC because of
sex. If a significant interaction effect was found, then we severe psychomotor agitation. The SRS total score was
applied post hoc analysis for further elucidation of the re- significantly lower in TD children than children with aut-
lation between SRS and graph metric. In post hoc analysis, ism spectrum disorders having no IED [t(65) ¼ 7.04, P
we predicted the metric based on SRS-T score controlling < 0.001], and children with autism spectrum disorders
for age and sex in each condition (i.e. with or without having IEDs [t(34) ¼ 6.40, P < 0.001]. The MPS score
IEDs). Significance was inferred for P < 0.025 after was significantly higher in TD children than in children
Bonferroni correction was applied. For exploratory ana- with autism spectrum disorders having no IED [t(66) ¼
lysis, we also investigated the relation between social reci- 2.40, P ¼ 0.019]. We found no significant difference in
any other factor. Table 1 presents the results.
procity and the graph metric in TD children. The relations
Supplementary Table 1 presents the distribution of IEDs.
between K-ABC scores (MPS and ACH) and the graph
metric are analysed similarly.
Before we applied linear regression, we verified that Group differences in graph metrics
our data meet the assumptions for regression analysis. in matched participants
Specifically, we used standard methods to verify linearity,
For comparison between children with autism spectrum
normality, homogeneity of variance, model specifications,
disorder having no IED (ASD) and children with autism
influence and collinearity. Results show that the assump-
spectrum disorder having IEDs (ASDþ), after improving
tion of homogeneity was violated for some regression
balance using the CEM algorithm, 38 children with ASD
models. Therefore, for those models, we used heterosce- and 17 children with ASDþ were the matched partici-
dasticity-robust standard errors.64 All statistical analyses pants. The L1 distance improved from 0.474 to 0.272.
were conducted using software (Stata ver. 15.0; Stata After matching, we used linear regression with CEM
Corp., College Station, TX, USA). weights to predict the graph metrics based on the condi-
tion (i.e. with or without IEDs). The main effect of the
condition [t(53) ¼ 3.14, P ¼ 0.0028] was found to be sig-
Data availability nificant only for the model predicting C in the theta band.
Raw data were generated at Kanazawa University. Table 2 presents the results. Children with ASDþ had sig-
Derived data supporting the findings of this study are nificantly higher C in the theta band than ASD had.
available as Supplementary information. Stata (Stata ver. For comparison between children with ASD and TD
15.0; Stata Corp., College Station, TX, USA) will be children, after improving balance using the CEM algo-
needed to use to open the file. rithm, 41 children with ASD and 18 TD children wereBrain networks in autism spectrum disorder BRAIN COMMUNICATIONS 2021: Page 9 of 13 | 9
Table 3 Difference between ASD and TD in graph metrics for matched participants
Frequency band Graph metrics Coeff. SE 95% CI t P
Delta C 0.012 0.010 0.009 to 0.033 1.17 0.247
L 0.014 0.007 0.000 to 0.028 1.96 0.056
SW 0.022 0.237 0.694 to 0.026 0.92 0.361
Theta C 0.036 0.011 0.058 to 0.014 3.22 0.0021*
L 0.005 0.010 0.026 to 0.016 0.48 0.633
SW 0.027 0.020 0.068 to 0.014 1.33 0.188
Alpha C 0.017 0.019 0.055 to 0.021 0.88 0.384
L 0.013 0.010 0.033 to 0.006 1.41 0.166
SW 0.012 0.021 0.030 to 0.053 0.57 0.571
Beta C 0.012 0.011 0.011 to 0.034 1.01 0.315
L 0.007 0.016 0.038 to 0.025 0.42 0.680
Downloaded from https://academic.oup.com/braincomms/article/3/3/fcab184/6355029 by guest on 17 January 2022
SW 0.019 0.034 0.050 to 0.880 0.55 0.583
Gamma C 0.037 0.020 0.003 to 0.077 1.87 0.067
L 0.006 0.018 0.029 to 0.042 0.35 0.728
SW 0.028 0.027 0.083 to 0.027 1.03 0.308
ASD ¼ autism spectrum disorders having no interictal epileptiform discharges; TD ¼ Typically developing children; C ¼ average clustering coefficient; L ¼ average shortest path
length; SW ¼ small world-ness.
*Indicates significant effect (p < 0.0033).
Table 4 Difference between ASDþ and TD in graph metrics for matched participants
Frequency band Graph metrics Coeff. SE 95% CI t P
Delta C 0.004 0.010 0.025 to 0.018 0.35 0.732
L 0.019 0.011 0.004 to 0.042 1.70 0.105
SW 0.041 0.037 0.118 to 0.037 1.09 0.288
Theta C 0.034 0.028 0.024 to 0.091 1.22 0.238
L 0.009 0.015 0.023 to 0.040 0.58 0.568
SW 0.000 0.025 0.053 – 0.052 0.01 0.991
Alpha C 0.013 0.031 0.077 to 0.051 0.42 0.676
L 0.022 0.014 0.007 to 0.052 1.57 0.131
SW 0.069 0.042 0.156 to 0.018 1.65 0.114
Beta C 0.000 0.016 0.033 to 0.033 0.01 0.993
L 0.010 0.023 0.057 to 0.038 0.42 0.679
SW 0.005 0.043 0.095 to 0.084 0.13 0.900
Gamma C 0.005 0.028 0.062 to 0.052 0.17 0.868
L 0.028 0.035 0.101 to 0.045 0.80 0.431
SW 0.136 0.041 0.221 to 0.050 3.31 0.035
ASDþ ¼ autism spectrum disorder with interictal epileptiform discharges; TD ¼ typically developing children; C ¼ average clustering coefficient; L ¼ average shortest path lengths;
SW ¼ small world-ness.
the matched participants. The L1 distance improved from gamma band than ASDþ children, but the difference was
0.242 to 0.067. After matching, we used linear regression not significant after Bonferroni correction.
with CEM weights to predict graph metrics based on the
condition (i.e. ASD or TD). The model predicting C in Effects of Social Responsiveness
the theta band was the only one for which the main ef-
fect of the condition [t(57) ¼ 3.22, P ¼ 0.0021] was
Scale scores on C in the theta band
found to be significant. TD children had significantly For children with autism spectrum disorders, we applied lin-
higher C in the theta band than ASD children had. ear regression models to predict C in the theta band based
Table 3 presents the results. on the participant condition (i.e. with or without IEDs),
For comparison between ASDþ children and TD chil- SRS-T score, interaction between condition and SRS-T
dren, after improving balance using the CEM algorithm, score, age and sex. For this model, the interaction effect be-
11 ASDþ children and 11 TD children comprised the tween condition (i.e. with or without IEDs) and the SRS
matched participants. The L1 distance improved from total T-score was found to be significant [t(61) ¼ 2.28,
0.503 to10 | BRAIN COMMUNICATIONS 2021: Page 10 of 13 T. Hirosawa et al.
Table 5 Effect of SRS-T score on C in theta band for children with ASD
Children with versus C in theta band Coeff. Robust SE 95% CI t P F P R2
ASD
SRS-T 0.000 0.001 0.001 to 0.001 0.52 0.606 1.19 0.323 0.168
Condition 0.174 0.081 0.336 to 0.011 2.14 0.037*
Condition SRS-T 0.003 0.001 0.000 to 0.005 2.28 0.026*
Sex 0.034 0.019 0.003 to 0.071 1.82 0.074
Age (months) 0.001 0.001 0.002 to 0.000 1.31 0.195
Post hoc analysis
ASD having no IEDs
SRS-T 0.000 0.000 0.001 to 0.001 0.26 0.795 0.47 0.703 0.019
Sex 0.012 0.014 0.040 to 0.017 0.83 0.412
Age (months) 0.000 0.000 0.001 to 0.001 0.78 0.439
Downloaded from https://academic.oup.com/braincomms/article/3/3/fcab184/6355029 by guest on 17 January 2022
ASD having IEDs
SRS-T 0.005 0.001 0.002 to 0.007 3.84 0.002* 6.18 0.007* 0.488
Sex 0.088 0.022 0.040 to 0.013 3.95 0.002*
Age (months) 0.002 0.002 0.006 to 0.002 0.96 0.351
TD children versus C in theta band
SRS-T 0.001 0.002 0.005 to 0.004 0.29 0.774 0.05 0.984 0.010
Sex 0.012 0.032 0.057 to 0.081 0.37 0.713
Age (months) 0.000 0.001 0.003 to 0.002 0.24 0.811
ASD ¼ autism spectrum disorder; TD children ¼ typically developing children; C ¼ average clustering coefficient; IED ¼ Interictal Epileptiform Discharge; SRS-T ¼ Social
Responsiveness Scale Total T score.
*Indicates significant effect (p < 0.05 for the first regression model, and p < 0.025 for the post hoc analysis)
and C in the theta band, we applied linear regression to Furthermore, in children with autism spectrum disorders
predict C in the theta band based on the SRS total T-score, having IEDs, higher C in the theta band corresponded to
age and sex in each group (i.e. ASDþ and ASD). For severe autistic symptoms. However, the association was
children with no IED, no factor was found to be significant. non-significant in children with autism spectrum disorders
For children with IEDs, significant main effects were found having no IED. The effects of K-ABC scores on C in the
for the SRS total T-score [t(14) ¼ 3.84, P ¼ 0.002] and theta band were non-significant in all three groups: aut-
sex [t(14) ¼ 3.95, P ¼ 0.002]. No other factor was found ism spectrum disorders with IEDs, autism spectrum disor-
to be significant. Those results indicate that higher SRS T- ders without IEDs and TD children.
score and being male are associated with higher C in the For children with autism spectrum disorders, with and
theta band in the presence of IEDs. without IEDs, we found significantly higher C in the
We applied the same model for TD children. In this theta band for the former group. Assuming that IED rep-
group, no factor was found to be significant. The results resents a milder form of epileptic activity (because it
are presented in Table 5. appears in the absence of clinical seizures), this result is
consistent with most earlier graph-theoretical studies for
Effects of Kaufman Assessment generalized34,36 and focal epilepsy irrespective of the ex-
perimental conditions.38–40 Evidence from those results of
Battery for Children scores on C in earlier studies suggests that the presence of epilepsy (i.e.
the theta band stronger form of epileptic activities) corresponds to higher
In the three groups, no factor was found to be signifi- C, especially for lower frequency bands. First, it is im-
cant. The results are presented in Supplementary Table 2. portant that the present and the earlier results be mostly
consistent: the epileptic activity must be significantly asso-
ciated with higher C, irrespective of their methodological
Discussion differences such as EEG or MEG, participant characteris-
tics, synchronization measures, weighted or unweighted
For TD children and children with autism spectrum dis- graphs, and eyes-open and closed. Considering these
orders, we constructed brain networks based on PLI and results, correspondence of epileptic activity and higher C
analysed the properties of those networks to explore the is unlikely to be restricted in patients with epilepsy. In
role of IEDs. In children with autism spectrum disorders, fact, it also occurs in children with autism spectrum dis-
C in the theta band was significantly higher in the pres- orders. In this sense, the present results extend evidence
ence of IEDs. In addition, children with autism spectrum obtained from the existing literature: the present report is
disorders having no IED showed significantly lower C in the first describing this association in children with non-
the theta band than TD children did. However, the dif- epileptic autism spectrum disorders. Second, aetiology of
ference was non-significant between TD children and chil- the IEDs appearing in children with autism spectrum dis-
dren with autism spectrum disorders having IEDs. orders apparently differs from that appearing with benignBrain networks in autism spectrum disorder BRAIN COMMUNICATIONS 2021: Page 11 of 13 | 11
epilepsy with a centrotemporal spike: earlier studies con- association between graph metrics on MEG/EEG-based
sistently showed lower C in the theta and other fre- brain network and autistic symptoms. In contrast to the
quency bands for this population.41–43 Alternatively, the present results, after they analysed children with autism
effects of IEDs on C vary depending on the location. In spectrum disorders, they reported non-significant associ-
this case, mostly centrotemporal foci of IEDs in benign ation for all graph metrics. However, because they did
epilepsy with a centrotemporal spike might explain that not separate the groups in terms of having IEDs, the dif-
discrepancy. Because of the small sample size (only 18 ferent patterns of the association between C and autistic
children had IEDs), we did not separate participants symptoms in children with and without IEDs might ex-
based on IED location. Therefore, further studies must be plain this discrepancy. More explicitly, a possibly larger
conducted to ascertain whether IEDs on centrotemporal portion of children having no IED might obscure the sig-
region specifically lower C. nificant relation in those who had IEDs. Here, one must
Comparison between children with autism spectrum be careful of small sample sizes and methodological dif-
Downloaded from https://academic.oup.com/braincomms/article/3/3/fcab184/6355029 by guest on 17 January 2022
disorders having no IED and TD children revealed signifi- ferences of the studies. As one example of contrast,
cantly lower C in the theta band for children with autism Takahashi et al. constructed graphs at the sensor space,
spectrum disorders. Although the methodologies differed, whereas the graphs in the present study were at the
this result is compatible with most reported graph-theor- source space. Future large-scale studies including partici-
etical studies for autism spectrum disorders.44–47 It is pants with non-epileptic autism spectrum disorders with
noteworthy that participants with autism spectrum disor- or without IEDs as well as individuals with autism spec-
ders having epilepsy44–46 or showing IEDs in their EEG47 trum disorders having co-occurring epilepsy must be con-
were excluded from analyses in those studies. Among the ducted to elucidate this association further.
remaining three studies,48–50 however, two reports We found significant difference neither for L nor SW
described non-significant difference in C (in terms of co- between each pair of the three experimental groups (i.e.
herence48 or PLI-based49 graphs) between children with TD children, autism spectrum disorder with and without
and without autism spectrum disorders.48,49 One report IEDs). It is unlikely that IEDs have a strong effect on L
described higher C (in terms of weighted-PLI-based in children with autism spectrum disorder. Similarly, chil-
graphs) in adolescents with autism spectrum disorders dren with autism spectrum disorder might not have much
compared to age-matched healthy controls.50 In contrast longer or shorter L than TD children. It is also possible
to the studies described above,44–47 participants with aut- that, in light of the inconsistent results on L from the
ism spectrum disorders having co-occurring epilepsy48,49 or earlier studies, the effect of IEDs or autism spectrum dis-
recordings containing IEDs50 were not explicitly excluded order on L are task dependent. From this perspective, a
from those three studies. Considering the results of the possible effect of IEDs or autism spectrum disorder might
present study, which suggest correspondence of higher C be blurred under our experimental condition (i.e. eyes-
and IEDs in children with autism spectrum disorders, the open under visual stimulation). Either way, one must be
possible existence of IEDs in the later three studies48–50 cautious when considering results on L in functional
might explain this inconsistency. In this sense, our results brain networks. Paths in such graphs might not corres-
confirm most findings from earlier studies,44–47 and extend pond to information flow,27 and as such, they might be
earlier results in that the effects of IEDs on functional less straightforward to interpret.
brain networks might explain discrepancies that have been This study has some methodological considerations.
reported from earlier studies.48–50 Correspondence between First, because of the small sample size (18 children with
lower C and autism spectrum disorders having no IEDs autism spectrum disorders having IEDs), we did not clas-
confirm that the network topology of autism spectrum dis- sify children with autism spectrum disorders having IEDs
orders deviates from the small-world property. Alteration in terms of the respective location of epileptic activities.
occurs in early childhood at the latest, but considering the To clarify region-specific effects of IEDs, studies examin-
present results, this deviation might be ‘normalized’ in the ing a larger sample are needed. Second, all of our partici-
existence of IEDs. pants were children. No group consisted of adolescents
We applied linear regression models to elucidate the re- or adults. The present results should not be generalized
lation between C in the theta band and autistic symp- unless the results are confirmed for older individuals.
toms. In children with autism spectrum disorders having Third, none of the TD children in this study showed
IEDs, higher C corresponded to severer autistic symp- IEDs. A future study comparing IED effects on non-epi-
toms, controlling for age and sex. However, in children leptic autism spectrum disorders and on TD children
with autism spectrum disorders having no IED, the asso- might produce interesting results elucidate whether effects
ciation was non-significant. Considering lower C in those differ between the two populations. Fourth, we kept the
who had no IED, the effect of C on autistic symptoms children still in MEG with the aid of visual attention (i.e.
seems to have some elasticity. The association between C showing a video programme) because, otherwise, it was
and autistic symptoms might be generally unclear, unless difficult to maintain their cooperation. In this sense, their
C exceeds a certain threshold. Only one report, that of a MEG data were recorded with eyes-open under visual
study by Takahashi et al.,49,64 included discussion of the stimulation. As a consequence, the observed brain activity12 | BRAIN COMMUNICATIONS 2021: Page 12 of 13 T. Hirosawa et al.
should be distinguished clearly from ‘resting state’ brain 6. Clarke DF, Roberts W, Daraksan M, et al. The prevalence of aut-
istic spectrum disorder in children surveyed in a tertiary care epi-
activity. Studies that employ attention-controlled condi- lepsy clinic. Epilepsia. 2005;46(12):1970–1977.
tions will provide more reliable evidence, although these 7. Kim HL, Donnelly JH, Tournay AE, Book TM, Filipek P. Absence
conditions will probably be difficult to achieve with of seizures despite high prevalence of epileptiform EEG abnormal-
young children. ities in children with autism monitored in a tertiary care center.
Epilepsia. 2006;47(2):394–398.
In conclusion, we demonstrated that alteration of func-
8. Rossi PG, Parmeggiani A, Bach V, Santucci M, Visconti P. EEG
tional brain networks in children with autism spectrum features and epilepsy in patients with autism. Brain Dev. 1995;
disorders depends on the existence of IEDs. Results sug- 17(3):169–174.
gest that IEDs might ‘normalize’ the deviation of autism 9. Capdevila OS, Dayyat E, Kheirandish-Gozal L, Gozal D.
spectrum disorders brain by increasing C. However, Prevalence of epileptiform activity in healthy children during sleep.
Sleep Med. 2008;9(3):303–309.
when the effect extends beyond tolerance, it actually 10. Ghacibeh GA, Fields C. Interictal epileptiform activity and autism.
exacerbates autistic symptoms. One issue of practical
Downloaded from https://academic.oup.com/braincomms/article/3/3/fcab184/6355029 by guest on 17 January 2022
Epilepsy Behav. 2015;47:158–162.
interest is the possible usefulness of C in the theta band 11. Hirosawa T, Kikuchi M, Fukai M, et al. Association between mag-
to facilitate the diagnosis of MEG recorded patients using netoencephalographic interictal epileptiform discharge and cogni-
tive function in young children with typical development and with
machine-learning algorithms. This particular application
autism spectrum disorders. Front Psychiatry. 2018;9(19):568.
is attractive in clinical practice, but it potentially circum- 12. Hirosawa T, Sowman PF, Fukai M, et al. Relationship between
vents many methodological limitations (e.g. reduced elec- epileptiform discharges and social reciprocity or cognitive function
tromagnetic signal from deep brain sources). Additional in children with and without autism spectrum disorders: An MEG
studies must be done in this respect. Such future studies, study. Psychiatry Clin Neurosci. 2020;74(9):510–511.
13. Milovanovic M, Radivojevic V, Radosavljev-Kircanski J, et al.
to confirm and elucidate the relation between C and aut- Epilepsy and interictal epileptiform activity in patients with autism
istic symptoms, must include individuals with non-epilep- spectrum disorders. Epilepsy Behav. 2019;92:45–52.
tic autism spectrum disorders having IEDs or not, and 14. Mulligan CK, Trauner DA. Incidence and behavioral correlates of
include individuals who have co-occurring epilepsy. epileptiform abnormalities in autism spectrum disorders. J Autism
Dev Disord. 2014;44(2):452–458.
15. Hartley-McAndrew M, Weinstock A. Autism Spectrum Disorder:
Correlation between aberrant behaviors, EEG abnormalities and
Supplementary material seizures. Neurol Int. 2010;2(1):e10.
16. Nicotera AG, Hagerman RJ, Catania MV, et al. EEG abnormal-
Supplementary material is available at Brain ities as a neurophysiological biomarker of severity in Autism
Communications online. Spectrum Disorder: A pilot cohort study. J Autism Dev Disord.
2019;49(6):2337–2347.
17. Yasuhara A. Correlation between EEG abnormalities and symp-
toms of autism spectrum disorder (ASD). Brain Dev. 2010;32(10):
Funding 791–798.
18. Ewen JB, Marvin AR, Law K, Lipkin PH. Epilepsy and autism se-
This work was supported by the Center of Innovation verity: A study of 6,975 children. Autism Res. 2019;12(8):
Program of the Japan Science and Technology Agency, JST. 1251–1259.
19. Ishii R, Canuet L. MEG revealed new functional hub of atypical
brain network in autism spectrum disorders. Clin Neurophysiol.
Competing interests 2018;129(9):2022–2023.
20. Horwitz B. The elusive concept of brain connectivity. Neuroimage.
The authors report no competing interests. 2003;19(2):466–470.
21. Friston KJ. Functional and effective connectivity in neuroimaging:
A synthesis. Hum Brain Mapp. 1994;2(1-2):56–78.
22. Donner TH, Siegel M. A framework for local cortical oscillation
References patterns. Trends Cogn Sci. 2011;15(5):191–199.
23. O’Reilly C, Lewis JD, Elsabbagh M. Is functional brain connectiv-
1. American Psychiatric Association. Diagnostic and statistical man- ity atypical in autism? A systematic review of EEG and MEG stud-
ual of mental disorders (5th ed.). Arlington, VA. 2013. ies. PLoS One. 2017;12(5):e0175870.
2. Christensen DL, Baio J, Van Naarden Braun K, et al. Prevalence 24. De Vico Fallani F, Richiardi J, Chavez M, Achard S. Graph ana-
and characteristics of autism spectrum disorder among children lysis of functional brain networks: Practical issues in translational
aged 8 years—Autism and developmental disabilities monitoring neuroscience. Philos Trans R Soc B Biol Sci. 2014;369(1653):
network, 11 sites, United States, 2012. MMWR Surveill Summ. 20130521.
2018;65(13):1–23. 25. Strogatz SH. Exploring complex networks. Nature. 2001;
3. Borusiak P, Zilbauer M, Jenke ACW. Prevalence of epileptiform 410(6825):268–276.
discharges in healthy children—New data from a prospective study 26. Bullmore E, Sporns O. Complex brain networks: Graph theoretical
using digital EEG. Epilepsia. 2010;51(7):1185–1188. analysis of structural and functional systems. Nat Rev Neurosci.
4. Bryson SE, Clark BS, Smith IM. First report of a Canadian epi- 2009;10(3):186–198.
demiological study of autistic syndromes. J Child Psychol 27. Rubinov M, Sporns O. Complex network measures of brain con-
Psychiatry. 1988;29(4):433–445. nectivity: Uses and interpretations. Neuroimage. 2010;52(3):
5. Hughes JR, Melyn M. EEG and seizures in autistic children and 1059–1069.
adolescents: Further findings with therapeutic implications. Clin 28. Watts DJ, Strogatz SH. Collective dynamics of “small-world” net-
EEG Neurosci. 2005;36(1):15–20. works. Nature. 1998;393(6684):440–442.Brain networks in autism spectrum disorder BRAIN COMMUNICATIONS 2021: Page 13 of 13 | 13
29. Bullmore ET, Bassett DS. Brain graphs: Graphical models of the 46. Barttfeld P, Wicker B, Cukier S, Navarta S, Lew S, Sigman M. A
human brain connectome. Annu Rev Clin Psychol. 2011;7: big-world network in ASD: Dynamical connectivity analysis
113–140. reflects a deficit in long-range connections and an excess of short-
30. Stam CJ, de Haan W, Daffertshofer A, et al. Graph theoretical range connections. Neuropsychologia. 2011;49(2):254–263.
analysis of magnetoencephalographic functional connectivity in 47. Boersma M, Kemner C, de Reus MA, et al. Disrupted functional
Alzheimer’s disease. Brain. 2009;132(Pt 1):213–224. brain networks in autistic toddlers. Brain Connect. 2013;3(1):
31. Zhang J, Wang J, Wu Q, et al. Disrupted brain connectivity net- 41–49.
works in drug-naive, first-episode major depressive disorder. Biol 48. Peters JM, Taquet M, Vega C, et al. Brain functional networks in
Psychiatry. 2011;70(4):334–342. syndromic and non-syndromic autism: A graph theoretical study
32. Micheloyannis S, Pachou E, Stam CJ, et al. Small-world networks of EEG connectivity. BMC Med. 2013;11:54.
and disturbed functional connectivity in schizophrenia. Schizophr 49. Takahashi T, Yamanishi T, Nobukawa S, et al. Band-specific atyp-
Res. 2006;87(1-3):60–66. ical functional connectivity pattern in childhood autism spectrum
33. Pegg EJ, Taylor JR, Keller SS, Mohanraj R. Interictal structural disorder. Clin Neurophysiol. 2017;128(8):1457–1465.
and functional connectivity in idiopathic generalized epilepsy: A 50. Ye AX, Leung RC, Schäfer CB, Taylor MJ, Doesburg SM.
Downloaded from https://academic.oup.com/braincomms/article/3/3/fcab184/6355029 by guest on 17 January 2022
systematic review of graph theoretical studies. Epilepsy Behav. Atypical resting synchrony in autism spectrum disorder. Hum
2020;106:107013. Brain Mapp. 2014;35(12):6049–6066.
34. Chowdhury FA, Woldman W, FitzGerald THB, et al. Revealing a 51. Lewine JD, Andrews R, Chez M, et al. Magnetoencephalographic
brain network endophenotype in families with idiopathic general- patterns of epileptiform activity in children with regressive autism
ised epilepsy. PLoS One. 2014;9(10):e110136. spectrum disorders. Pediatrics. 1999;104(3 Pt 1):405–418.
35. Elshahabi A, Klamer S, Sahib AK, Lerche H, Braun C, Focke NK. 52. American Psychiatric Association [APA]. Diagnostic and Statistical
Magnetoencephalography reveals a widespread increase in net- Manual of Mental Disorders, Fourth Edition, Text Revision
work connectivity in idiopathic/genetic generalized epilepsy. PLoS (DSM-IV-TR), Washington, DC. 2000.
One. 2015;10(9):e0138119. 53. Wing L, Leekam SR, Libby SJ, Gould J, Larcombe M. The
36. Chavez M, Valencia M, Navarro V, Latora V, Martinerie J. Diagnostic Interview for Social and Communication Disorders:
Functional modularity of background activities in normal and epi- Background, inter-rater reliability and clinical use. J Child Psychol
leptic brain networks. Phys Rev Lett. 2010;104(11):118701. Psychiatry Allied Discip. 2002;43(3):307–325.
37. Lee HJ, Park KM. Structural and functional connectivity in newly 54. Lord C, Risi S, Lambrecht L, et al. The Autism Diagnostic
diagnosed juvenile myoclonic epilepsy. Acta Neurol Scand. 2019; Observation Schedule–Generic: A standard measure of social and
139(5):469–475. communication deficits associated with the spectrum of autism. J
38. Horstmann MT, Bialonski S, Noennig N, et al. State dependent Autism Dev Disord. 2000;30(3):205–223.
properties of epileptic brain networks: Comparative graph-theoret- 55. Hirosawa T, Kontani K, Fukai M, et al. Different associations be-
ical analyses of simultaneously recorded EEG and MEG. Clin tween intelligence and social cognition in children with and with-
Neurophysiol. 2010;121(2):172–185. out autism spectrum disorders. PLoS One. 2020;15(8):e0235380.
39. Quraan MA, McCormick C, Cohn M, Valiante TA, McAndrews 56. Constantino J, Gruber C. Social Responsiveness Scale (SRS) man-
MP. Altered resting state brain dynamics in temporal lobe epilepsy ual. Los Angeles, CA: Western Psychological Services; 2005.
can be observed in spectral power, functional connectivity and 57. Kaufman A, Kaufman N. Kaufman assessment battery for chil-
graph theory metrics. PLoS One. 2013;8(7):e68609. dren. Circle Pines, MN: American Guidance Service; 1983.
40. Wang B, Meng L. Functional brain network alterations in epilepsy: 58. Yoshimura Y, Kikuchi M, Shitamichi K, et al. Language perform-
A magnetoencephalography study. Epilepsy Res. 2016;126:62–69. ance and auditory evoked fields in 2- to 5-year-old children. Eur J
41. Adebimpe A, Aarabi A, Bourel-Ponchel E, Mahmoudzadeh M, Neurosci. 2012;35(4):644–650.
Wallois F. EEG resting state functional connectivity analysis in 59. Wa C. IFCN recommendations for the practice of clinical neuro-
children with benign epilepsy with centrotemporal spikes. Front physiology Amsterdam. New York, NY: Elsevier; 1983.
Neurosci. 2016;31(10):143. 60. Hasegawa C, Ikeda T, Yoshimura Y, et al. Mu rhythm suppres-
42. Adebimpe A, Aarabi A, Bourel-Ponchel E, Mahmoudzadeh M, sion reflects mother-child face-to-face interactions: A pilot study
Wallois F. Functional brain dysfunction in patients with benign with simultaneous MEG recording. Sci Rep. 2016;6:34977.
childhood epilepsy as revealed by graph theory. PLoS One. 2015; 61. Tadel F, Baillet S, Mosher JC, Pantazis D, Leahy RM. Brainstorm:
10(10):e0139228. A user-friendly application for MEG/EEG analysis. Comput Intell
43. Choi HS, Chung YG, Choi SA, et al. Electroencephalographic rest- Neurosci. 2011;2011:879716.
ing-state functional connectivity of benign epilepsy with centrotem- 62. Stam CJ, Nolte G, Daffertshofer A. Phase lag index: Assessment of
poral spikes. J Clin Neurol. 2019;15(2):211–220. functional connectivity from multichannel EEG and MEG with
44. Pollonini L, Patidar U, Situ N, Rezaie R, Papanicolaou AC, diminished bias from common sources. Hum Brain Mapp. 2007;
Zouridakis G. Functional connectivity networks in the autistic and 28(11):1178–1193.
healthy brain assessed using Granger causality. 2010 Annu Int 63. Blackwell M, Iacus S, King G, Porro G. Cem: Coarsened exact
Conf IEEE Eng Med Biol Soc EMBC’10. 2010;2010:1730–1733. matching in Stata. Stata J. 2009;9(4):524–546.
45. Tsiaras V, Simos PG, Rezaie R, et al. Extracting biomarkers of 64. White H. A heteroskedasticity-consistent covariance matrix estima-
autism from MEG resting-state functional connectivity networks. tor and a direct test for heteroskedasticity. Econometrica. 1980;
Comput Biol Med. 2011;41(12):1166–1177. 48(4):817–838.You can also read