ERepository @ Seton Hall - Seton Hall University
←
→
Page content transcription
If your browser does not render page correctly, please read the page content below
Seton Hall University
eRepository @ Seton Hall

Seton Hall University Dissertations and Theses Seton Hall University Dissertations and Theses
(ETDs)

Spring 5-20-2021

Experimental Investigation of Surface Resistivity of Yttrium
Stabilized Zirconium as a Thin Film
Matthew J. Melfi
melfimat@shu.edu

Follow this and additional works at: https://scholarship.shu.edu/dissertations

 Part of the Ceramic Materials Commons, Nanoscience and Nanotechnology Commons, and the
Semiconductor and Optical Materials Commons

Recommended Citation
Melfi, Matthew J., "Experimental Investigation of Surface Resistivity of Yttrium Stabilized Zirconium as a
Thin Film" (2021). Seton Hall University Dissertations and Theses (ETDs). 2886.
https://scholarship.shu.edu/dissertations/2886
Experimental Investigation of Surface Resistivity of Yttrium Stabilized Zirconium as a Thin

 Film

 By

 Matthew J. Melfi

 Submitted in partial fulfillment of the requirements for the degree

 Master of Science

 Department of Physics

 Seton Hall University

 May 2021
© 2021 Matthew J. Melfi
Seton Hall University
 Collage of Arts and Sciences
 Department of Physics

 Approval for Successful Defense

Matthew J. Melfi has successfully defended and made the required modifications to the text of
the master’s thesis for the M.S. during this Spring semester 2021.

 Master’s Committee
 (Please sign and date beside your name)

Mentor:
Dr. M. Alper Sahiner

Committee Member:
Dr. Erie Morales

Committee Member:
Dr. Stephen Kelty

 The mentor and any other committee members who wish to review revisions will sign and data
this document only when revisions have been completed. Please return this form to the Office of
Graduate Studies, where I will be placed in the candidate’s file and submit a copy with your final
 thesis to be bound as page number two.
Acknowledgement

 I would like to thank Seton Hall University for being my place of educational home since

the Fall 2016 semester, giving me the opportunity to obtain a Bachelor of Science in Physics and

now a Master of Science in Physics as well. I would like to thank all the professors that I have had

over my time in Seton Hall. They each have helped and grown me in a particular manner. I would

like specially to thank Dr. Sahiner, Dr. Morales, and Dr. Kelty for being part of my thesis

committee. I would also like to thank my family for the constant encouragement throughout the

years and pushing me to accomplish this goal. I also would like to thank the Advanced Material

Synthesis and Characterization Lab (AMSCL) for their help over the years.

 i
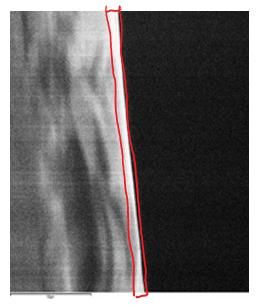
Table of Content

Contents
Abstract ....................................................................................................................................................... vii
Introduction ................................................................................................................................................... 1
 Fuel Cell .................................................................................................................................................... 1
 Production of Hydrogen from Methanol................................................................................................... 2
 History of fuel cells ................................................................................................................................... 4
 Modern day usages of fuel cells ................................................................................................................ 5
 Transportation application .................................................................................................................... 6
 Stationary Power ................................................................................................................................... 7
 Future of Fuel Cells .................................................................................................................................. 8
 Types of Fuel Cell..................................................................................................................................... 9
 Phosphoric acid fuel cell ..................................................................................................................... 10
 Polymer electrolyte membrane fuel cell ............................................................................................. 10
 Alkaline fuel cell ................................................................................................................................. 11
 Molten carbonate fuel cell................................................................................................................... 12
 Solid oxide fuel cell ............................................................................................................................ 13
First Law of Thermodynamics .................................................................................................................... 16
Concept behind the methods ....................................................................................................................... 19
 Pulsed Laser Deposition ......................................................................................................................... 19
 Ellipsometer ............................................................................................................................................ 20
 Four-point probe ..................................................................................................................................... 21
 Bulk Layer .......................................................................................................................................... 22
 Thin layer ............................................................................................................................................ 22
 Scanning Electron Microscope ............................................................................................................... 23
Methods ...................................................................................................................................................... 24
 Targets .................................................................................................................................................... 24
 Pulsed Laser Deposition ......................................................................................................................... 26
 Ellipsometer ............................................................................................................................................ 27
 4-point probe ........................................................................................................................................... 28
 Scanning Electron Microscope ............................................................................................................... 29
Results ......................................................................................................................................................... 30

 ii
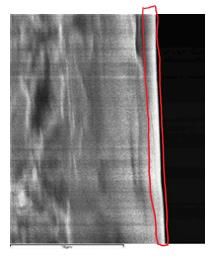
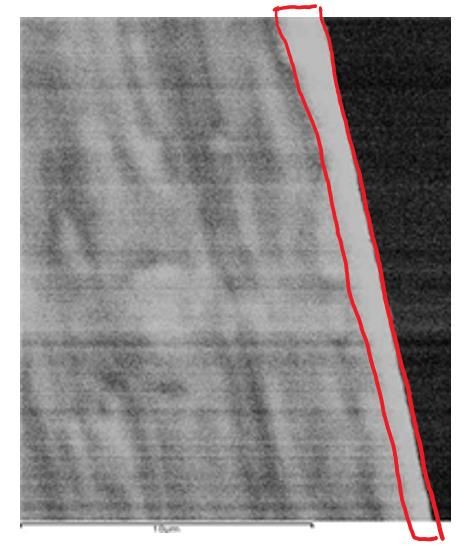
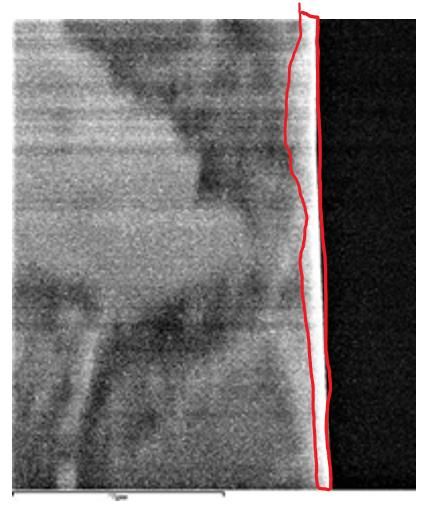
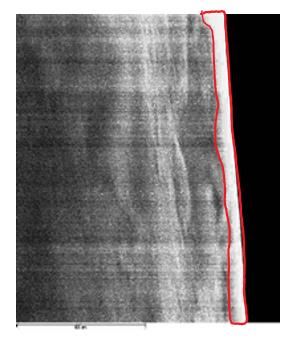
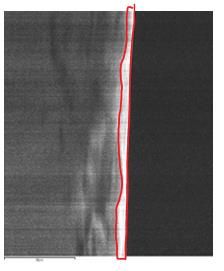
Ellipsometer ............................................................................................................................................ 30
 4-point probe and Resistivity .................................................................................................................. 34
 Scanning Electron Microscope ............................................................................................................... 40
Discussion ................................................................................................................................................... 44
Conclusion .................................................................................................................................................. 51
Work Cited .................................................................................................................................................. 52

 iii
List of Tables

Table 1: Grams of each compound in each target ....................................................................................... 25
Table 2: Parameters used for all Pulsed Laser Depositions .......................................................... 27
Table 3: Ellipsometer readings of 100 mJ onto Polished Zirconium in Angstroms ..................... 30
Table 4: Ellipsometer readings of 120 mJ onto Polished Zr in Angstroms .................................. 31
Table 5: Ellipsometer readings of 100 mJ onto Polished 2 3in Angstroms ............................ 31
Table 6: Ellipsometer readings of 120 mJ onto Polished 2 3 in Angstroms ........................... 32
Table 7: Ellipsometer readings of 100 mJ onto Polished Silicon in Angstroms .......................... 33
Table 8: Ellipsometer readings of 120 mJ onto Polished Silicon in Angstroms .......................... 33
Table 9: Average Sheet Resistance of 100 mJ onto Polished Zirconium ..................................... 34
Table 10: Average Sheet Resistance of 120 mJ onto Polished Zirconium ................................... 35
Table 11: Average Sheet Resistance of 100 mJ onto Polished 2 3 ......................................... 35
Table 12: Average Sheet Resistance of 120 mJ onto Polished 2 3 ......................................... 36
Table 13: Average Sheet Resistance of 100 mJ onto Polished Silicon......................................... 36
Table 14: Average Sheet Resistance of 120 mJ onto Polished Silicon......................................... 37
Table 15: Resistivity value for 100 mJ on Polished Zirconium.................................................... 37
Table 16: Resistivity value for 120 mJ on Polished Zirconium.................................................... 38
Table 17: Resistivity value for 100 mJ on Polished 2 3.......................................................... 38
Table 18: Resistivity value for 120 mJ on Polished 2 3.......................................................... 39
Table 19: Resistivity value for 100 mJ on Polished Silicon ......................................................... 39
Table 20: Resistivity value for 120 mJ on Polished Silicon ......................................................... 40
Table 21: Key points for 100 mJ onto Polished Zirconium .......................................................... 44
Table 22: Key points for 120 mJ onto Polished Zirconium .......................................................... 45
Table 23: Key points for 100 mJ onto Polished 2 3 ................................................................ 46
Table 24: Key points for 120 mJ onto Polished 2 3 ................................................................ 46
Table 25: Key points for 100 mJ onto Polished Silicon ............................................................... 48
Table 26: Key points for 120 mJ onto Polished Silicon ............................................................... 48

 iv
List of Figures

Figure 1: Schematic of a fuel cell ................................................................................................................. 1
Figure 2: Fuel cell components ....................................................................................................... 2
Figure 3: Reforming process of methanol and water ...................................................................... 3
Figure 4: Original fuel cell design .................................................................................................. 5
Figure 5: Modern version of a fuel cell .......................................................................................... 6
Figure 6: Image of pulsed laser deposition process ...................................................................... 19
Figure 7: Schematic of an Ellipsometer ........................................................................................ 21
Figure 8: Schematic of 4-point probe ........................................................................................... 22
Figure 9: Doping and vacancy transport in YSZ .......................................................................... 24
Figure 10: Ellipsometer and 4-point probe positioning ................................................................ 28
Figure 11: SEM imagery of 20.99 ∙ ( 2 3)0.01 on Polished Zr at 100 mJ ....................... 40
Figure 12: SEM imagery of 20.93 ∙ ( 2 3)0.07 on Polished Zr at 100 mJ ....................... 41
Figure 13: SEM imagery of 20.99 ∙ ( 2 3)0.01 on Polished 2 3 at 100 mJ ................ 41
Figure 14: SEM imagery of 20.92 ∙ ( 2 3)0.08 on Polished 2 3 at 100 mJ ................ 42
Figure 15: SEM imagery of 20.97 ∙ ( 2 3)0.03 on Polished Si at 100 mJ ........................ 42
Figure 16: SEM imagery of 20.92 ∙ ( 2 3)0.08 on Polished Si at 100 mJ ........................ 43
Figure 17: Graph for key points for 100 mJ and 120 mJ onto Polished Zirconium ..................... 45
Figure 18: Graph for key points for 100 mJ and 120 mJ onto Polished 2 3 ........................... 47
Figure 19: Graph for key points for 100 mJ and 120 mJ onto Polished Silicon ........................... 49
Figure 20: Comparison of Polished Zirconium, Polished Al2O3, and Polished Silicon with 100
mJ and 120 mJ .............................................................................................................................. 50

 v
List of Equations

Equation 1: Equation for the Anode ............................................................................................... 2
Equation 2: Equation for the Cathode ............................................................................................. 2
Equation 3: Equation for the Anode and Cathode .......................................................................... 2
Equation 4:Endothermic reaction ................................................................................................... 4
Equation 5: Exothermic reaction .................................................................................................... 4
Equation 6: By product of the Exothermic reaction ....................................................................... 4
Equation 7: Gibbs Free Equation .................................................................................................. 16
Equation 8: First Law of thermodynamics.................................................................................... 16
Equation 9: Plugging the First Law of thermodynamics into the Gibbs free Equation ................ 16
Equation 10: Plugging the First Law of thermodynamics into the Gibbs free Equation simplified
....................................................................................................................................................... 17
Equation 11: Electrical Work........................................................................................................ 17
Equation 12: Reversible Work ...................................................................................................... 17
Equation 13: Exergetic efficiency formula ................................................................................... 17
Equation 14: Equation for maximum thermal efficiency ............................................................. 17
Equation 15: Equation for Actual thermal efficiency ................................................................... 18
Equation 16: Bulk resistivity equation .......................................................................................... 22
Equation 17: Conductivity equation ............................................................................................. 22
Equation 18: Thin Film resistivity equation ................................................................................. 23
Equation 19: Volume of a cylinder ............................................................................................... 25
Equation 20: Percent 2 in mixture ......................................................................................... 25
Equation 21: Percent 2 3 in mixture ......................................................................................... 25
Equation 22: Density of ( 2)1 − ∙ ( 2 3) ........................................................................ 25
Equation 23: Mass of( 2)1 − ∙ ( 2 3) targets ................................................................. 26
Equation 24: mol of 2 ............................................................................................................ 26
Equation 25: mol of 2 3 ............................................................................................................ 26
Equation 26: Concentration of the compound .............................................................................. 26

 vi
Abstract
 Solid Oxide Fuel Cells are devices that use electrochemical reactions to convert chemical

energy from fuel to electricity. In comparison with coal power plants, a Solid Oxide Fuel Cell,

produces a higher electrical conversion efficiency. However, at higher temperatures (1000°C) it

creates a lower ionic conductivity, which limit the Solid Oxide Fuel Cells. When lowering the

temperature, the ohmic resistance increases. In our research, an Yttrium Stabilized Zirconium layer

will be produced from a fine dimple grain structure allowing high flow of oxygen mobility. This

mobility increases ionic conductivity and decrease ohmic loss. The goal of our research is first to

determine the surface resistivity for the simulated Yttrium Stabilized Zirconium structures

optimize the experimental film deposition parameters that will lead to minimum surface resistivity

in these films Yttrium Stabilized Zirconium thin film synthesis using pulsed laser deposition leads

to minimize ohmic resistance of the films at optimum film thickness. We will use Zirconium,

 2 3, and Silicon substrates for the Yttrium Stabilized Zirconium films and compare the

properties of the Yttrium Stabilized Zirconium layer. The thin films will be characterized through

electrical measurements such as 4-point probe resistivity measurements as well as Scanning

Electron Microscopy, for the structural characterization.

 vii
Introduction
Fuel Cell
 Fuel Cells is a drastically new approach in making electrical power that can be powered by

a vast number of fuels. But this new production of electricity is like no other. A fuel cell consists

of three different layers, the anode, electrolyte, and cathode layers. From the cathode, Oxygen, in

either the pure form or from air, is reduced to the oxygen ions [1]. The fuel for these Fuel Cells

can be a range of fuels. For instance, the fuel can be any ordinary fuel, but 2 (Hydrogen) is the

typical fuel used and the oxidant in the reaction is (Oxygen), from air. In a typical configuration,

the fuel is piped through the anode, negatively charged, and the oxidant is piped through the

cathode, positively charged. For instance, if 2 enters the anode the chemical reaction and

separates into the positive ions and electrons. From this reaction produces an extreme amount of

heat. Then the ions travel through the electrode and then unites with the oxidant in the cathode.

The product from this reaction is water. This process can be simplified by looking at the following

equations [2].

 [3] Adapted from Ceramic Fuel Cells

Figure 1: Schematic of a fuel cell.

 1
[3] Adapted from Ceramic Fuel Cells

Figure 2: Fuel cell components.

Anode: 2 → 2 + + 2 −
Equation 1: Equation for the Anode
 1
Cathode: 2 + + 2 2 + 2 − → 2

Equation 2: Equation for the Cathode
 1
Total: 2 + 2 2 → 2

Equation 3: Equation for the Anode and Cathode
 The current production of electricity from Fuel Cells is DC (Direct Current). Most

applications that use DC need a DC-DC converter. This DC-DC converter converts the output

from the Fuel Cell into required voltage and currents for the system. If AC (Alternate Current) is

needed an inverter is used to convert the electricity. However, a single Fuel Cell produces not

enough energy for many applications. But Fuel Cells can be joined, like batteries, to produce higher

power [4].

Production of Hydrogen from Methanol
 As shown from earlier, fuel cells need hydrogen or hydrogen rich duel to produce

electricity. The only exhaust from this process is water vapor and carbon dioxide. One way of

producing hydrogen is to extract the hydrogen from hydrogen rich compounds. In mobile

applications, methanol, 3 or 4 , has been identified as a suitable fuel source. Current

 2
methanol reformers are usually fixed-bed catalytic reactors. However, with this process has hot

and cold spots that are in the catalyst which restricts performance. This process uses both an

endothermic and exothermic reaction. The endothermic methanol steam reforming with the

exothermic combustion of methanol or hydrogen containing gas from the fuel cell ensuring good

heat transfer characteristics which are beneficial for the dynamical response at start-up and during

transient.

 [5]

 Adapted from Catalytic production of hydrogen from methanol

Figure 3: Reforming process of methanol and water
 This process is feed and consists of vaporized methanol and water. Part of the methanol

vapor and hydrogen from the fuel cell anode off gas is mixed with air and catalytically combusted

in the combustion section of the system to generate the heat for the steam reforming of methanol

 3
in the reforming section. The hot flue gas from the combustor can be used to heat up water and

methanol. The catalytic steam from the reforming methanol process yields a reformed composite.

This composite has a 75 vol % of 2 , and 25 vol % 2. This composite may also contain residual

methanol and [5].

 3 + 2 → 3 2 + 2
Equation 4:Endothermic reaction

2 3 + 3 2 → 2 2 + 4 2
Equation 5: Exothermic reaction

2 2 + 2 → 2 2
Equation 6: By product of the Exothermic reaction
History of fuel cells
 The original concept of a fuel cell was first conceived by a Welshmen, Sir William Grove,

in 1802 he devised a simple electrochemical cell using oxygen that was able to deliver a small

electrics shock. This device had a carbon anode with a nitric acid electrolyte. However, he never

published the findings from this experiment. The original device was called a Grove cell. Sir

William Grove in 1838 teamed up with a Christian Friedrich Schonbein, German scientist. They

were exploring the idea of that if water could be split into its constituent elements by an electrical

current, then the process could be reversed, and hydrogen and oxygen used to generate a current.

Grove’s letter on the subject was published in The London and Edinburgh Philosophical Magazine

and Journal of Science in December 1838, Schonbein’s in 1839 and in consequence Grove is now

considered the father of the fuel cell [6]. The original fuel cell called for a diluted Sulfuric acid as

the electrolyte, zinc as the anode, and platinum as the cathode in a porous ceramic pot at room

temperature. Walther Nerst, a German, produced the first ceramic fuel cells with the use of a solid

oxide electrolytes at room temperature in 1899. Emil Baur and H. Preis produced the first solid

 4
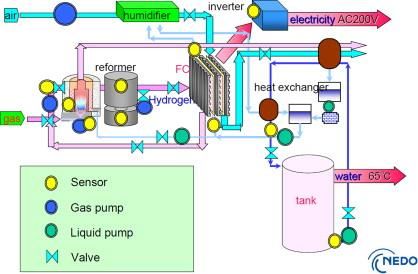
oxide fuel cell at 1000 degrees Celsius. These two individuals have shown the Nerst Mass and

other materials that have zirconia-based material have a significant ionic conduction at such high

temperatures. The Nerst Mass is a compound of 85 percent zirconia and 15 percent yttria [7].

 [8] Adapted from Solid Oxide Fuel Cells

Figure 4: Original fuel cell design
Modern day usages of fuel cells
 In modern day, research for a fuel cell is mainly for production in either a transportation

application or a stationary power source. Currently the United States government’s Department of

Transportation has given two different agencies that are in the Low and No-Emission (LoNo)

Vehicle Deployment Program. One of these awards were given to the SunLine Transit Agency in

California to construct a new maintenance facility for fuel cell buses and a learning center for staff

on the new form of technology. This award was worth $1.5 million. The other award was given to

the Stark Area Regional Transit Authority (SARTA) in Ohio to increase the amount of fuel cell

buses. This award was worth $4 million. The United States Department of Defense has also

 5
awarded the $3.46 million in the Small Business Innovation Research (SBIR) to fund four different

projects relating to fuel cells. Also, the National Aeronautics and Space Administration (NASA)

has funded the Fostering Ultra-Efficient Low Emitting Aviation Power (FUELEAP) group to

develop a fuel cell that can generate power for an electronically propelled aviation sized aircraft.

This award was almost $1 million [9].

 [2]
Adapted from Chapter 2 - Fuel Cells and the Challenges Ahead
Figure 5: Modern version of a fuel cell
Transportation application
 There are multiple different major automotive manufacturers that have a fuel cell vehicle

that is in development, testing, or for lease right now. However, automotive manufactures are not

the only ones incorporating fuel cells into production of transportation applications. Fuel cells are

also being developed into buses, locomotives, airplanes, scooters, and golf carts. Fuel cells that

use hydrogen as their fuel source produce a zero emission as a product and are much more efficient

than battery powered or combustion engines. BMW and Delphi Automotive group have come out

with a vehicle that has a solid oxide fuel cell to be used as an auxiliary power unit. This fuel cell

produces enough energy to power its mechanically driven sub-systems, such as air conditioning

and water pumps or even could run the vehicle while at idle. BMW will develop hydrogen fueled

FC forklift trucks, deploying about 2,000 in the company’s own facilities prior to marketing them to

other users. Daimler-Benz is a part owner of Ballard and partners with Ford in development of a fuel

 6
cell vehicle. Daimler has committed $725 million into their partnerships with Ballard and Ford for

development. Meanwhile Volkswagen has introduced a fuel cell powered car that is a zero-emission

vehicle. This vehicle is called the Bora HyMotion and is based on the Jetta platform. The HyMotion

has a fuel cell engine that runs on hydrogen and has a power output of 75-kilowatts [10].

Stationary Power
 Apple has recently revealed that their new Apple campus in Cupertino, California, will be

the most energy efficient building of its kind. This building will be completely powered by

renewable energy. This will be mainly possible due to two renewable technologies, a 4-megawatt

biogas fuel cell and a 16-megawatts rooftop solar cells. When additional energy is needed it will

come from a 130-megawatts solar project in Monterey County. This is due to Apple’s power

purchase agreement with First Solar. The site is designed as a microgrid—which allows Apple to

disconnect from the local grid and power the campus autonomously when grid power goes down,

providing energy resiliency [11]. While Morgan Stanley have announced in partnership with

Bloom Energy the completion of a fuel cell project in their global headquarters in New York City’s

Time Square neighborhood. This 750-kilowatt fuel cell will be able to provide about 6 million

kilowatts of clean energy each year. But this is not the only fuel cell device that Morgan Stanley

has installed, the first system was installed in their Purchase, New York headquarters [12]. Ikea

have contracted Sunnyvale-based Bloom Energy to install two fuel cell systems to their retail

stores. One was placed in the Costa Mesa retail store which is 308,000 square feet on 24 acres.

This is a 300-kilowatt fuel cell system that can produce about 2.5 million kilowatts of clean energy

per year. This fuel cell can reduce the carbon dioxide emission by 1,315 tons, which is equivalent

to 278 car’s emission or 194 homes. The other was placed in the Covina retail store which is

325,000 square feet on 12.5 acres. This is a 200-kilowatt fuel cell system that can produce about

1.67 million kilowatts of clean energy per year. This fuel cell can reduce the carbon dioxide

 7
emission by 877 tons, which is equivalent to 185 car’s emission or 130 homes [13]. Meanwhile,

Legrand North America, the parent company of Wiremold, which specializes in wire and cable

management, have recently installed a new 500-kilowatt Solid Oxide Fuel Cell to power the

263,000 square feet campus in West Hartford, Connecticut. This is expected 88 percent of the

entire campus’s power. It is expected to save approximately $2.4 million in energy costs over the

first 10 years of production [14].

Future of Fuel Cells
 Like all new forms of technology, there is a continuous need for improvement of challenges

that arise. One of these challenges that are being investigated is to improve the microstructure and

material properties that can help reduce the operating temperature of the fuel cell. This would make

the cost per cell more effective and make the thermodynamic efficiencies increase. This increase

in thermodynamic efficiencies produces a longer lifetime and have quicker start up times.

Currently, there are many approaches to solve this challenge like nanostructure thin film fuel cells,

thick film fuel cells, strained engineered materials, etc. Another challenge on which researchers

are working hard is to reduce the cost of production, storage, and transportation of hydrogen.

Researchers are trying to develop proper infrastructure that will help to rectify these problems. The

production of hydrogen through electrolysis and steam methane reforming on wide scale will help

to reduce the cost of hydrogen. Along cost effective hydrogen production, researchers are working

on cost effective storage [15, 16].

 Over the next couple of years, Europe, Japan, and the United States have a unique style

and approach in implementing and administering its fuel cells policies and programs. Japan has

created three different entities: METI, NEDO, and AIST. METI oversees the overall fuel cell R&D

program and entrusts day-to-day management to the NEDO. NEDO works in tandem with the

 8
AIST, the National Institute of Advanced Industrial Science and Technology. AIST is Japan's

largest public research organization with around 2400 researchers, comprising more than 40

autonomous research units under METI. AIST participates in NEDO’s fuel cell R&D projects and

works in collaboration with industrial participants. It also provides policy and programmatic inputs

to METI. The three entities and their work are coherent, focused, and consistent.

 Moreover, the United States has duplicative fuel cell programs. Two different programs

have been implemented under two different budgets in two different DOE components. DOE’s

Office of Fossil Energy (FE) started a fuel cell program in the 1970s and supported R&D

on PAFCs, MCFCs, and SOFCs. DOE’s Office of Energy Efficiency and Renewable Energy

(EERE) started PEMFC R&D in 2003 and gradually expanded its R&D activities to include some

SOFCs and other fuel cell types. Historically, the dual approach has been justified by the fact that

FE and EERE have two different jurisdictions; FE administers fossil fuel and PAFC, MCFC, and

SOFC R&D because those fuel cells use fossil fuels; EERE administers renewable energy and

PEMFC R&D because PEMFC uses hydrogen.

 European R&D suffers from fragmentation among EC FP and individual European

governments. Fragmentation prevented Europe from fulfilling its research and innovation

potential, at a huge cost to Europeans as taxpayers, consumers, and citizens. Starting in 2000,

Europe focused on overcoming the problem of fragmentation and launched a revolutionary policy

to coordinate activities in 2007 [15].

Types of Fuel Cell
 Over the years there have been five different fuel cells that have been studied. The

difference between these types of fuel cells is mainly due to their electrolyte layer. These five fuel

 9
cells are: phosphoric acid fuel cell, polymer electrolyte membrane fuel cell, alkaline fuel cell,

molten carbonate fuel cell, and solid oxide fuel cell.

Phosphoric acid fuel cell
 Phosphoric acid fuel cells, also known as high temperature proton exchange membrane

fuel cell, uses a platinum catalyst and the phosphoric acid layer is where the proton exchange takes

place. Phosphoric acid fuel cells typically take place at a temperature of 100-200 degrees Celsius.

in recent years of research for commercializing the phosphoric acid fuel cells, there have been

multiple different nano-porous polymers were explored for their applications. One of the best

membranes discovered thus far is Polybenzimidazole. This membrane is suitable due to its stability

in mechanical, thermal, and chemical properties. However, polybenzimidazole does not move

protons nor electrons but do require a proton conductivity to absorb phosphoric acid. When

polybenzimidazole absorbs too much phosphoric acid, it will start to decay. To accommodate the

acid capacity as well the mechanical properties are to fill the inorganic with nanoparticles with a

metal catalyst. This will allow the fuel to reach a higher power density. The typical stacking size

is 5-400 kW of power with a liquid phosphoric acid fuel cell while with a polymer membrane is
membrane electrode assembly. This is the component where the electrochemical reaction and

conversion takes place. There are two current ways of preparing the membrane electrode assembly,

by gas diffusion electron and the catalyst coated membrane. In the catalyst coated membrane

method is directly applied on both sides of the polymer electrolyte. The gas diffusion electrode is

hot pressed to the catalyst coated membrane electrode assembly prior to the assembly of the cell

hardware. In current studies the gas diffusion electrode methods are producing a better cell

performance [19, 20, 21]. Currently the most common form of electrolyte being used in the

polymer electrolyte membrane fuel cell is Perfluorosulfonic acid. The typical stacking size is
pressure of 200 psi and at about 150 degrees Celsius with 50 weight% of potassium hydroxide

electrolyte have reported current densities up to 9 A/cm^2 at approximately 0.7 V. While the

aqueous potassium hydroxide soaked in a porous matrix is typical for the electrolyte, an alkaline

polymer membrane is also typical. The typical stacking size is 1-100 kW of power with the

electrical efficiency of 60%. The plans of applications are to use in the military, space, backup

power, and transportation. The advantages and disadvantages are about equal for the Alkaline Fuel

Cells. The advantages are they have a wider range of stable materials (which mean lower cost),

low temperature, and quick start up. While the disadvantages are that they are sensitive to Carbon

Dioxide in fuels and air and the electrolyte management and conductivity [18, 22].

Molten carbonate fuel cell
 The molten carbonate fuel cells recently have attracted attention by researchers. This is due

to its fuel flexibility, high efficiency, and low pollutants emission. The standard operating

temperatures of the molten carbonate fuel cells are high compared to other fuel cells, around 500-

600 degrees Celsius. This high temperature helps the reaction rate for its cheaper catalysts. Also,

with these high temperatures, the high temperature exhaust gas can be integrated into gas turbines,

Rankine cycle, or even the organic Rankine cycle. In one study, the molten carbonate fuel cell was

able to produce an overall efficiency of 71.71% and an electrical efficiency of 42.28%. The most

common electrolyte that is used for a Molten Carbonate Fuel Cell is either a molten lithium layer,

sodium, or potassium carbonate soaked in a porous matrix. The typical stacking size is 300kW-

3MW of power with electrical efficiency of 50%. The plans of applications are to use it as electric

utility and its distributed generation. The advantages of molten carbonate fuel cells are the high

efficiency, fuel flexibility, suitable for combined heat and power, and can be coupled with gas

turbine cycles. While the disadvantages are it has high temperature corrosion and breakdown of

the cell components, long start up time, and low power density [18, 23].

 12
Solid oxide fuel cell
 Solid oxide fuel cells have become the most promising power generation methods. This is

mainly due to the high efficiency, nearly completely clean power generation, complete silent

operation, and can be coupled with a turbine cycle. Some of the electrochemical models have

momentum and heat transport showing a valuable method to study micro tubular solid oxide fuel

cells. The impact of different cell sizes on the performance can provide an idea for the cell size

design. Also, this impact can help understand how flow changes on internal current flow. But on

the contrast, the flow change will alter the consumption rate of a single cell will change. In solid

oxide fuel cells, the hydrogen is oxidized in the anode, which makes both hydrogen and steam

exist in the anode. When the fuel consumption rate is too high, the amount of steam will be too

high, which makes the anode have a large concentration polarization. The most common

electrolyte for a solid oxide fuel cell is Yttria Stabilized with high operating temperatures of 500-

1,000 degrees Celsius.

 The main feature of the solid oxide fuel cell is the high energy conversion efficiency.

Within the last couple of years of research, the efficiency of the solid oxide fuel cell has been

increasing. In the last couple of years, the electrical efficiency at rated power of the solid oxide

fuel cell has increased from 40 percent to 60 percent. While the CHP, combined heat and power,

energy efficiency for the solid oxide fuel cell has increased from 85 percent to 90 percent. Not

only has the efficiency but many other factors have been improved in the last couple of years. For

instance, the factory cost of production from 1,300-4,500 to 1,000-2,000 $/kw; the degradation

with cycling from
Yttrium stabilized zirconia
 Zirconia, zirconium IV oxide, is a compound that can have three different polymorphic

forms. These three polymorphic forms are monoclinic, tetragonal, and a face centered cubic. Pure

zirconia at room temperature is a monoclinic crystal, but when heating up to between 1,000-2,000

degrees Celsius the zirconia transforms to its tetragonal phase. Once in this tetragonal phase the

volume of the pure zirconia decreases in size. This volume shrinkage is about 3-10 %. Also, the

transforming from the monoclinic to tetragonal phase leads to a residual stresses and cracking. The

transition from tetragonal phase to the face centered cubic phase happens when the temperature is

higher than 2000 degrees Celsius. In addition, the tetragonal-face centered cubic transformation

induces another volume shrinkage. From these constant volume reductions pure zirconia cannot

be sintered. But when transforming back from a face centered cubic to the tetragonal phase the

pure zirconia the volume increases, has higher stress, and has a higher rate cracking due to the

cooling from a high temperature. To prevent the volume change during these phase changes the

zirconia must be stabilized with an oxide for the tetragonal and face centered cubic phases. Two

of the most common oxides that are used are yttria, also known as yttrium oxide, or magnesium

oxide [25].

 Pure yttria, or yttrium oxide, at room temperature is a body-centered cubic material with

bixbyite or cubit C-structure, but when heating up to just under 2,400 degrees Celsius the phase

form transforms to a hexagonal phase. Just past this transformation temperature is the melting

point of pure yttria. It is shown that a partial pressure of oxygen is a critical factor in producing a

low level of defect absorption. The main defect of pure yttria is its oxygen vacancies. When placed

in a reducing atmosphere with very high temperature, above 1,700 degrees Celsius pure yttria is

transformed from a pure white color to a black color. This black yttria has a very high absorption

 14
which can be visible. At about 900 degrees Celsius absorption increases even more. This is most

likely due to a higher concentration of the oxygen vacancies [26].

 15
First Law of Thermodynamics
 To fully understand the thermal efficiency of fuel cell the thermodynamics of the fuel cell.

The current fuel cells continuously have a production of electricity and heat. The fuel cells are

operating over a time, ∆t, in which fuel and oxidants are added to continuously added to continue

the electrical potential. If there is current is allowed, the charge carriers migrate from higher to

lower electrical and chemical potentials across the cell. Therefore, the change in Gibbs free energy,

can be shown by the following equation, of reaction drives the electrical current.

∆ = ∆ + ∆ − ∆
Equation 7: Gibbs Free Equation
 The Gibbs free energy (G) can be shown as well as energy (E), pressure (P), volume (V),

temperature (T), enthalpy (S) [27]. The First Law of Thermodynamics states the conservation of

energy, no form of energy cannot be crated or destroyed in an isolated system. However, the First

Law of Thermodynamics cannot indicate how the cell can perform while working in an isothermal

environment. According to this law the fuel cells can be assumed as reversable. The first Law of

Thermodynamics for a reversible fuel cell can be expressed by the following equation. Where heat

(q), work (w), and electrical work ( ) [28].

∆ = + = + − ∆
Equation 8: First Law of thermodynamics
 Taking this equation and plugging into the Gibbs free energy equation, it simplifies down

to the following equation. However, since the operation of a fuel cell can be reversible. Which

means the heat is equal to the temperature times the change in enthalpy.

∆ = ∆ + − ∆ + ∆ − ∆
Equation 9: Plugging the First Law of thermodynamics into the Gibbs free Equation

∆ =

 16
Equation 10: Plugging the First Law of thermodynamics into the Gibbs free Equation simplified
 This simplified Gibbs equation shows that the Gibbs free energy of reaction is equal to the

electrical work of the system. The electrical work (J) in an open system operated continuously

over a given time, Δt, where reactants (moles/second) are added, and products removed to maintain

the electrical potential is given for hydrogen–oxygen reaction the following equations

 2 ∆ ∆ = 2 ∆ =

Equation 11: Electrical Work

 2 = 2 ∆ 0 ∆ =

Equation 12: Reversible Work

Where 2 is the flow rate of hydrogen for the 2 / 2 reactions, 2 is the flow rate of

hydrogen fuel into the system. These two are important in the determining Exergetic efficiency.

The Exergetic efficiency is the total ratio of electrical work and the reversible work, which is

represented as ζ.

 2 ∆ ∆
 = = = ∆ 0
 2 ∆ 0

Equation 13: Exergetic efficiency formula
Using the equation for the reversible work, one can calculate the maximum thermal efficiency

(maximum work for given energy input) of a fuel cell or fuel cell hybrid (fuel cell and heat engine)

system for the 2 oxidation reaction, where ∆H 0 is the reaction enthalpy for hydrogen direct

oxidation (J/mole) at standard temperature and pressure and where the inlet hydrogen is completely

utilized in the fuel cell:

 ∆ 0
 ℎ = ∆ 0

Equation 14: Equation for maximum thermal efficiency
While the actual thermal efficiency can be written as [27]

 17
 = ℎ ( )
Equation 15: Equation for Actual thermal efficiency

 18
Concept behind the methods
Pulsed Laser Deposition
 Pulsed laser deposition is one of the simpler techniques in creating thin films. The pulsed

laser deposition technique uses a pulsed laser that irradiated the surface of the target. The targeted

is the desired element or compound as a thin film. A pulsed laser is first shot at mirrors to align

the pulsed laser to a fine point. The last mirror passes the laser through a suitable window on the

side of the vacuum chamber. When the focused and sufficiently intense laser beam is focused on

the desired target leading to the ejection of material. The density and the excitation degree of the

material is very high, leading to the formation of a plume. This plume expands perpendicular to

the surface of the target. A substrate is placed a short distance away and parallel to the surface of

the target. This substrate is in the path of the plume and a fraction of the species will adhere to the

surface of the substrate. Over time, the plume continues to be in contact with the substrate creating

a film [29].

 [29] Adapted from Chapter 14 - Production of

Biomaterial Coatings by Laser-Assisted Processes

Figure 6: Image of pulsed laser deposition process

 19
The pulsed laser deposition process has been found to have advantages when compared to

other types of thin film depositions devices. One of the main advantages is when creating the films,

the same chemical structure of the target will be the same as the film. Another advantage is this

process is extremely flexible to different compounds. Another is the use of a carousel. In many

pulsed laser deposition chambers, there are carousels that hold multiple different targets. This is

useful because it saves the time from bringing the chamber back to atmospheric pressure, changing

the targets, then repumping back down to ultrahigh vacuum.

 The pulsed laser deposition process has only two main disadvantages. The first is the

particulates deposited onto the film. Two main cases for particle formation during laser

evaporation are the breakaway of surface defects under thermal shock and splashing of liquid

material due to superheating of subsurface layers. The other problem is nonuniformity over a large

are of the plume. The plasma plume that is created has a very narrow angular distribution that

comes from the target. But these disadvantages are currently being worked on for the next

generation of pulsed laser deposition machines [30].

Ellipsometer

 Ellipsometry is a very sensitive, nondestructive, nonperturbing technique that uses the

change in polarization of light upon reflection for characterization of surfaces, interfaces, and thin

films. The main principle of the ellipsometer is to change the polarization of the light that is being

reflected off the sample’s surface by measuring by taking the amplitude ratios of two

perpendicularly polarizing beams. For an isotropic, non-absorbing layers the measurement is

usually a laser, or some type of single wavelength. When the measured the refractive index,

absorption coefficient, and thickness of the layers. The ellipsometer can measure complex and

multiple layers [31]. Since the 1960s, the ellipsometry has constantly been improved its sensitivity

 20
to the nanometer scale. The widespread usage of an ellipsometer increased the production and

accuracy of the thickness of the dielectrics, semiconductors, metals, superconductors, organics,

biological coatings, and composites of materials [32].

 [32]
Adapted from “What Is Ellipsometry?”
Figure 7: Schematic of an Ellipsometer
Four-point probe
 The purpose of a Four-point probe is to measure the resistivity of a material. These

materials can be either a bulk or thin films layers. These different types of layers are expressed by

two different equations. The Four-point probe is compiled of four equally spaced metal tips,

usually made up of tungsten, with very fine radiuses. Typically, these distances between each of

the probes, , are about 1 mm apart from each other. Each tip is supported by springs on the ends

to minimize the sample damage while taking measurements. Two of these probes, usually the outer

two probes, have the current going from the probes to the layers and but in opposite charges. The

other two probes have a voltmeter connected across them [33].

 21
[33]

Figure 8: Schematic of 4-point probe
Bulk Layer
 Typically, a bulk layer is defined as a layer that has a thickness that is much greater than

the distance between two probes, . It is assumed that the probes’ radiuses are very small, in

calculations infinitesimally small, and the bulk layer has a large dimension compared to the

radiuses. The expression for the bulk resistivity is shown by the next equation and the conductivity

is the one after:

 2
 =

Equation 16: Bulk resistivity equation
 1
 =

Equation 17: Conductivity equation

Where is the bulk resistivity, is the distance between the probes, is the voltage read from the

voltmeter connected to two of the probes, and is the current passed through the other two probes.

Thin layer
 Unlike the bulk layer, the thin layer is defined as a layer that has a thickness that is much

smaller than the distance between two probes, . Also, the thin layer, requires the thickness of the

 22
layer to determine the resistivity. Like before, it is assumed that the probes’ radiuses are very small,

in calculations infinitesimally small, and the bulk layer has a large dimension compared to the

radiuses. The equation for the conductivity remains the same while the expression for the thin

resistivity is shown by the next equation where is the thickness of the layer [34]:

 = (2) ∗

Equation 18: Thin Film resistivity equation
Scanning Electron Microscope
 A Scanning Electron Microscope is a type of microscope in which uses a fine probe of

electrons to create an image. These probes are typically up to 40 keV. The probe is focused on the

desired material and then is scanned in a pattern of parallel lines. From the contact with the

electrons and the material, there are multiple different types of signals that are produced. These

electrons are collected from the impact of the incident electrons are used to form the image of the

surface of the material. The secondary electrons, usually in a scaling of a few tens of eVs, are

usually much lower than the incident electrons. These electrons are then collected and can be used

to find out the X-ray characteristics of the material. currently there is one main problem of

obtaining a high-resolution image. There are two main ways to acquire a high-resolution. The first

is to decrease the magnification on the material. At high magnification, the image’s resolution is

about the same of the width of the probe of the electrons. It is limited by a few key parameters:

aberrations of the lenses, especially the objective lens because it works at large convergence

angles, the brightness of the electron source, and the interaction volume, especially when the

samples are not very thin. The second is the conservation of the brightness in the microscope

column. The low resolutions that appear is due to the electron flux becomes too low in the probe

[35].

 23
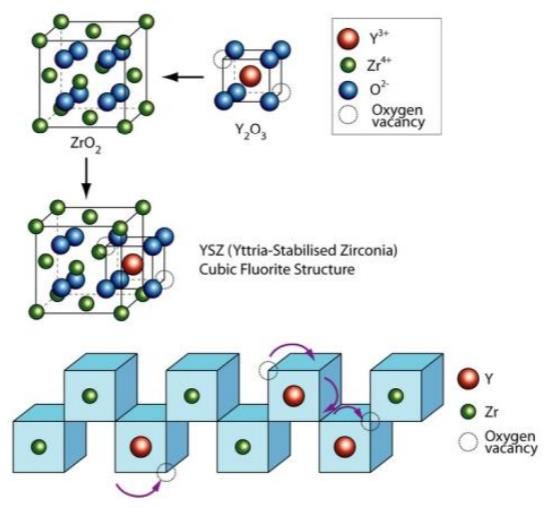
Methods
Targets
 To create the various yttrium stabilized zirconium targets needed for the depositions to

create the electrolyte layer using the Pulsed Laser Deposition method, the materials needed are

zirconium (IV) oxide and yttrium III oxide powders. The zirconium (IV) oxide being used is from

Sigma Aldrich and has a 99% trace metal basis with a powder size of about 5 m. The yttrium III

oxide being used is also from Sigma Aldrich and has a 99.99% trace metals basis. The zirconium

(IV) oxide and yttrium III oxide were ground separately at first for thirty minutes each. This was

done to create an overall uniformity in the powder size within each powder. The amount needed

from each powder to create each target was measured out, mixed, and re-grounded together for

another thirty minutes. The concentrations that will be created and studied are the following:

( 2 )0.99 ∙ ( 2 3 )0.01, ( 2 )0.97 ∙ ( 2 3 )0.03, ( 2 )0.95 ∙ ( 2 3 )0.05, ( 2 )0.93 ∙ ( 2 3 )0.07,

( 2 )0.91 ∙ ( 2 3 )0.09, and ( 2 )0.90 ∙ ( 2 3 )0.10.

 [38]

Figure 9: Doping and vacancy transport in YSZ

 24
The mixed and crushed powder was then created into cylindrical target. This was done by

placing the powder into a hydraulic press for a total of thirty minutes at an applied load of 10,000

kilograms. These targets were 0.3175 cm tall and 2.54 cm in diameter.

 ( 2 )0.99 ∙ ( 2 )0.97 ( 2 )0.95 ( 2 )0.93 ( 2 )0.92 ( 2 )0.90

 ( 2 3 )0.01, ∙ ( 2 3 )0.03 ∙ ( 2 3 )0.05 ∙ ( 2 3 )0.07 ∙ ( 2 3 )0.08 ∙ ( 2 3 )0.10

 2 8.2905 7.9910 7.7012 7.4204 7.2833 7.0155

 2 3 0.1535 0.4530 0.7428 1.0236 1.1607 1.4285

Table 1: Grams of each compound in each target

 These measurements were calculated first by calculating the volume of the cylinder that

will be used. Next the percent of each compound will be needed to calculate the combined density

of the mixture.

 = 2 ℎ
Equation 19: Volume of a cylinder
 2
% 2 = ( ) ∗ 100%
 2 + 2 3

Equation 20: Percent 2 in mixture
 2 3
% 2 3 = ( ) ∗ 100%
 2 + 2 3

Equation 21: Percent 2 3 in mixture
 % 2 % 2 3
 ( 2)1− ∙( 2 3) = (( ) ∗ 2 ) + (( ) ∗ 2 3 )
 100 100

Equation 22: Density of ( 2 )1− ∙ ( 2 3 )
 From this new density, the amount each target weighs can be calculated. The grams needed

for each composition needed can be calculated to the wanted concentrations.

 25
 ( 2)1− ∙( 2 3) = ∗ ( 2)1− ∙( 2 3)

Equation 23: Mass of( 2 )1− ∙ ( 2 3 ) targets
 2
 2 =
 2

Equation 24: mol of 2
 2 3
 2 3 = 2 3

Equation 25: mol of 2 3
 2 3
 =
 2 + 2 3

Equation 26: Concentration of the compound
 Finally, before being placed in the Pulsed Laser Deposition chamber, each of these targets

were placed into a high temperature furnace. This furnace was set to the following parameters: 25

minutes ramping rate up at 10 degrees Celsius per minute, holding at a constant 250 degrees

Celsius for sixty minutes, and then 25 minutes ramping rate downward at 10 degrees Celsius per

minute.

Pulsed Laser Deposition
 As previously stated, the method of producing the electrolyte layer is being investigated.

With this process, subtle changes in the programing of the laser can create vast differences in the

thin film layers. For instance, peak voltage, base pressure, laser pulses frequency, substrate

temperature, distance from the target to the substrate, length of the laser pulsing, laser energy,

targets, substrates, etcetera. In this experiment, these subtle changes in the programing of the laser

are being explored. Specifically, this experiment will be manipulating the laser energy and

comparing the differences if the electrolyte layer. The laser that used in this experiment is a 248-

nanometer wavelength ultraviolet Krypton Fluoride Excimer Laser (TuiLaser) from PVD

products. The targets were created by the previously discussed method, but the substrates being

used are prefabricated substrates by MTI corporation. The substrates that are being used are
 26
Polished Zr, Polished Al2 O3 , and Polished Silicon. The following table shows the parameters used

during the Pulsed Laser Deposition method deposition of the electrolyte layer.

 High Voltage 20,000-30,000 V

 Base Pressure 5.0 E -6 Torr

 Frequency 5 Hz

 Substrate Temperature 20 Degrees Celsius

 Target Distance 6 cm

 Substrate Temperature 20 Degrees Celsius

 Target Distance 6 cm

 Deposition Time 20 minutes

 Laser Energy 100 mJ or 120 mJ

 Laser Energy Density 1.188 J/cm^2 or 1425 J/cm^2

 Shots 6,000

 Target ( 2 )1− ∙ ( 2 3 )

 Substrate Polished , Polished 2 3, or Polished

Table 2: Parameters used for all Pulsed Laser Depositions
Ellipsometer
 As previously stated, an ellipsometer is a tool that can measure a thickness of a film. This

process is useful not only to determine the precision and accuracy of the thickness of a film, but

also to use this data for later calculations. In this experiment the ellipsometer program that was

used was a Gaertner Ellipsometer Program (LGEMP). In this program can calculate the thickness

of four films deposited onto each other in the value of angstroms, however in this experiment there

is one film that is being measured. The values that were entered into the program were 8000

 27
You can also read