EVALUATION OF PREBIOTIC AND PROBIOTIC AS FUNCTIONAL FEED ADDITIVES ON PHYSIOLOGICAL AND IMMUNOLOGICAL PARAMETERS OF NILE TILAPIA, OREOCHROMIS ...
←
→
Page content transcription
If your browser does not render page correctly, please read the page content below

EVALUATION OF PREBIOTIC AND PROBIOTIC AS FUNCTIONAL
FEED ADDITIVES ON PHYSIOLOGICAL AND IMMUNOLOGICAL
 PARAMETERS OF NILE TILAPIA, OREOCHROMIS NILOTICUS
 by
 Kenneth Edward Saillant Jr.

 A Thesis
 Submitted to the Faculty of Purdue University
 In Partial Fulfillment of the Requirements for the degree of

 Master of Science

 Department of Biology
 Fort Wayne, Indiana
 May 2019
2

 THE PURDUE UNIVERSITY GRADUATE SCHOOL
 STATEMENT OF COMMITTEE APPROVAL

Dr. Ahmed Mustafa, Chair
 Department of Biology
Dr. Elliott J. Blumenthal
 Department of Biology
Dr. Robert Gillespie
 Department of Biology

Approved by:
 Dr. Jordan M. Marshall
 Head of the Graduate Program
3

 DEDICATED

 TO

MY PARENTS, FOR THEIR CONSTANT LOVE AND SUPPORT,
 Elizabeth Ann Saillant and Kenneth Edward Saillant Sr.

 &

 MY FIANCÉE, MY BEST FRIEND, CONFIDANTE,
 AND MOST ARDENT SUPPORTER,
 Katrena Amber Thompson
4

 ACKNOWLEDGMENTS

 I would first like to thank my research professor, mentor, and committee chair, Dr.

Ahmed Mustafa. Without Dr. Mustafa’s guidance, advice, and critiques, this research would

have never been possible. I am proud to have had the opportunity to work under him, and I will

always be thankful for the care, support, and kindness that he has shown me throughout my time

working with him. His practice of leading by example and his leadership style have shown me

how to be a great leader, teacher, and mentor in the future.

 I would like to thank the other members of my graduate committee, Dr. Elliott J.

Blumenthal and Dr. Robert Gillespie. Dr. Elliott Blumenthal has been a great sounding board for

ideas and an excellent source of advice, and his assistance has helped me work through decisions

pertaining to this research and my future goals. Dr. Robert Gillespie has provided me with

laboratory resources necessary to complete my work, and he has also provided guidance

throughout this process. Without these two remarkable educators, this research would not have

been possible.

 I would like to thank my fellow students and research lab members: Ashley Baum,

Madison Bieber, Aparna Biswas, Joshua Brune, McKenzie Comby, Destin Furnas, Lindee

Mason, Asif Mortuza, Austin Petras, Meredith Werling, and Emma Zolman. They gave their

time on sampling days from the early morning until late in the evening, and without them, it

would not have been possible to complete this research in a timely manner.

 I would also like to thank the Biology Department staff: Bruce Arnold, Carla Barrett,

Darlene Bender, Colleen Krohn, and Arlis LaMaster. They have all provided me assistance in

one way or another throughout my time as a student and during my research. Bruce Arnold has

helped me with ordering supplies and getting equipment to function properly. Carla Barrett has
5

assisted in preparing the facility and room where the fish were raised. Darlene Bender and

Colleen Krohn have been instrumental in helping me to navigate through this entire process and

to meet all of my deadlines on time. Arlis LaMaster has been immensely helpful in preparing

glassware, instruments, and cultures that are essential to the success of sampling days. I

appreciate each and every one of them for all of their assistance.

 Finally, I would like to thank my entire family, especially my parents, Liz and Ken, my

fiancée, Katrena, and my siblings, Dan, Emily, Katie, and Mary. I know that my future successes

will be in part attributable to the sacrifices they have made for me. Without their undying love

and unwavering support, I would never have made it through this long and arduous journey.
6

 TABLE OF CONTENTS

LIST OF TABLES .......................................................................................................................... 9
LIST OF FIGURES ...................................................................................................................... 10
ABSTRACT.................................................................................................................................. 11
INTRODUCTION ........................................................................................................................ 12
MATERIALS AND METHODS .................................................................................................. 31
 Acquisition of Materials ........................................................................................................... 31
 Fish Acquisition .................................................................................................................... 31
 Prebiotic and Probiotic Acquisition ...................................................................................... 31
 Prebiotic ............................................................................................................................ 31
 Probiotic ............................................................................................................................ 32
 Maintenance of Fish .............................................................................................................. 32
 System Setup..................................................................................................................... 32
 Room and Water Quality ...................................................................................................... 33
 Room Temperature and Humidity .................................................................................... 33
 Photoperiod ....................................................................................................................... 34
 Source Water Quality........................................................................................................ 34
 Water Temperature ........................................................................................................... 34
 Dissolved Oxygen ............................................................................................................. 35
 pH...................................................................................................................................... 35
 Salinity .............................................................................................................................. 36
 Ammonia, Nitrite, and Nitrate .......................................................................................... 36
 Experimental Design................................................................................................................. 37
 Experimental Groups ............................................................................................................ 37
 Feed Preparation ................................................................................................................... 38
 Sampling Periods .................................................................................................................. 40
 Phlebotomy ........................................................................................................................... 41
 Experimental Parameters .......................................................................................................... 41
 Stress Response Parameters .................................................................................................. 41
 Serum Cortisol .................................................................................................................. 41
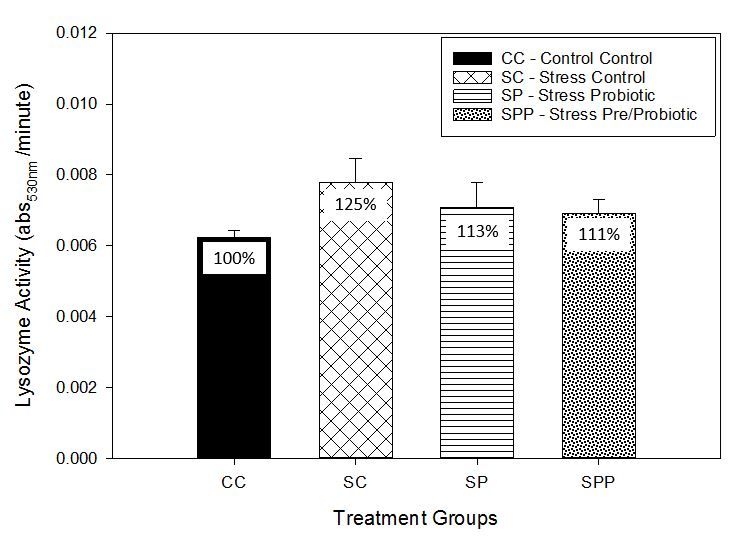
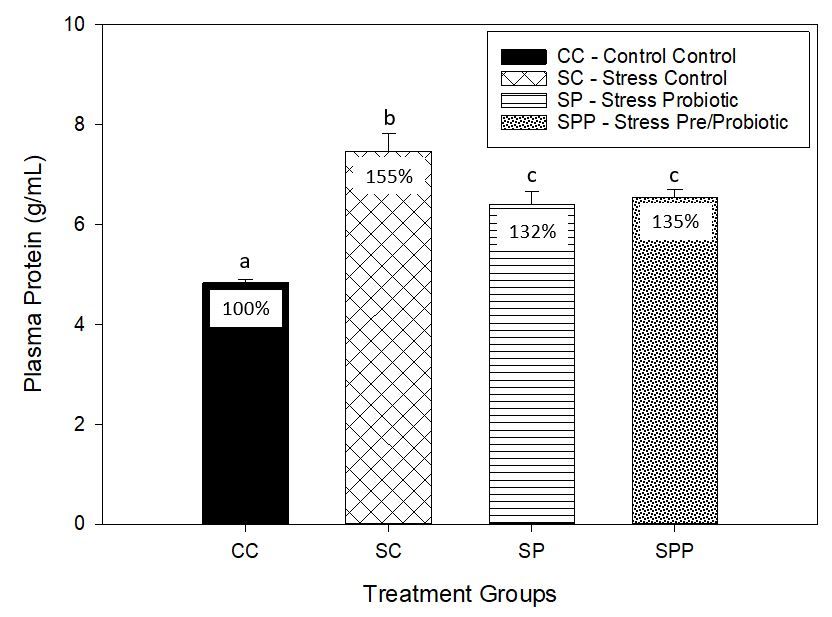
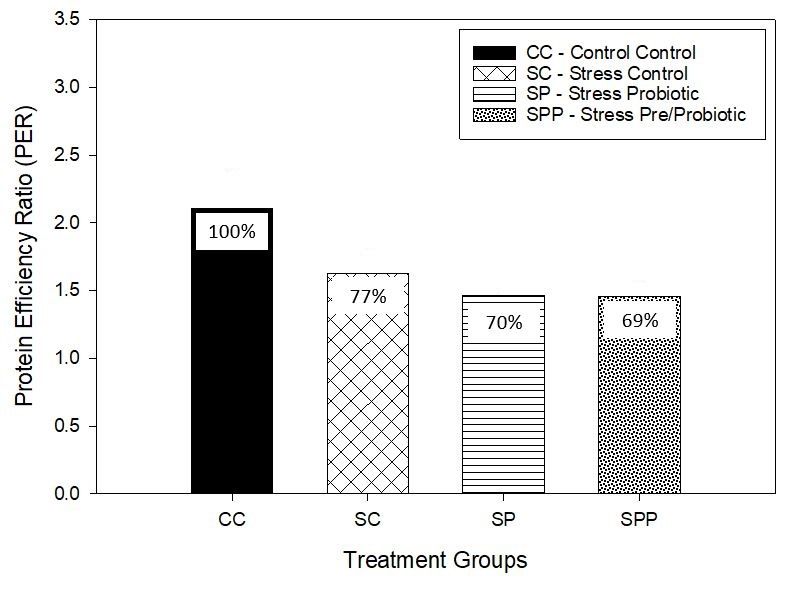
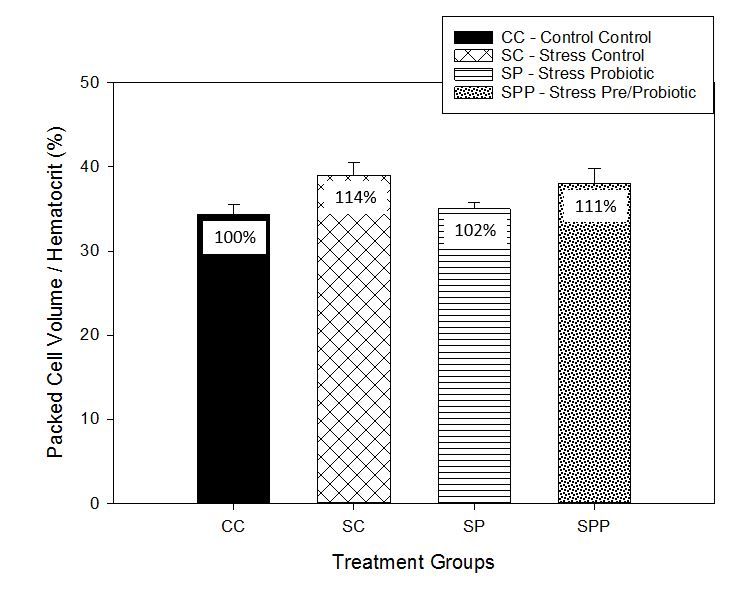
7

 Blood Glucose ................................................................................................................... 42
 Plasma Protein .................................................................................................................. 42
 Packed Cell Volume / Hematocrit .................................................................................... 42
 Hepato-Somatic Index ...................................................................................................... 43
 Spleen-Somatic Index ....................................................................................................... 44
 Lysozyme Activity ............................................................................................................ 44
 Whole Body Response Parameters ....................................................................................... 45
 Feed Conversion Ratio...................................................................................................... 45
 Specific Growth Rate ........................................................................................................ 45
 Protein Efficiency Ratio .................................................................................................... 46
 Length Gain ...................................................................................................................... 46
 Weight Gain ...................................................................................................................... 47
 Condition Factor ............................................................................................................... 47
 Graphical and Statistical Data Analysis ................................................................................ 47
RESULTS ..................................................................................................................................... 54
 Stress Response Parameters ...................................................................................................... 54
 Serum Cortisol ...................................................................................................................... 54
 Blood Glucose ....................................................................................................................... 56
 Plasma Protein ...................................................................................................................... 57
 Packed Cell Volume / Hematocrit ........................................................................................ 58
 Hepato-Somatic Index .......................................................................................................... 58
 Spleen-Somatic Index ........................................................................................................... 59
 Lysozyme Activity ................................................................................................................ 59
 Whole Body Response Parameters ........................................................................................... 60
 Feed Conversion Ratio .......................................................................................................... 60
 Specific Growth Rate ............................................................................................................ 60
 Protein Efficiency Ratio ........................................................................................................ 61
 Length Gain .......................................................................................................................... 61
 Weight Gain .......................................................................................................................... 61
 Condition Factor ................................................................................................................... 62
DISCUSSION ............................................................................................................................... 76
8

CONCLUSION ............................................................................................................................. 84
REFERENCES ............................................................................................................................. 86

9

 LIST OF TABLES

Table 1. Previous research on inulin ............................................................................................. 29
Table 2. Previous research on probiotic species ........................................................................... 30
Table 3. Room temperature and humidity .................................................................................... 50
Table 4. Source water quality ....................................................................................................... 50
Table 5. Water quality for both systems ....................................................................................... 50
Table 6. Experimental groups ....................................................................................................... 51
Table 7. Commercial feed nutritional information ....................................................................... 52
Table 8. Feed preparation ............................................................................................................. 53
Table 9. Sampling periods, sample size, and experimental parameters........................................ 53
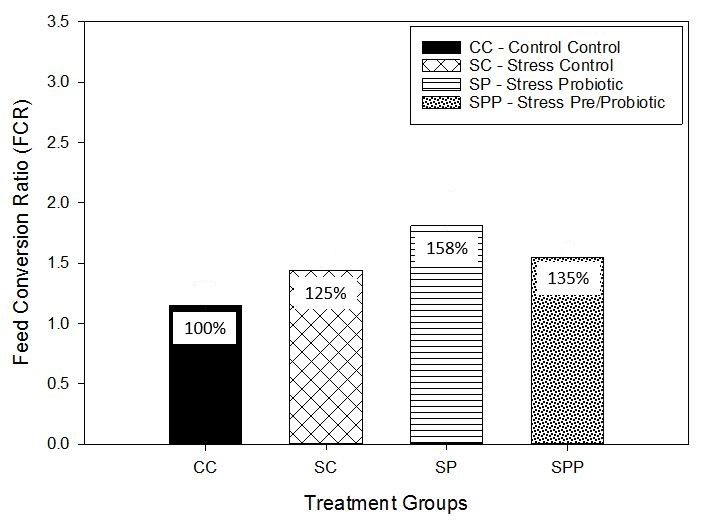
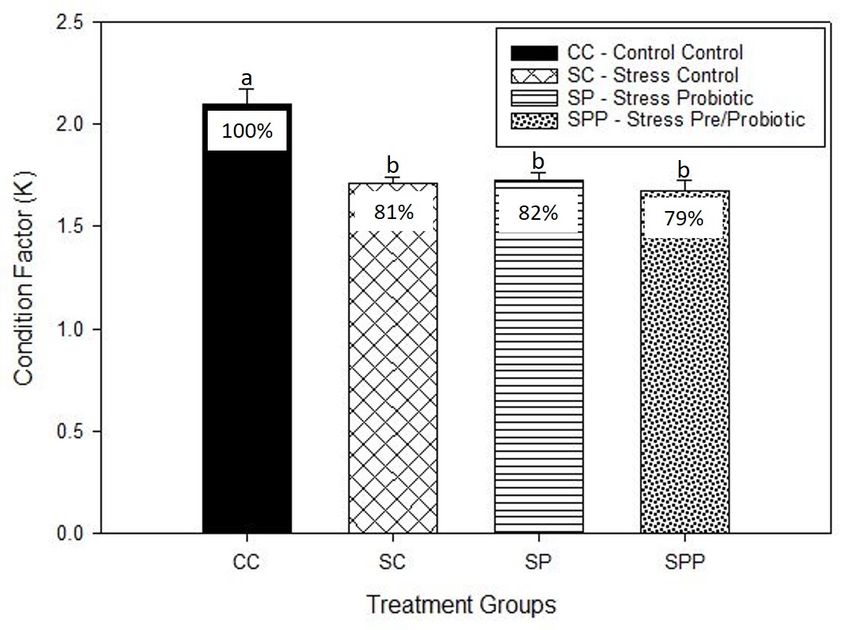
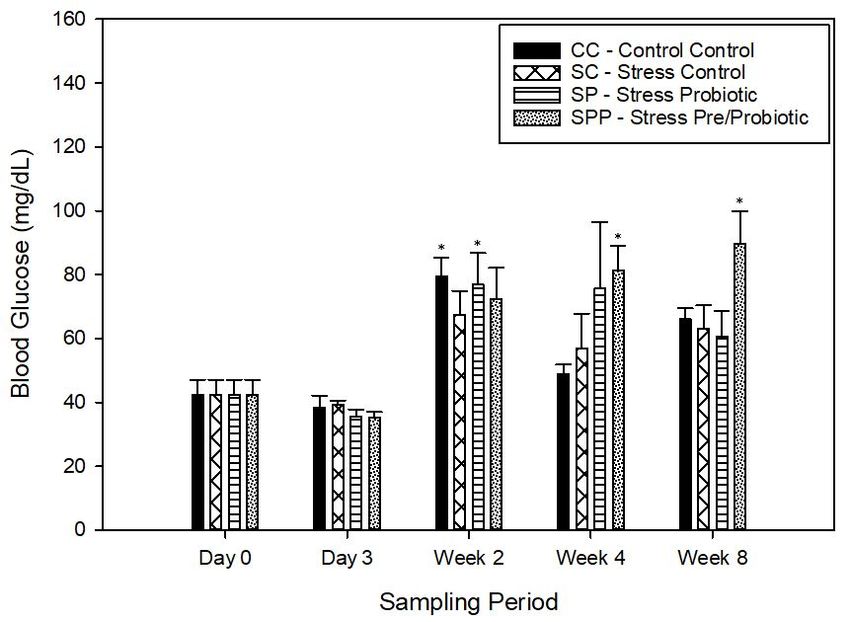
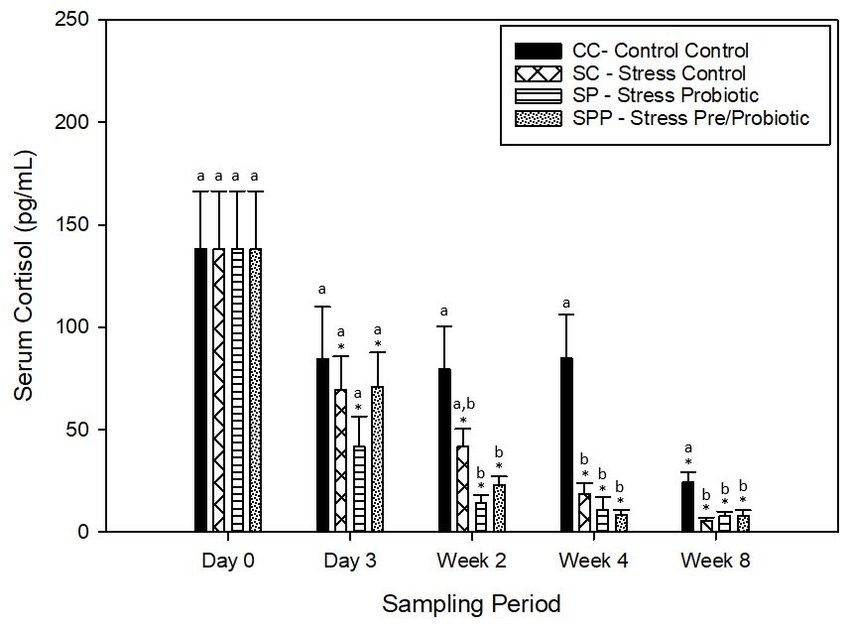
10

 LIST OF FIGURES

Figure 1. Recirculating aquaculture systems ................................................................................ 49
Figure 2. Diagram of tank numbering........................................................................................... 51
Figure 3. Serum cortisol (pg/mL) for all sampling periods .......................................................... 63
Figure 4. Blood glucose (mg/dL) for all sampling periods ........................................................... 64
Figure 5. Plasma protein (g/mL) for terminal sampling ............................................................... 65
Figure 6. Packed cell volume / hematocrit (%) for terminal sampling ......................................... 66
Figure 7. Hepato-somatic index (HSI) for terminal sampling ...................................................... 67
Figure 8. Spleen-somatic index (SSI) for terminal sampling ....................................................... 68
Figure 9. Lysozyme activity (abs.530nm/minute) for terminal sampling ........................................ 69
Figure 10. Feed conversion ratio (FCR) for terminal sampling.................................................... 70
Figure 11. Specific growth rate (% growth/day) for terminal sampling ....................................... 71
Figure 12. Protein efficiency ratio (PER) for terminal sampling.................................................. 72
Figure 13. Length gain (cm) for terminal sampling...................................................................... 73
Figure 14. Weight gain (g) for terminal sampling ........................................................................ 74
Figure 15. Condition factor (K) for terminal sampling................................................................. 75
11

 ABSTRACT

Author: Saillant, Kenneth, E. MS
Institution: Purdue University
Degree Received: May 2019
Title: Evaluation of Prebiotic and Probiotic as Functional Feed Additives on Physiological and
 Immunological Parameters of Nile Tilapia, Oreochromis niloticus
Committee Chair: Ahmed Mustafa

 Experiments were conducted to evaluate the ability of prebiotic and probiotic

supplementation of commercial fish feed to improve the physiological, immunological, and

growth responses of stressed Nile tilapia. To investigate these objectives, tilapia were divided in

two major groups: control fish (fed regular commercial feed) and stressed fish (induced by

dietary cortisol supplemented to regular commercial feed). Stressed fish were further divided

into three sub-groups: stressed fish fed regular feed, stressed fish fed probiotic-supplemented

feed, and stressed fish fed a mixture of prebiotic and probiotic supplemented feed. Fish were

maintained and tested over an eight-week long experimental period. A variety of physiological,

immunological, and growth parameters were measured over the course of the experimental

period. These parameters include: serum cortisol, blood glucose, plasma protein, packed cell

volume, hepato-somatic index (HSI), spleen-somatic index (SSI), lysozyme activity, feed

conversion ratio (FCR), specific growth rate (SGR), protein efficiency ratio (PER), length gain,

weight gain, length gain, and condition factor (K). The results of this study does not support the

use of these specific prebiotic and probiotic as functional feed additives in Nile tilapia at the

levels tested in this study. Further research is needed to determine which probiotic species are

best suited for use in Nile tilapia and which prebiotic, when used in combination, will allow

these probiotics to have maximum effect.
12

 INTRODUCTION

 The global population has been steadily increasing for some time, and it is projected to

continue to do so for the foreseeable future. As of 2017, the world population had reached 7.55

billion people (United Nations, 2017). The world population was approximately 5.8 billion in

1997, and it increased by approximately 1.75 billion people from 1997 to 2017 (United Nations,

2017). This represents an over 30% increase in world population in just 20 years. While overall

population growth rates have declined, world population growth is expected to continue through

2100. Based on current projections, the world population is expected to reach 8.551 billion by

2030, 9.772 billion by 2050, and 11.184 billion by 2100 (United Nations, 2017). However, these

projections are based on assumptions formed from current trends that may or may not prove true.

 One example of an assumption based on possible future trends is that the world

population growth rate will continue to decline. The world population growth rate was 1.24% in

1997, and as of 2017, this growth rate had declined to 1.10% (United Nations, 2017). The

assumption that the world growth rate will continue to slowly decline was made to produce these

projections. However, this may or may not be the case. Further assumptions about projected

decreases in fertility rates and increases to survival rates across all age groups were also made

(United Nations, 2017). When all of the various assumptions are taken into account, the upper

limit of the 95% confidence interval could see populations reach as high as 8.7 billion by 2030,

10.2 billion by 2050, and 13.2 billion by 2100 (United Nations, 2017). When these projections

are looked at as a whole, it is clear that the world population is continuing to grow, and the world

will likely see increases in population continue through 2100.
13

 With the rising world population, the state of the world’s food supply must be examined.

Currently, there are issues of hunger affecting populations worldwide. There are several defined

levels associated with hunger, and these levels are defined as the Food Insecurity Experience

Scale (FAO et al., 2018). The lowest level of food insecurity on this scale is defined as those

individuals who have food security or have only mild food insecurity. These people do not

normally have issues with obtaining food, and they typically are able to obtain a regular and

varied diet of quality food (FAO et al., 2018).These individuals did not have to worry about

skipping any meals throughout the last year.

 The next level of food insecurity is defined as those individuals who suffer from

moderate food insecurity. Individuals suffering from moderate food insecurity often don’t have

the resources or finances to obtain a quality and varied diet (FAO et al., 2018). These individuals

may have had to compromise on the quality or variety of foods that they consume, or they may

have had to reduce the amount of food that they consume (FAO et al., 2018). It is likely that

individuals suffering from moderate food insecurity have skipped meals or run out of food at

times throughout the last year, and they tend to have an overall uncertainty about where their

next meal will come from (FAO et al., 2018).

 The highest level of food insecurity is defined as those individuals who suffer from

severe food insecurity. Individuals suffering from severe food insecurity are the hardest hit, and

they often run out of food and have no idea where their next meal will come from (FAO et al.,

2018). These individuals have gone an entire day or more without food throughout the last year,

and these occurrences usually occur at more than one point in time throughout the year (FAO et

al., 2018). Like all individuals suffering from food insecurity, these individuals are especially

affected by malnutrition and hunger throughout their lives.
14

 With these definitions in mind, an overall survey of the current state of food insecurity

and hunger in the world shows a truly staggering problem faced by the human race. As of 2017,

approximately 10.2% of the world population is living with severe food insecurity, and this

number has increased from 8.9% in 2014 (FAO et al., 2018). This represents an increase of 1.3%

in just 3 years. At the current rate, there are an estimated 769.4 million people worldwide who

are dealing with severe food insecurity (FAO et al., 2018). When population projections are

taken into account, the number of people suffering from severe food insecurity in the future

could be overwhelming. If current rates are not reduced, the number of individuals dealing with

severe food insecurity could reach as high as approximately 887 million by 2030, 1.04 billion by

2050, and 1.35 billion by 2100 (FAO et al., 2018; United Nations, 2017). These numbers are

especially concerning when the effects of food insecurity and hunger are examined.

 With so many people dealing with food insecurity, the number of people affected by

malnutrition worldwide is not surprising. As of 2017, approximately 10.9% of the world

population is dealing with malnutrition (FAO et al., 2018). This represents approximately 821

million people, or almost one out of every nine individuals, worldwide (FAO et al., 2018). If the

data on undernourished individuals and population projections are looked at together, there could

be as many as 948 million people by 2030, 1.11 billion people by 2050, and 1.44 billion people

by 2100 dealing with malnutrition (FAO et al., 2018; United Nations, 2017). While these

numbers are of great concern, the overall rate of malnutrition does not tell the whole story.

 Food insecurity and malnutrition can affect different segments of the population in

different ways. The rates of food insecurity and malnutrition can vary widely. The rates of food

insecurity can range from as low as 1.4% in Europe and North America to as high as 48.5% in

parts of Africa in 2017, and the rates of malnutrition can range from as low as
15

and North America to as high as 31.4% in parts of Africa in 2017 (FAO et al., 2018). The

disparities in food insecurity and malnutrition do not end at differences between various regions

of the world. Certain segments of the population can be more greatly affected than others.

 About 32.8%, or approximately one out of every three, women of reproductive age

suffers from anemia due to food insecurity and malnutrition, and the effects on children are

equally concerning (FAO et al., 2018). Over 22%, or approximately 151 million, children under

the age of five were affected by stunting in 2017, and 7.5%, or approximately 50 million,

children under the age of five were affected by wasting (FAO et al., 2018). Stunting is defined as

being at least 2 standard deviations below the median height for their age based on 2006 WHO

Child Growth Standards, and wasting is defined as being at least 2 standard deviations below the

median weight for their height based on 2006 WHO Child Growth Standards (FAO et al., 2018).

Children that suffer from stunting and wasting are at increased risk of morbidity and mortality

(FAO et al., 2018). All of these effects could be increased by climate change, and increases as

high as 20% over current rates could occur by 2050 if nothing is done (World Food Programme,

2017). From the various effects of food insecurity and malnutrition shown here, it is clear that

something must be done to address this continued and potentially growing problem.

 Aquaculture presents a possible solution to the problems of food insecurity and

malnutrition. Aquaculture can be defined as, “all forms of culture of aquatic animals and plants

in fresh, brackish, and marine environments” (Pillay & Kutty, 2005). According to Lucas and

Southgate (2011), “The definition of aquaculture is understood to mean the farming of aquatic

organisms, including fish, molluscs, crustaceans and aquatic plants. Farming implies some form

of intervention in the rearing process to enhance production, such as regular stocking, feeding

and protection from predators” (Lucas & Southgate, 2011). Aquaculture has a long and extensive
16

history throughout the world, and its origins can be traced as far back as ancient Egypt and China

(Parker, 2005). Images depicting the raising of what are believed to be tilapia in ponds can be

found as early as 2500 B.C. (Pillay & Kutty, 2005).

 Aquaculture is also believed to have been practiced as early as 3500 B.C. in China

(Parker, 2005). The earliest known work written on the commercial aquaculture production,

Classic of Fish Culture, can be attributed to a Chinese politician named Fan Lei who lived

around 500 B.C. (Parker, Pillay & Kutty, 2005). In this work, Fan Lei attributed his wealth to the

growth and production of common carp (Cyprinus carpio) in ponds, and the production of

various carp species through aquaculture has continued in China to this day (Pillay & Kutty,

2005). In order to fully understand the current state of aquaculture worldwide, the different types

of aquaculture currently being utilized must be examined.

 The production of aquatic organisms can be classified into two main categories: capture

fisheries and aquaculture. Capture fisheries are still the most common production method, and as

the name suggests, they represent the traditional practices of capturing wild fish and aquatic

organisms from their natural environments (Pillay & Kutty, 2005). As of 2016, capture fisheries

worldwide produced approximately 90.9 million tonnes, and it accounted for about 53 percent of

total global production (FAO, 2018). Production levels for global fisheries production have

remained relatively stable since the 1980’s, but overall, global fisheries production has been

slowly decreasing worldwide (FAO, 2018).

 The decrease in production is related to increased regulation and management of natural

capture fisheries (FAO, 2018; Parker, 2005; Pillay & Kutty, 2005). The risks to natural fisheries

cannot be overstated. For example, the percentage of marine fisheries that were being sustainably

utilized worldwide decreased from 90.0% in 1974 to 66.9% in 2015 (FAO, 2018). From this
17

data, it is easy to see that natural fisheries and ecosystems are constantly and increasingly

threatened. Based on this fact, it is likely that the global trend in reduced capture fisheries

production will continue into the future. As restrictions on fisheries continue to increase and

overall production from capture fisheries is slowly declining, aquaculture has not suffered the

same fate and is thriving.

 Aquaculture represent the future of aquatic organism production, and they show the most

promise in meeting global food demands. While capture fisheries have been stable or declined

slightly since the 1980’s, the production from aquaculture has nearly doubled over the same time

period (FAO, 2018). As of 2016, aquaculture produced approximately 80.0 million tonnes, and it

represented 47% of global production (FAO, 2018). Aquaculture production saw annual growth

rates as high as 11.3% during the 1980’s, and while the growth rate of aquaculture production

has slowed slightly, it still averaged a 5.8% growth rate from 2000 to 2016 (FAO, 2018). If this

growth rate continues, global aquaculture production will likely surpass capture fisheries

production worldwide in the near future, and this production will occur without continuing to

threaten natural populations and ecosystems.

 In addition to having several advantages over capture fisheries, aquaculture has several

advantages over traditional terrestrial farming techniques and livestock production as well. The

growth rate of aquaculture production is higher than any other major food production method,

and this continued growth will be crucial to fighting food insecurity and malnutrition worldwide

and meeting the world’s ever increasing demand for food (FAO, 2018). In addition to having a

higher growth rate than other food production industries, the use of aquaculture to meet current

and future food demands is a better option than either traditional farming or livestock production

methods in terms of environmental impact as well. For example, if inland capture fisheries were
18

replaced by other food production methods, it would result in an increase of greenhouse

emissions, but the increase in emissions would be vastly different depending on what replaced

the inland capture fisheries (FAO. 2018). The increases in greenhouse emissions for aquaculture

of salmon, livestock production of beef, and traditional farming of rice would be 22.3 million

tonnes, 0.82 billion tonnes, and 9.3 billion tonnes, respectively (FAO, 2018). Based on these

numbers, increased livestock production would result in greenhouse emissions that are 36 times

higher than aquaculture of salmon, and traditional farming of rice would result in greenhouse

emissions that are over 417 times higher than aquaculture of salmon (FAO, 2018). With climate

change projected to increase food insecurity and malnutrition worldwide by as much as 20%

worldwide, aquaculture offers a better option to meet food demands with a lower associated

increase in greenhouse gases.

 Aquaculture is also a better option in terms of production. One good measure of the

production capacity of a species is the feed conversion ratio. The feed conversion ratio, in its

simplest form, is the ratio of feed given needed to produce a similar increase in body weight. For

example, a feed conversion ratio of 1.0 might refer to giving 1 kilogram of feed for 1 kilogram of

body weight gained or refer to giving 1 gram of feed for 1 gram of body weight gained. The

scale will depend on the species being examined. Aquatic species have an average feed

conversion ratio of about 1.5, but other species have higher feed conversion ratios (Fry et al.,

2018). Chickens have an average feed conversion ratio of approximately 2, pigs have an average

feed conversion ratio of approximately 4, and beef cattle have an average feed conversion ratio

of approximately 8 (Fry et al., 2018). This means that fish require about 25% less feed than

chickens, about 63% less feed than pigs, and about 81% less feed than beef cattle in order to
19

produce the same amount of meat (Fry et al., 2018). Based on this information, it would appear

that aquaculture represents the best option to meet current and future food demands.

 While aquaculture shows great promise and potential, there are unique problems faced by

aquaculture. One of the number one issues faced by aquaculture is the introduction of stress to

the fish being cultured. The idea of stress and how organisms respond to it was first proposed by

Hans Selye in 1950, and Selye defined stress as, “the sum of all the physiological responses by

which an animal tries to maintain or reestablish a normal metabolism in the face of a physical or

chemical force” (Selye, 1950; Wedemyer et al., 1990). Barton and Iwama (1991) stated that,

“stress represents a response reaction by fish to a stimulus and this response may somehow alter

the fish’s homeostatic state” (Barton & Iwama, 1991). Based on this definition, stressors can be

thought of as any stimulus that causes a disruption to the fish’s homeostasis. Stressors can also

be defined as a “force or challenge that elicits a compensatory physiological response”

(Wedemyer et al., 1990). Once a fish encounters a stressor, it initiates a stress response, or the

General Adaptation Syndrome, originally described by Selye (Selye, 1950; Wedemyer et al.,

1990).

 The stress response consists of three main stages. The first phase of the stress response is

the alarm stage (Barton & Iwama, 1991; Selye, 1950; Wedemyer et al., 1990). During the alarm

reaction, a stressor is felt by the fish, and it begins the stress response. The first thing to occur is

the activation of the hypothalamus-pituitary-interrenal (HPI) axis, and upon activation, the HPI

axis begins releasing catecholamines and corticosteroids (Barton & Iwama, 1991; Wedemyer et

al., 1990). These catecholamines and corticosteroids can be generally thought of as “stress

hormones” (Wedemyer et al., 1990). Once the stress hormones are released, it begins a cascade
20

of physiological changes in an attempt by the fish to maintain homeostasis (Barton & Iwama,

1991; Wedemyer et al., 1990). At this point, the fish enters the next stage of the stress response.

 The second stage of the stress response is the resistance stage (Barton & Iwama, 1991;

Wedemyer et al., 1990). During the resistance stage, the physiological changes begun during the

alarm stage allow the fish to adapt to and compensate for the stressors encountered, and by doing

so, the fish is able to maintain or return to homeostasis (Barton & Iwama, 1991; Wedemyer et

al., 1990). The changes required to adapt or compensate for the stressor may have costs, in terms

of energy and resources used, that could lead to reduced performance (Wedemyer et al., 1990). If

the fish is successfully able to adapt to the stressor or if the stressor is removed, then the stress

response would stop at this stage. However, if the fish is unable to adapt or the stressor persists,

the fish will enter the third and final stage of the stress response.

 The third and final stage of the stress response is the exhaustion stage (Barton & Iwama,

1991; Wedemyer et al., 1990). As the name suggests, the exhaustion stage occurs when the

stressor persists for an extended period of time or when the stressor is too severe for the fish to

be able to adapt to it (Barton & Iwama, 1991; Wedemyer et al., 1990). Upon entering the

exhaustion stage, the physiological changes that have occurred as a result of the fish trying to

adapt begin to be maladaptive, and at this point, negative physiological effects begin to occur

(Barton & Iwama, 1991; Wedemyer et al., 1990). Once a fish enters the third stage of the stress

response, it will no longer be able to effectively maintain homeostasis, and if the stressor

persists, negative effects will continue to increase and move the fish further from its homeostatic

state.

 The consequences and physiological changes that occur during the stress response in fish

can also be broken down to the different biological levels affected (Wedemyer et al., 1990).
21

These changes can be adaptive or maladaptive depending on how severe the stressor is, how long

the stressor persists, and what stage of the General Adaptation Syndrome model the fish is in

(Wedemyer et al., 1990). The first level of the biological response is called the primary response,

and it involves the changes that occur in the endocrine system of the fish (Wedemyer et al.,

1990). The primary response begins with the fish detecting the stressor, and this activates the

HPI axis (Wedemyer et al., 1990). Once the HPI axis is activated, the hypothalamus will release

corticotrophin releasing factor (CRF) which, in turn, activates the pituitary gland of the fish

(Wedemyer et al., 1990). Once the pituitary gland receives stimulation from CRF, it begins to

release the adrenocorticotrophic hormone (ACTH) into the blood stream, and ACTH travels

from the pituitary gland through the circulatory system to the head kidney, or anterior kidney

(Wedemyer et al., 1990). Once activated by ACTH, the interrenal cells begin to release cortisol

into the blood stream (Wedemyer et al., 1990). In addition to the release of cortisol, epinephrine,

also known as adrenaline, is released from the anterior portion of the kidney by the chromaffin

tissue, and this release occurs due to sympathetic nervous system stimulation (Wedemyer et al.,

1990). If the stressor persists or is too severe, the fish will not be able to adapt, and the primary

responses will lead to changes at the next biological level.

 The second biological level of the stress response is the secondary response. The

secondary responses are changes that begin to occur in the blood chemistry and tissues of fish,

and these secondary responses will continue to occur and intensify as long as the fish is under

stress (Barton & Iwama, 1991; Wedemyer et al., 1990). The changes that occur as part of the

secondary response begin with changes to blood chemistry, and these changes can include things

like increases in blood glucose levels and clotting factors (Wedemyer et al., 1990). The changes

to the blood chemistry will continue to increase and can result in changes like a reduction of
22

electrolytes in the blood, reduced numbers of circulating lymphocytes, and general

osmoregulation problems (Barton & Iwama, 1991; Wedemyer et al., 1990). Eventually, if the

fish is unable to adapt, tissue level changes will begin to occur, and the effects of the stress

response will become more pronounced (Wedemyer et al., 1990). Some examples of tissue level

changes that can occur are reduction in glycogen stores in the liver and lowered vitamin C levels

in the interrenal cells (Wedemyer et al., 1990). If the stressor continues to persist and the fish is

still unable to adapt, it will begin to lead to changes at the highest biological level.

 The highest biological level of the stress response is the tertiary response. Tertiary

responses occur on the organismal and population level, and they are the most dramatic and are

often maladaptive (Wedemyer et al., 1990). These tertiary response likely occur once the fish

reaches the exhaustion stage of the General Adaptation Syndrome and is no longer capable of

adapting to the stressor, but they can also occur during the resistance stage (Wedemyer et al.,

1990). There are many maladaptive changes that begin to occur once a fish reaches the tertiary

response level. At this level, overall reductions in growth begin to occur, and these changes can

lead to reduced fitness and reduced reproductive success for the fish (Wedemyer et al., 1990). In

addition to the reductions in growth and reproduction, the fish’s immune system also begins to

suffer, and the overall immune response of the fish is reduced (Wedemyer et al., 1990). Taken in

combination, the reductions to growth, fitness, and immune response can lead to increased

disease susceptibility (Wedemyer et al., 1990). Ultimately, if nothing is done, the fish will

eventually become diseased and die.

 Although stress in aquaculture settings can be reduced through proper husbandry

methods, it can never be completely eliminated, and eventually, the stress will lead to increased

disease susceptibility for the fish being raised. In order to combat disease in aquaculture, current
23

treatments involve the use of chemicals and antibiotics, and while use of these treatments has

been reduced and restricted in some areas, they continue to be commonly used in many parts of

the world (Assefa & Abunna, 2018; Rodgers & Furones, 2009). The use of various chemicals

and antibiotics represents a risk to consumers and to the environment. One major concern about

the use of chemical and antibiotic treatments is the ability for bioaccumulation of these

chemicals, antibiotics, and their residues to occur in fish (Rodgers & Furones, 2009).

Bioaccumulation is defined as, “The net accumulation of a contaminant in (and in some

occasional instances on) an organism from all sources including water, air, and solid phases of

the environment. Solid phases include food sources” (Newman, 2015). The risks to consumers

and the environment presented by bioaccumulation are not a trivial thing. However, there is

another major concern associated with the use of antibiotic treatments in aquaculture.

 The biggest concern about antibiotic use in aquaculture is the possible development of

antibiotic resistant bacterial strains (Rico et al., 2014; Santos & Ramos, 2018). Antibiotic

resistance occurs when bacteria are exposed to antibiotics at sub-therapeutic levels for extended

periods of time, and the bacteria are able to evolve antibiotic resistance genes or plasmids

(Santos & Ramos, 2018). These antibiotic resistant bacteria are then able to horizontally transfer

there resistant genes and plasmids to other bacteria (Santos & Ramos, 2018). Santos and Ramos

(2018) stated that, “It is now widely recognized that the passage of antimicrobial resistance

genes and resistant bacteria from aquatic to terrestrial animal husbandry and to the human

environment and vice versa can have detrimental effects on both human and animal health and

on aquatic ecosystems” (Santos & Ramos, 2018). Aquaculture has been found to be a key cause

of antibiotic contamination in areas where antibiotics are used (Rico et al., 2014). Based on this
24

information, a new and better method for dealing with stress and preventing disease in

aquaculture is required.

 One possible solution to the problems of bioaccumulation and antibiotic resistance that

aquaculture faces is the use of nutraceuticals. The term nutraceutical is a portmanteau of

nutrition and pharmaceutical, and nutraceuticals can be defined as, “substances that have

physiological benefits or provide protection against chronic diseases” (Hamid et al., 2014). There

are many different types of nutraceuticals such as phytochemicals and dietary supplements, and

one important category is functional food (Hamid et al., 2014). Functional foods can be defined

as, “any food or ingredient that has a positive impact on an individual’s health, physical

performance, or state of mind” (Hardy, 2000). There are many different types of functional

foods, and prebiotics and probiotics are two emerging types of feed additives that have shown

promise for use in aquaculture (Gatlin & Peredo, 2012). With this in mind, this research study

was developed.

 Prebiotics are an important functional feed additive that has been gaining interest in

aquaculture and beyond. Prebiotics are defined as a, “non-digestible food ingredient that

beneficially affects the host by selectively stimulating the growth and/or activity of one or a

limited number of bacteria in the colon, and thus improves host health” (Gibson et al., 2004).

The prebiotics are not digestible by the host, but they are capable of being broken down by the

gut microbiota (Gibson et al., 2004). In order for the prebiotic to be effective and to be classified

as a prebiotic, it must be able to resist being broken down or absorbed by the host, it must be able

to be broken down through fermentation by the gut microbiota, and it must be able to increase

the growth and activity of beneficial bacteria in the gut that are linked to overall host health

(Gibson et al., 2004).
25

 Probiotics are another important category of functional feed additives that are growing in

interest for use in aquaculture. Probiotics were originally defined by Fuller as, “A live microbial

feed supplement which beneficially affects the host animal by improving its intestinal microbial

balance” (Fuller, 1989). A more modern definition is, “Live microorganisms which when

administered in adequate amounts confer a health benefit on the host” (FAO & WHO, 2006).

Probiotics work by supporting and complementing the natural gut microbiota of the host, and

they can accomplish this through a variety of means (Kechagia et al., 2013). While the beneficial

effects of probiotic supplementation have been shown in previous research, the exact method that

probiotics are able to produce these beneficial effects is still poorly understood (Kechagia et al.,

2013). Probiotics can be administered on their own, but they are often combined with prebiotic

supplementation. The joint use of prebiotics and probiotics together has previously been referred

to as “conbiotics” or “symbiotics” by some researchers, but these terms have not been properly

defined and are not universally used (Kechagia et al., 2013). With the interest in prebiotic and

probiotic supplementation in aquaculture growing, this study was devised to examine their

potential.

 For this study, Nile tilapia (Oreochromis niloticus) were chosen as the species of interest

to evaluate the use of prebiotics and probiotics as functional feed additives. In order to

understand the decision to use Nile tilapia in this study, some background information on the

species, and its importance in aquaculture, are required. Aquaculture of Nile tilapia can be traced

as far back as 2500 B.C. in Egypt (Pillay & Kutty, 2005). Nile tilapia production began to

increase worldwide in the 1960’s, and the production of Nile tilapia continued to spread through

the 1980’s (Rakocy, 2005). Eventually, Nile tilapia were introduced for aquaculture production

in China in 1978, and since that time, China has consistently accounted for the vast majority of
26

Nile tilapia production worldwide (Rakocy, 2005). In fact, Chinese production has accounted for

more than half of the total global Nile tilapia production since 1992, and by 2003, Chinese

producers accounted for almost 806,000 tonnes of Nile tilapia produced (Rakocy, 2005). One of

the main reasons that Nile tilapia production has been so successful is due to the development in

the 1970’s of sex-reversal techniques that allow for all-male populations of Nile tilapia to be

produced (Rakocy, 2005). Advances in nutrition and cultivation methods have continued to drive

the expansion of Nile tilapia production worldwide since the 1980’s (Rakocy, 2005). The

continued growth of Nile tilapia production has led to it becoming one of the most widely and

highly produced species in aquaculture. Due to its importance as an aquaculture species, Nile

tilapia were chosen for this experiment.

 For this study, the prebiotic inulin was chosen. Inulin is a type of fructose polymer, and

they are similar to fructo-oligosaccharides (Hoseinifar et al., 2015). The main difference between

inulin compounds and fructo-oligosaccharides is the degree of polymerization that is seen in the

compounds (Hoseinifar et al., 2015). Compounds are considered to be inulin if the degree of

polymerization is greater than 10, and compounds are considered to be fructo-oligosaccharides if

the degree of polymerization is less than or equal to 10 (Niness, 1999). Inulin is most commonly

derived from chicory root, and chicory root contains between 15% and 20% inulin (Niness,

1999). Inulin has been shown in previous research in fish to have a beneficial effect on the

immune response when it is supplemented on its own (Bakke-McKellep et al., 2007; Cerezuela

et al., 2012; Cerezuela et al., 2013a; Cerezuela et al., 2013b; Ibrahem et al., 2010; Mourino et al.,

2012; Reyes-Becerril et al., 2014). The results of the previous research studies can be seen in

Table 1. As a prebiotic, inulin should also be able to assist in the colonization of the probiotic
27

being tested and increase the beneficial effects associated with probiotic supplementation. For

these reasons, inulin was chosen as the prebiotic of interest for this study.

 For this study, a probiotic powder that contained a combination of probiotic species was

also chosen. In total, the probiotic powder contained four species of lactic acid bacteria. The

probiotic powder used contained the following species: Enterococcus faecium, Lactobacillus

acidophilus, Lactobacillus casei, and Lactobacillus plantarum. The probiotic powder was chosen

because each of the probiotic species have been shown to cause positive effects in Nile tilapia

and other fish species when supplemented individually (Al-Dohail et al., 2009; Aly et al., 2008;

Bogut et al., 2000; Goncalves et al., 2011; Hamdan et al., 2016; Hernandez et al., 2010; Wang et

al., 2008). The results of the previous research studies can be seen in Table 2. This study was

focused on seeing if the supplementation of a combination of probiotic species could produce

improved results over supplementation of the individual probiotic species on their own. For these

reasons, this probiotic powder was chosen.

 There were three main research objectives for the present study. The first research

objective was to evaluate the ability of prebiotic and probiotic supplementation to improve the

physiological responses of stressed Nile tilapia. The second research objective was to evaluate

the ability of prebiotic and probiotic supplementation to improve the immune response of

stressed Nile tilapia. The third research objective was to determine if the combination of

prebiotic and probiotic supplementation was more effective than probiotic supplementation on its

own in improving the physiological and immune responses of Nile tilapia. There were two

hypotheses for this study as well. The first hypothesis was that both the probiotic supplemented

group and the prebiotic and probiotic supplemented group would have improved physiological

and immune responses in stressed Nile tilapia compared to the stressed and non-supplemented
28

Nile tilapia. The second hypothesis was that the combination of prebiotic and probiotic

supplementation would be more effective at improving the physiological and immune responses

of stressed Nile tilapia than probiotic supplementation on its own.
29

Table 1. Previous research on inulin. This table shows examples of previous research on the
prebiotic, inulin, which was used in this experiment, and the results found from testing in Nile
tilapia and other fish species.

 Dosage Length of Fish
 Results References
 (g/kg) Supplementation Species
 Atlantic Increased leukocyte Bakke-McKellup
 75 3 weeks
 salmon infiltration et al., 2007
 Increased
 Gilthead sea Cerezuela et al.,
 10 4 weeks intraepithelial
 bream 2013a
 leucocytes
 Gilthead sea Increased IL-8 Cerezuela et al.,
 10 4 weeks
 bream production 2013b
 Increased complement
 Gilthead sea Cerezuela et al.,
 10 2 weeks activity
 bream 2012
 Increased IgM levels
 Increase lysozyme Ibrahem et al.,
 5 8 weeks Nile tilapia
 activity 2010
 Hybrid Increased total Mourina et al.,
 5 15 days
 surubim immunoglobulin 2012
 Increased lysozyme
 activity
 Leopard Increased IgM levels Reyes-Becerril et
 10 8 weeks
 grouper Increased al., 2014
 myeloperoxidase
 activity
30

Table 2. Previous research on probiotic species. This table shows examples of previous research
on the probiotic species used in this experiment, and the results found from testing in Nile tilapia
and other fish species.

 Probiotic Species Fish Species Effects of Treatment References
 Enterococcus faecium Nile tilapia Increased weight gain Wang et al., 2008
 Reduced harmful
 Sheatfish Bogut et al., 2000
 bacteria
 Increased survival rate
 Lactobacillus acidophilus Nile tilapia Aly et al., 2008
 Increased growth
 Al-Dohail et al.,
 African catfish Increased growth
 2009
 Lactobacillus casei / Increased growth Goncalves et al.,
 Nile tilapia
 Lactobacillus rhamnosus performance 2011
 Increased body weight
 Porthole Hernandez et al.,
 Increased specific
 livebearer 2010
 growth rate
 Increased growth rates
 Hamdan et al.,
 Lactobacillus plantarum Nile tilapia Increased feed
 2016
 efficiency
31

 MATERIALS AND METHODS

 Acquisition of Materials

Fish Acquisition

 200 Nile tilapia fingerlings were purchased from Troyer Fish Farms located in Geneva,

Indiana. These fingerlings were distributed evenly among two identical systems containing two

identical tanks per system. Each tank holds 200 gallons, and 50 fingerlings were placed in each

tank. The fingerlings obtained from Troyer Fish Farms are hybrid all male Nile tilapia originally

produced by AmeriCulture, Inc. located in Animas, New Mexico. The fingerlings had an average

length of approximately 7 cm and an average weight of approximately 25 g when they were

received. The fish were starved for two days upon receiving them in order to allow the handling

and transport stress to dissipate, and they were maintained in the systems for a two week

acclimation phase to allow them to fully adjust to the new environment before experimental

conditions were applied. All of the fish were taken care of following the approved animal care

protocol.

Prebiotic and Probiotic Acquisition

Prebiotic

 The inulin prebiotic powder used for this research was obtained from Micro Ingredients

located in Diamond Bar, California. A 1 kilogram package of powder was obtained for this

experiment, and the powder is USDA Certified Organic. It is free of any added sugar, soy, dairy,

yeast, gluten, corn, or other additives. The powder was stored in its original packaging in a cool

and dry cabinet and was used before the expiration date.
32

Probiotic

 The probiotic powder used in this experiment was obtained from the Tractor Supply Co.

store located in Fort Wayne, Indiana. The probiotic powder used for this research is called

Probios® Dispersible Powder manufactured by Vets Plus, Inc. located in Menomonie,

Wisconsin. This product is created under license from Chr. Hansen, Inc. located in Hoersholm,

Denmark. This product was purchased because it was lab certified to contain the four probiotic

strains of interest for this research: Enterococcus faecium, Lactobacillus acidophilus,

Lactobacillus casei, and Lactobacillus plantarum. The powder was also certified to contain no

less than 10 million colony forming units (CFUs) per gram of powder by the manufacturer. The

powder was stored in its original packaging in a cool and dry cabinet and was used before the

expiration date.

Maintenance of Fish

System Setup

 Two identical university owned systems housed in room 142 in the Life Sciences

Resource Center of Purdue University Fort Wayne in Fort Wayne, Indiana were used for this

research. Each system consists of two identical round 200 gallon tanks that drain through a

center stand pipe into a 400 gallon rectangular sump tank. (Figure 1) The sump tank contained

approximately 1.5 cu. ft. of 1/2 inch lava rock obtained from Lowe’s Home Improvement located

in Fort Wayne, Indiana. The lava rock was used to maximize space for denitrifying bacteria to

colonize in order to ensure complete and rapid denitrification of the water. The water was

pumped from the sump tank and filtered using a sand filter to remove any particulate waste and

to allow for further denitrification of the water.
33

 After passing through the sand filter, water was pumped back into the two tanks housing

the fish, and the water was vented into the tanks in such a way as to create a slow, circular flow

around the tank. This flow helped to ensure that the water in the tanks housing the fish was

thoroughly mixed and that water quality was even throughout the entire tank. Each tank was

individually aerated by an aeration bar powered by a central air pump. The aeration, along with

the other design features of the system, ensured that adequate oxygen levels were maintained for

the fish and for proper denitrification of nitrogenous wastes in the system.

 The water used in the system was obtained from a municipal water source. First, it was

dechlorinated by passing through separate filter chambers filled with activated carbon, and

second, by using Prime® dechlorinator produced by Seachem Laboratories located in Madison,

Georgia at the recommended dosage of 5 mL per 50 gallons. These steps were taken to ensure no

chlorine or chloramines entered the system circulation.

Room and Water Quality

Room Temperature and Humidity

 The room where the systems were housed ranged between 25°C and 30°C throughout the

acclimation phase and sampling period. The humidity in the room ranged from 24% to 59%

throughout the acclimation phase and sampling period. The room temperature was maintained by

the central ventilation system, and the humidity was not separately controlled. The room

temperature and humidity were measured using a combination digital thermometer and

hygrometer placed in the room at all times. The combination thermometer and hygrometer also

measured the highest and lowest values for temperature and humidity, and these values were

reset after being recorded each day. This ensured that the temperature and humidity were within
You can also read