Expanding Public Transit in Columbia, Missouri A Health Impact Assessment - prepared by the HIA Partner Team
←
→
Page content transcription
If your browser does not render page correctly, please read the page content below
Expanding Public Transit in Columbia, Missouri
                  A Health Impact Assessment

            prepared by the HIA Partner Team
Transit Expansion HIA   1

Funding for this project provided by

                                            December 2012
Transit Expansion HIA 2
Executive Summary
Background
Policies and programs from domains such as transportation, planning, and education influence
health and well-being. Health Impact Assessment (HIA) is an evidence-based research tool used to
inform decision-makers about the potential health risks and benefits of policies, programs, and
projects outside the health sector. HIA first identifies potential health effects and their likely
distribution within the population. HIA then makes recommendations for how a proposed program
or policy might be altered to increase positive and decrease negative health outcomes.
Increased student ridership, budget cuts, and rising fuel costs have stressed the current Columbia
Transit system. In response to these challenges, several potential mechanisms have been proposed
to increase funding and allow for expansion of bus services in Columbia. In light of these policy
discussions, the Columbia/Boone County Department of Public Health and Human Services
partnered with the PedNet Coalition and Central Missouri Community Action in late 2011 to
perform an HIA on the health effects of expanding and improving bus service in Columbia.
Funding was provided by grants from the Robert Wood Johnson Foundation and the Missouri
Foundation for Health. The study introduces consideration of health effects and their distribution
within the population to the ongoing conversation on the benefits of public transit to our
community.
December 2012Transit Expansion HIA 3
Project Goals
The core goals of the HIA project were to:
Assess potential health effects of expanding public transit in Columbia.
Determine likelihood of these health effects, given the best possible evidence.
Provide recommendations for how transit expansion could maximize positive and
minimize negative health outcomes.
Increase awareness among decision-makers and within the community about how
different policies and programs influence health.
Promote the use of HIA as a decision-making tool among policymakers and other
stakeholders.
Project Methods
The specific research question addressed by this HIA is: “How will expansion of Columbia Transit
services impact community health?” The HIA Partner Team met in Spring 2012 to define the scope of the
project and identify four indicators found to influence health that were also determined most likely
to be affected by expansion of public transit. These four health indicators are:
Physical activity
Exposure to the outdoors
Access to health care, employment, education, and healthy food options
Creation of a livable and sustainable community
The assessment used a variety of data sources. We performed literature reviews, held meetings
with community members and stakeholders, and gathered our own data to determine how these
health indicators might be altered by expanding public transit. Health data sources also consulted
were the Behavioral Risk Factor Surveillance System and County Health Rankings. We gathered our
own data through community meetings held by PedNet, titled Community Conversations about
Transit. These meetings took place in four of six city wards during the Spring of 2012. We also
partnered with Central Missouri Community Action to conduct a community-based survey about
December 2012Transit Expansion HIA 4
transportation difficulties and access to health care and employment among low-income central city
residents, bus users, and clients of local health and social service agencies.
Key Stakeholders
We collaborated with the following government and community stakeholders during the preparation
of this report.
City of Columbia
o Office of the City Manager and Deputy City Manager
o Department of Public Health and Human Services
o Office of Sustainability
o Columbia Transit
o Department of Community Development
Boone County Commission
Columbia Public Schools
Key Findings and Recommendations
Review of the literature found solid evidence to suggest that those who use public transit
accrue more physical activity throughout the day, by walking or biking to and from bus
stops. Therefore, expanding bus services while concurrently improving infrastructure
that allows for active transportation has potential positive impacts for local health.
Other positive health impacts from expanding transit include improving access to health
care; improving access to employment, which could improve access to health care
benefits and also reduce stress.
Improving access to healthy foods, particularly in areas designated as food deserts.
Expanding transit could also increase community cohesion and social capital by
providing more opportunities for social interaction. Better social capital, defined as the
resources accrued through social interaction, is linked with improved health.
Although analysis is limited to the four health indicators identified in the Project Methods
section, we found no evidence to suggest that expanding bus services in Columbia would negatively
impact community health.
December 2012Transit Expansion HIA 5
In addition, it is important to note that the potential health effects of transit expansion
fundamentally depend on:
The degree to which bus services are expanded
The impact on bus ridership due to transit expansion
In other words, it is impossible to quantify the health effects of transit expansion without first
knowing the amount of funding available for transit expansion and how that funding will be
dispersed to improve transit services. Therefore, the findings and recommendations from our HIA
focus on how transit might best be altered or expanded to maximize impacts on community health
and increase ridership, which would consequently impact health through increased physical activity,
improved access to the outdoors, or accrual of social capital.
In addition, primary survey data and key informant interviews found that most bus riders lack
alternate transportation options, such as a reliable car. Any expansion or alteration of transit services
should therefore carefully consider impacts on the population currently dependent on the bus for
access to education, health care, employment, or retail.
December 2012Transit Expansion HIA 6
Table 1 presents the key HIA findings and provides recommendations to maximize benefits to
community health. Table 2 is the Evidence Quality Legend. Table 3 assesses the quality of the
evidence and the likelihood of the identified health impacts.
Table 1: Key HIA Findings and Recommendations
1. Physical Activity
Expanding bus services in Columbia could increase physical activity levels
among those who ride the bus.
Findings Recommendations
Transit riders often walk for greater periods 1 Review current bus routes to include more
of time than do car drivers, nearly attaining opportunities for ridership in densely
daily recommendations for physical activity. populated areas of Columbia.
Residents of transit-oriented developments 2 Promote collaboration between Columbia
consistently have higher levels of active Transit and the Health Department on
transportation use and physical activity. production of social marketing materials
Complete streets ordinances can potentially describing the physical activity benefits of
complement public transportation systems, bus use, and disseminate materials through
allowing for more opportunities for physical local media and on buses.
activity as well as expanded range of travel 3 Ensure there are bike racks at major
for users. Columbia Transit hubs.
December 2012Transit Expansion HIA 7
Table 1 Cont.
2. Exposure to the Outdoors
Expanding bus services in Columbia could increase exposure to outdoor recreational areas,
such as parks and trails, among those who ride the bus.
Findings Recommendations
Living in close proximity of parks and 1 When new bus routes are designed, access
recreational areas is associated with greater from neighborhoods to parks should be
usage, increased opportunities for physical maximized, while considering other goals of
activity, and decreased stress. Park users are transit system design.
more likely to meet physical activity 2 Post bus routes and timetables at parks
recommendations. A Columbia Parks & already serviced by existing bus routes.
Recreation survey found that 99% of those
surveyed visited at least one city park in the
past year and indicated primary use of these
areas for adult and youth sports. However,
only 24% respondents indicated that park
facilities were close enough to their
residence, while 29% indicated there were
no parks within walking distance from their
residence.
December 2012Transit Expansion HIA 8
Table 1 Cont.
3. Access to health care, employment, education,
and healthy food options
Expanding bus services in Columbia could increase access to health care facilities,
employment, education, and retail outlets that provide healthy food options.
Findings Recommendations
Public transportation is considered one of 1 When new bus routes are designed, access
the most important social determinants of from neighborhoods to health care facilities,
health. Results of local surveys found that including hospitals and clinics, should be
the strongest predictor of missing health maximized, while considering other goals of
care appointments was a transportation transit system design.
problem, followed by the frequency of
current bus service.
Availability of transportation can put limits 1 Create a “Transit Access To Employment”
on where residents search for employment. group consisting of representatives from the
Results of local surveys found that those business community and populations using
who currently use the bus, they often Columbia Transit to address barriers to
searched for employment opportunities that accessing employment.
were in proximity to current bus routes. 2 Appoint a member to the Public
Respondents who did not own a car Transportation Advisory Commission who
reported missing work more frequently than is a representative of the business
those with cars. community.
Lack of transportation can be a barrier to 1 Assess the need for transportation among
accessing education. In Columbia, limited potential students of GED or job training
evening hours make it difficult or classes and determine areas of Columbia
impossible for transportation disadvantaged where clusters of these students reside.
students to take the bus to locations, such 2 Coordinate bus routes and add evening
as the Career Center, that provide job hours to locations that provide GED classes
training and GED classes. In interviews, or job training, and that enroll a large
local Head Start administrators also percentage of students who lack
identified transportation as a major barrier transportation.
to consistent attendance, a requirement for
Head Start students.
December 2012Transit Expansion HIA 9
Findings Recommendations
Consumers, especially those who are low- 1 Continue the farmer’s market bus route
income, experience transportation barriers and collaborate with the health department
to accessing healthy food options. Recent to promote the route to residents within
food asset mapping of Columbia found that areas classified as food deserts.
many low-income residents use public 2 When new routes are designed, maximize
transportation to travel to stores that access from neighborhoods to stores that
provide healthy food options, especially if provide healthy food options, while
the store was greater than one mile from considering other goals of transit system
their location. design.
Lack of safe, reliable transportation is one 1 Coordinate with Columbia Public Schools
of the most significant barriers to to provide transportation to students
participation in after-school programs. participating in after-school activities,
Participation in after-school programs is particularly secondary school students.
linked with improved educational
outcomes.
December 2012Transit Expansion HIA 10
Table 1 Cont.
4. Creation of a livable and sustainable community
Expanding bus services in Columbia could promote walkable communities or transit-oriented
development and increase opportunities for social interaction and accrual of social capital.
Findings Recommendations
The design and layout of the built 1 Audit current bus stops to determine if they
environment can influence crime via are near undesirable locations.
allowing access for perpetrators, ease of
entry and exit, and surveillability. Variables
associated with higher crime rates include
bus stops at undesirable locations (such as
liquor stores), vacant buildings, and the level
of litter. Variables associated with lower
crime rates around bus stops include large
commercial buildings, areas with high
visibility, bus shelters, and the presence of
street traffic and pedestrians.
Bus stop characteristics such as layout, 1 Create an “adopt-a-bus stop” program with
visibility, and lighting can influence the volunteers to address conditions
perception of safety. In Columbia, more surrounding identified stops, such as lack of
than a quarter of those surveyed also shelter from the elements, litter, and other
identified “safer buses” as a preferred aesthetic considerations.
improvement. Perception of safety was also 2 Solicit feedback about perceived safety from
a barrier to bus ridership among transit user focus groups and incorporate
participants at the Community into training for bus drivers, such as
Conversations about Transit. strategies on addressing noisy or disruptive
youth.
December 2012Transit Expansion HIA 11
Residents of mixed used developments 1 Partner with the Department of Community
report higher levels of social capital due to Development to review zoning procedures
their design, which encourages walking and that would promote transit-oriented
active transportation. Identified health developments along transit corridors.
benefits of social capital include prolonged 2 Create a taskforce to research possible
life, better overall health, and improved regulations to promote active transportation
mental health. in central Columbia, including one-way
streets, streets blocked to vehicles, or park-
and-ride locations on the outskirts of the
District.
December 2012Transit Expansion HIA 12
Table 2: Evidence Quality Legend
Expected Change No change – The literature achieves consensus that this
Based on Literature indicator will likely remain unchanged.
Mixed – The literature lacks consensus about this indicator’s
potential impact.
Increase – The literature achieves consensus that this indicator
will likely increase.
Decrease – The literature achieves consensus that this indicator
will likely decrease
N/A – There is no available literature on this indicator.
Stakeholder Projections No change – Stakeholders did not anticipate any changes.
Mixed – Stakeholders were divided in their opinions.
Increase – Stakeholders anticipated an increase.
Decrease – Stakeholders anticipated a decrease.
N/A – Stakeholders did not express their opinions.
Expected Health Impact Positive – Changes that may improve health.
Negative – Changes that may impair health.
Mixed – Changes may be both positive as well as negative.
Uncertain – Unknown how health will be impacted.
No effect – No identified impact on health.
Magnitude of Impact Low – Affects very few people.
Medium – Affects large numbers of people.
High – Affects many people.
Likelihood of Impact Likely – Likely that impacts will occur as the result of the
proposal.
Possible – Possible that impacts will occur as the result of the
proposal.
Unlikely – Unlikely that impacts will occur as the result of the
proposal.
Uncertain – Uncertain that impacts will occur as the result of
the proposal.
Distribution Within the The population most likely to be affected by the changes in
Population health factors or outcomes.
Quality of Evidence **** More than five strong studies.
*** Five or more moderate studies.
** Five weak studies.
* Fewer than five studies.
December 2012Transit Expansion HIA 13
Table 3: Evidence Quality
December 2012Transit Expansion HIA 14
Table 3 Cont.
December 2012Transit Expansion HIA 15
Table 3 Cont.
December 2012Transit Expansion HIA 16
Table of Contents
Acknowledgements……………………………………………………………..page 17
Introduction……………………………………………………….......................page 20
Profile of Columbia…………………………………………………………….page 24
Transit Expansion HIA………………………………………………………...page 28
Review of Evidence…………………………………………………………….page 36
Next Steps……………………………………………………………………....page 59
Conclusion……………………………………………………………………...page 61
References……………………………………………………………………...page 62
Appendix 1: Community Survey………………………………………………..page 69
December 2012Transit Expansion HIA 17
Acknowledgments
This project was supported by grants from the Robert Wood Johnson Foundation and the Missouri
Foundation for Health.
The HIA Partner team members:
Central Missouri Community Action
o Darin Preis, MPA, CCAP, Executive Director
o Angela Hirsch, CCAP, Community Services Director
o Sarah Klaassen, Community Organizer, Boone County
The PedNet Coalition
o Ian Thomas, PhD, Executive Director
o Michelle Windmoeller, Assistant Director
o Sam Robinson, Healthy Communities Initiatives Program Coordinator
o Melissa Birdsong, Director of Administration and Finance
Columbia/Boone County Department of Public Health and Human Services
o Stacia Reilly, MEd, Community Health Promotion Supervisor
o Jason Wilcox, Health Impact Assessment Coordinator
o Rachel Young, Health Impact Assessment Communications Coordinator
During the course of the HIA, the HIA Partner Team held conversations with city and county
staff members as well as community stakeholders. We would like to thank them for taking the time
to meet with us and share their expertise.
Drew Brooks, Columbia Transit Administrator
December 2012Transit Expansion HIA 18
Stephanie Browning, Director, Columbia/Boone County Department of Public Health
and Human Services
Barbara Buffaloe, City of Columbia Sustainability Manager
Tondelaya Carter, Central Missouri Community Action volunteer
Christa Holtzclaw, Columbia Transit Marketing Specialist
Barbara Hoppe, City of Columbia Ward 6 City Council Representative
Nicole Johnson, Central Missouri Community Action, Worley Street Head Start Team
Leader
Earline Krushall, Central Missouri Community Action volunteer
Sharon Lee, Nurse Practitioner, Columbia/Boone County Department of Public Health
and Human Services
Mike Matthes, City of Columbia City Manager
Karen Miller, Boone County Commission District 1 Commissioner
Tiffany Munzo, Central Missouri Community Action volunteer
Natilee Novak, Central Missouri Community Action, Park Avenue Head Start Team
Leader
Tony St. Romaine, City of Columbia Deputy City Manager
Sonja A. Wilhelm Stanis, PhD, University of Missouri, Assistant Professor, Department
of Parks, Recreation, and Tourism
Peter Stiepleman, Columbia Public Schools Assistant Superintendent for Elementary
Education
Phil Stroessner, Refugee and Immigration Services, Case Worker and Job Developer
Tim Teddy, City of Columbia Community Development Director
December 2012Transit Expansion HIA 19
Michael Trapp, City of Columbia Ward 2 City Council Representative
Kristina Weston, Central Missouri Community Action, Field Head Start Team Leader
Verena Wilkerson, Central Missouri Community Action, Bear Creek Head Start Team
Leader
We would also like to thank the following individuals for providing technical assistance and
guidance throughout the project.
Holly Avey, PhD, MPH, Georgia Health Policy Center
Jennifer Boyce, MPH, Wisconsin Department of Health Services
Michelle Marcus Rushing, MPH, Georgia Health Policy Center
Candace Rutt, PhD, Centers for Disease Control and Prevention
Dan Schneiderjohn, Columbia/Boone County Department of Public Health and
Human Services
December 2012Transit Expansion HIA 20
Introduction
Health Impact Assessment, or HIA, is a “systematic process that uses an array of data sources
and analytic methods and considers input from stakeholders to determine the potential effects of a
proposed policy, plan, program, or project on the health of a population and the distribution of the
effects within the population. HIA provides recommendations on monitoring and managing those
effects” (National Research Council, 2011). Simply put, HIA is an evidence-based research tool used
to inform decision-makers about the unintended health effects of a potential decision before it is
made. An HIA also includes recommendations to ensure that the planned policies, programs, and
projects being studied maximize health benefits and minimize negative health impacts. It is
important to note that HIA is not an advocacy tool. It is to be used strictly to inform the decision-
making process so that the final policy or program maximizes health outcomes and minimizes
adverse effects. An HIA is also based on the best available evidence, both quantitative, such as
surveys, and qualitative, such as in-depth interviews with stakeholders.
An HIA can be performed in a number of ways to accommodate available resources and the
time frame for the decision. A rapid HIA can be performed in a few weeks or a month. Generally, a
rapid HIA is conducted for a less complex decision, and the evidence gathered may be only a few
literature reviews and expert opinions. Intermediate and comprehensive HIAs focus on more
complex policies and decisions. Therefore, more time is required to perform literature reviews,
gather expert and stakeholder opinions, collect new primary data, and inform decision-makers. Our
HIA could be considered intermediate, as we had a greater length of time to perform the previously
mentioned activities, but we were not able to collect primary data for every health pathway.
The World Health Organization defines health as “a state of complete physical, mental, and
social well-being, and not merely the absence of disease.” Policies made outside of the health sector
December 2012Transit Expansion HIA 21
have traditionally not considered potential impacts on health. Health Impact Assessment has been
identified by a number of international and domestic organizations as a tool for public health
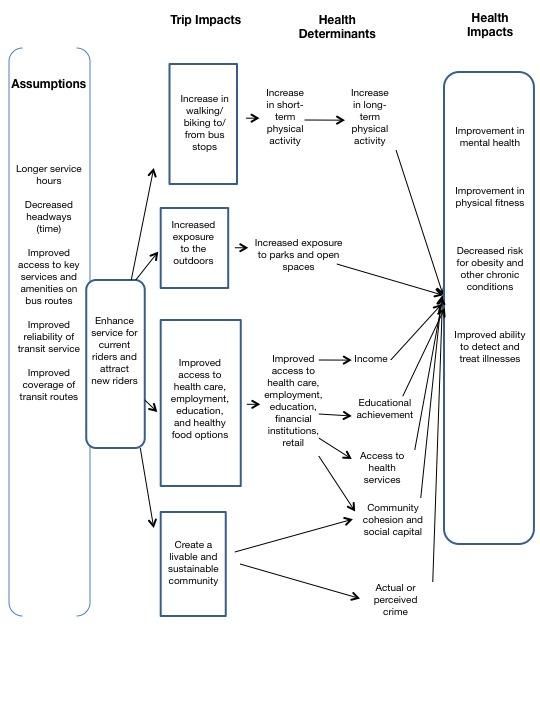
professionals and policy makers to address the “social determinants of health” (Figure 1). Poverty,
education, policy and regulation, neighborhood context, and other social and environmental factors
that influence health outcomes are grouped under the term social determinants of health (Berkman
& Kawachi, 2000). These different environments affect our overall quality of life and can protect
populations or put them at risk for certain types of diseases. For example, living in a neighborhood
with poor access to healthy food options increases residents’ risk for type II diabetes.
Figure 1: County Health Rankings Social Determinants
Of Health Model
A goal of HIA is to highlight the
social determinants of health and the
health disparities they contribute to
within populations.
Steps of an HIA
A health impact assessment is
typically performed in six steps.
These steps include screening,
scoping, assessment,
recommendations, reporting, and
monitoring and evaluation.
December 2012Transit Expansion HIA 22
Screening
Screening assesses the value, feasibility, and utility of performing an HIA. If the plan or policy is
too vague or not fully developed, or the potential health impacts are already known, an HIA will add
little value to the decision. Staff, potential collaborative partners, available resources, and time must
also be considered during screening. Given the number of state or local policies, plans, and projects
under consideration, an HIA simply cannot be performed on each one. One of the most important
questions to ask during the screening phase is: What specific program, plan, or policy decision will
the HIA address? As with every step in the HIA, the screening process should be documented.
Scoping
Scoping creates the formal plan and timeline for conducting the HIA. There are many important
tasks that need to be performed at this stage. Essential tasks include establishing roles for members
of the HIA partner team, establishing goals for the HIA, identifying vulnerable populations,
identifying geographic boundaries, formulating research questions, and identifying the potential
health impacts of the decision to be evaluated. In addition, creating a causal model or pathway
diagram of possible decision scenarios and how it impacts health will help to aid the research
question.
Assessment
Assessment is performed in two steps. The first step involves gathering data to describe the
baseline conditions of the groups involved in the decision. Examples of baseline data sources
include the U. S. Census, the Behavioral Risk Factor Surveillance Survey (BRFSS), and additional
national or local surveys of health status and outcomes. The next step of the assessment stage is to
gather, weigh, and evaluate data relevant to the decision being studied. Analytic resources used at
this stage include peer-reviewed literature, government reports, interviews or focus groups, and new
data collected expressly to address the research questions posed in the HIA. Assessment should be
December 2012Transit Expansion HIA 23
impartial and should involve weighing both the positive and negative health impacts of the decision.
The potential health effects are then characterized as to their likelihood, severity, magnitude, and
distribution within the population based on empirical evidence, the baseline assessment, and other
forecasting tools. Once the health effects are weighed, the confidence level or certainty that each
health effect will occur if the policy is adopted is judged based on the supporting evidence.
Recommendations
Recommendations identify the ways the decision or decision alternatives should protect and
promote health. The recommendations should be practical, feasible, and inform decision-makers of
the risks, benefits, and potential costs of the decision and its alternatives. The HIA team may need
to bring in outside expertise from individuals or groups related to the project to create realistic
recommendations.
Dissemination
A comprehensive HIA report should be transparent and include all of the participants, their
roles, and the previously discussed steps. The report should be written in a suitable language for
target audiences such as community members, stakeholders, and elected officials. The findings of
the HIA should be disseminated to decision-makers, stakeholders, and affected communities.
Monitoring and Evaluation
Health Impact Assessments can be evaluated in three ways. The first is a process evaluation.
This evaluation can provide details such as how the HIA was performed, what data sources were
used, how recommendations were formulated, and how did the decision-makers use the
recommendations. The second form of evaluation is impact evaluation. This assesses the impact
made by the HIA on the decision-making process. Finally, outcome evaluation assesses and
monitors the impact of the decision on the health status of identified populations.
December 2012Transit Expansion HIA 24
Profile of Columbia
Columbia is the largest city in both Boone County and mid-Missouri, and it serves as the county
seat. With a population of 108,500, it is the fifth-largest city in Missouri. Its population is a majority
of the population of Boone County’s population, which is 162,642.
Table 4: City, County, and State Demographic Characteristics
Columbia Boone County Missouri
Population, 2011 estimate 110,438 165,627 6,010,688
Population, % change,
April 1, 2010 to July 1, 2011 1.8% 1.8% 0.4%
Population, 2010 108,500 162,642 5,988,927
Age, % of population
Under 5 years 6.0% 6.1% 6.4%
Under 18 years 18.8% 20.7% 23.5%
Under 65 years 8.5% 9.4% 14.2%
Female persons, % of population 51.7% 51.5% 51.0%
Race, % of population
White 79.0% 83.6% 84.0%
Black or African American 11.3% 9.4% 11.7%
American Indian/Alaska
native 0.3% 0.5% 0.5%
Asian origin 5.2% 3.9% 1.7%
Native Hawaiian/other Pacific
Islander 0.1% 0.1% 0.1%
Two or more races reported 3.1% 2.7% 1.9%
Ethnicity, % of population
Hispanic or Latino origin 3.4% 3.2% 3.7%
White, non-Hispanic or
Latino origin 77.0% 80.9% 80.8%
Foreign-born persons,
% of population, 2006-2010 8.1% 5.9% 3.7%
Language other than English
spoken at home,
% of population older than 5
years, 2006-2010 10.7% 8.1% 5.9%
High school graduates,
% of population older than 25
years, 2006-2010 92.6% 91.9% 86.2%
Bachelor's degree, % of pop. 51.6% 45.2% 25.0%
December 2012Transit Expansion HIA 25
Number of veterans, 2006-2010 N/A 10,616 511,253
Mean travel time to work (minutes), workers
age 16+, 2006-2010 16 17.8 23.2
Number of housing units, 2011 NA 69,961 2,723,415
Homeownership rate, 2006-2010 48.5% 57.6% 70.0%
Housing units in multi-unit structures, %,
2006-2010 39.9% 30.6% 19.6%
Median value of owner-occupied housing
units, 2006-2010 $164,700 $153,900 $137,700
Number of households, 2006-2010 42,114 63,420 2,349,955
Mean number of persons per household,
2006-2010 2.26 2.34 2.45
Per capita money income in past 12 months
(2010 dollars), 2006-2010 $23,859 $25,124 $24,724
Median household income 2006-2010 $41,287 $45,786 $46,262
Poverty level, % of population, 2006- 2010 22.9% 18.4% 14.0%
Data from the U. S. Census, 2010
Columbia lies almost equidistant between the two largest cities in the state, Kansas City and St.
Louis, and is about 30 miles north of the state capital of Jefferson City. The City is home to the
University of Missouri, the flagship school of the University of Missouri system, as well as Columbia
College and Stephens College.
Boone County was ranked ninth overall in
the 2012 County Health Rankings out of 115
counties in Missouri. Because of the sizable medical
network in Columbia, the number of persons per
physician in the county is 559:1, less than half the
overall state ratio of 1,274:1 (national benchmark =
631:1). Eighty-six percent of the county’s population
has graduated from high school, and 75% have received some college education (national
benchmark = 68%, state mean = 61%). However, the county does mirror some state and national
trends for negative health behaviors. Adult smoking in the county is at 19.0%, similar to the national
December 2012Transit Expansion HIA 26
rate at 19.3%, but below the state rate of 21.1%. Missouri has the eleventh-highest rate of adult
smoking in the nation. According to the 2011 Missouri Department of Health and Senior Services
BRFSS, about 28% of Missouri adults participated in no leisure time physical activity. Only one-half
(49.5%) of Missouri adults achieved the recommended amount of daily physical activity. Relatedly
Missouri is the eleventh-most obese state with an adult rate of 30.3%, and the tenth-most inactive
state with regard to physical activity. If the current obesity trend continues, Missouri is projected to
have an adult obesity rate of 61.9% by 2030. Missouri’s obesity-attributable direct health care cost
per adult is among the highest in the nation. The state is projected to spend $761 per person in 2013
and $1,834 per person by 2018 (Thorpe, 2009). However, Boone County does have slightly lower
rates of adult inactivity (21%) and obesity (28%) compared with overall state averages (2012 County
Health Rankings).
Table 5: Local and State Health Outcomes Compared to the National Benchmark
Boone National
Health Outcomes County Missouri Benchmark *
Poor or fair health, % of
population 12% 16% 10%
Poor physical health days,
mean days/mo 2.9/mo 3.6/mo 2.6/mo
Poor mental health days,
mean days/mo 3.4/mo 3.7/mo 2.3/mo
Adult smoking, % of
population 19% 24% 14%
Adult obesity, % of
population 28% 31% 25%
Physical inactivity, % of
population 21% 28% 21%
Motor vehicle crash death
rate 16/100,000 19/100,000 12/100,000
Uninsured, % of population 13% 15% 11%
December 2012Transit Expansion HIA 27
Primary care physician to
total population ratio 559:1 1,274:1 631:1
Preventable hospital
stays** 55 75 49
High school, % of
population 86% 86% NA
Some college, % of
population 75% 61% 68%
Unemployment, % of
population 6.40% 9.60% 5.40%
Children in poverty, % of
population 17% 21% 13%
Inadequate social support,
% of population 18% 19% 14%
Violent crime 433/100,000 518/100,000 73/100,000
Limited access to healthy
foods, % of population 16% 8% N/A
*The National Benchmark is the 90th percentile for all counties.
**Preventable hospital stays are measured as the hospital discharge rate for ambulatory
care-sensitive conditions per 1,000 Medicare enrollees.
Data from the County Health Rankings Web site (www.countyhealthrankings.org).
.
December 2012Transit Expansion HIA 28
Transit Expansion HIA
Screening
Screening for this HIA took place during the Summer of 2011. At that time, it became apparent
that Columbia Transit had almost exhausted the reserve fund it had been using since 2007 to help
fund operations. From 2007 to 2011, Columbia Transit encountered increased fuel costs as well as
unexpectedly high demand from University of Missouri student riders. During that period, student
ridership increased 700% with the addition of the “Black and Gold” bus routes, earning Columbia
Transit several state awards for ridership. However, fares on these two routes were offered at well
below cost. In order to avoid depleting the reserve fund during the fiscal year of 2012, service cuts
and fare increases were proposed.
Through the diligent work of the Columbia City Council, budget adjustments were made to
preserve services at approximately the same level through September 30, 2012. Concurrently,
however, fares increased for both student and non-student riders. Also during this time, the Transit
System Task Force was established by the Mayor of Columbia. This ad hoc group was created in the
fall of 2011 to explore a potential transit partnership between the City and the University of
Missouri.
During this time the PedNet Coalition applied for and received funding from the Robert Wood
Johnson Foundation’s Roadmaps to Health Community grant. PedNet was one of only 12
organizations nationwide, and the only one from Missouri, to receive funding. The grant helps to
address County Health Rankings findings. County Health Rankings are published each year through
collaboration between the Robert Wood Johnson Foundation and the University of Wisconsin
Population Health Institute. These data compare the health of all counties in the United States. The
PedNet grant proposal focused on conducting an HIA to inform policy and decision-makers about
December 2012Transit Expansion HIA 29
the likely health effects of expanding public transit services in Columbia. The grant also proposed
initiating discussions about how to sustain the use of HIAs in Columbia and Boone County.
Matching funds to carry out the HIA were received by Central Missouri Community Action
(CMCA) via the Healthy and Active Communities Support for Local Policy Change grant from the
Missouri Foundation for Health (MFH). The Columbia/Boone County Department of Public
Health and Human Services contracted with PedNet and CMCA to conduct the HIA and other
activities described in the grant, and the HIA Partner Team, consisting of staff from all three
organizations, was created.
Scoping
The scope of the HIA was determined by the HIA Partner Team. During this phase, participant
roles, research questions, data sources, and target populations were identified.
Roles. HIA staff from the Health Department directed the HIA process, including data
collection, dissemination of results, and other communications related to the transit HIA and the
sustained use of HIAs in the community. Staff from PedNet and CMCA would assist in data
collection and build support for HIAs within the community.
Target Population. The population targeted by the HIA is individuals and families living at
or below 200% of the Federal Poverty Level, or those with annual incomes below $38,180 for a
family of three. Although many in the population qualify for half-price bus fares, transportation
remains a significant barrier. In addition, a second population identified during scoping was
individuals and families who are not currently transit users, but who would potentially become users
if service were expanded. This population will be discussed further in the stakeholder engagement
section. Because Columbia Transit bus routes serve many different populations of varying health
status within the city, a baseline health assessment was created using county-level data.
December 2012Transit Expansion HIA 30
Health Determinants. Four primary health determinants were determined by the HIA
Partner Team to be most likely affected by expanding bus service in Columbia.
Physical activity
Exposure to the outdoors
Access to health care, employment, education, and healthy food options
Creation of a livable and sustainable community
December 2012Transit Expansion HIA 31
Logic Model Depicting Policy Impacts, Health Determinants,
and Related Health Impacts
December 2012Transit Expansion HIA 32
Based on these health determinants, our research question is as follows: “How will expansion of
Columbia Transit services impact community health?”
Research Methods. A number of research methods were used for the HIA. We evaluated
peer-reviewed literature published in academic journals, gathered reports and information from
third-party sources, interviewed topic experts and community stakeholders, used Geographic
Information System mapping, and collected and analyzed new data. Third-party sources included
but were not limited to the Centers for Disease Control and Prevention, Robert Wood Johnson
Foundation, and the American Public Health Association. We also used focus group data compiled
from the PedNet-sponsored Community Conversations about Transit, which will be discussed
further in stakeholder engagement.
Stakeholder Engagement. The HIA Partner Team engaged stakeholders in a variety of
ways. Prior to the Partner Team creating the formal HIA plan during the scoping phase, PedNet
held four Community Conversations about Transit between February and May, 2012. These
community meetings were hosted by different members of the Columbia City Council at a location
in their corresponding city ward. All four conversations included a total of 183 participants. The
purpose of the conversations was to engage community members, elected leaders, and City staff to
identify short- and long-term visions, challenges, and actions that could be taken to address public
transit challenges in Columbia. Groups of five to eight people were led in discussion by a trained
table host. Many members of the HIA Partner Team acted as table hosts for the discussions. After a
large group discussion, the vision elements, identified challenges, and action plans were recorded on
flip-charts and participants then voted using colored stickers to identify ideas they supported or felt
were most important. Table hosts noted a particular topic that came up quite frequently at all four
conversations was “I would like to ride the bus, but…”. Using this feedback and an interim
summary report of the community conversations during the scoping phase, the Partner Team
December 2012Transit Expansion HIA 33
decided to add participants who were not currently using transit services as a secondary population.
This secondary population could potentially be attracted to use public transit if services were
expanded.
As part of our efforts to inform decision-makers about HIA, we conducted key informant
interviews with several representatives of City Government and Administration. We held
conversations with the director of the Health Department, two City Council members, the City
Manager and Deputy City Manager, the City Director of Sustainability, the Assistant Superintendent
for Columbia Public Schools, the City Transportation Administrator, and the Director for
Community Planning. During all of these conversations, we introduced the concept of HIA and
promoted its utility in policy planning and decision-making. We also discussed this pilot HIA and
gained insight into decision-making regarding public transit in Columbia. All these decision-makers,
as well as other department heads and representatives from the public schools and other local
agencies, attended a half-day workshop on HIAs, which was covered by local television and print
media.
Several conversations by HIA Partner Team members were also held with key informants from
either the primary HIA population or those who provided services to the primary population.
Specifically, HIA Partner Team members spoke with administrators from a community health clinic,
CMCA, the Health Department, Refugee and Immigration Services, and Head Start. These
conversations provided qualitative data related to public transit.
Primary research collection offered an opportunity to involve stakeholders in participatory
research. We engaged community members from our HIA population, low-income Columbians, to
conduct a survey on the transportation disadvantaged, public transit use, and accessibility of
employment and health care. The survey was developed by HIA Partner Team members and
discussed with community stakeholders to ensure that the questions were clear, concise, and
December 2012Transit Expansion HIA 34
appropriate (Appendix 1). Three trained community members then administered the four-page
paper survey to adults at a variety of locations in Columbia, including the Social Services
Administration Office, the bus depot, the Columbia Mall, the Health Department, CMCA, and
MedZou, a free clinic operated by the University of Missouri School of Medicine. Community
members who administered the survey received Wal-Mart gift cards, and those who took the survey
had the opportunity to be entered into a drawing to win one of three gift cards. Demographic
characteristics of survey participants are presented below.
December 2012Transit Expansion HIA 35
Table 6: Community Survey Demographic Characteristics
Demographic All Frequent Bus Infrequent Bus
Characteristics Respondents Riders Riders
(n = 201) (n = 131) (n = 70)
Gender 47.7% male 37.1% male 46.6% male
52.3% female 62.9% female 53.4% female
Race/ethnicity
Black/African 49.3% 57.3% 45.7%
American
White 26.5% 22.9% 38.6%
Latino 9.6% 13.0% 5.7%
Other 4.6% 4.7% 5.7%
Age, Mean (SD) 36.0 (12.0) years 35.7 (10.9) years 36.3 (13.7) years
Location of survey
Social services 19.2% 21.4% 20.0%
Health services 18.3% 17.6% 22.9%
Downtown 11.9% 14.5% 10.0%
Library 11.0% 13.0% 8.6%
On the bus 6.8% 10.7% 1.4%
Retail 6.8% 9.2% 4.3%
School/university 9.1% 3.8% 21.4%
Data from the survey (n=201) were entered into Microsoft Excel and analyzed using SPSS. We
also met with community volunteers who administered the survey to discuss the stories they heard
from respondents and other anecdotes about transportation problems, accessibility, and perceptions
of public transit. These qualitative data are also included in the assessment portion of our HIA.
December 2012Transit Expansion HIA 36
Review of Evidence
Physical Activity
What we thought we would find:
Using public transit increases daily physical activity.
What did the literature tell us:
Studies found that transit riders spend more time walking and often walk further
distances compared to car drivers, potentially meeting daily recommended physical
activity guidelines. Residents of transit-oriented developments have higher amounts
of overall physical activity and are more likely to meet physical activity guidelines.
Complete streets polices and public transit can potentially complement each other by
providing opportunities for both physical activity and expanded range of travel.
Regular physical activity is one of the best ways to achieve and maintain a healthy life. Physical
activity reduces the risk for some of the leading causes of illness in the United States such as heart
disease, type II diabetes, and high blood pressure. The Centers for Disease Control and Prevention’s
physical activity guidelines recommends that adults ages 18 to 64 engage in 150 minutes per week of
moderate-intensity or vigorous-intensity physical activity (about 20-30 minutes daily). Moderate-
intensity means activity that raises heart rates, such as walking fast. Vigorous-intensity activity raises
the heart and breathing rates even higher, for example jogging or swimming laps. Children and
adolescents ages six to seventeen should get about an hour of physical activity each day. We will
review data on how public transit use, transit-oriented development, and complete streets policies
contribute to increased physical activity.
Various studies have shown that public transit can affect physical activity. One frequently cited
study was conducted by Besser and Dannenberg (2005). These authors used 2001 National
December 2012Transit Expansion HIA 37
Household Travel Survey (NHTS) to determine time spent walking to and from public
transportation. The NHTS addresses transportation behaviors such as purpose, travel time, and
mode of transportation. Besser and Dannenberg (2005) found a mean daily walking time of 24.3
minutes per person (median, 19 minutes). Individuals without a car spent more time walking (mean
= 28.1 minutes) than did those with a car (mean = 19.7 minutes). Individuals without a car were
nearly twice as likely to walk about 30 minutes to and from their public transit destinations (OR =
1.97, 95% CI = 1.52-2.55). The authors concluded that walking to and from public transit
contributes toward achieving the recommended levels of daily physical activity. Morabia et al. found
that car drivers who switched to public transportation for five days for the duration of the study
burned an additional 124 calories per day (2010). In addition, participants who used public
transportation five days per week, rather than driving, lost approximately one pound of body fat in
six weeks. A separate study focusing on physical activity by Hill et al. (2003) estimated that
expending an additional 100 calories per day could prevent weight gain in most of the U. S.
population.
A built environment emphasizing public transit and active transportation, such as walking or
biking, also offers greater opportunities for physical activity. Transit-oriented developments, which
consist of compact, walkable, and transit-supportive environments, have been consistently
associated with higher amounts of active transportation and overall physical activity. Frank et al.
summarized a number of studies linking transit-oriented development to an increase in physical
activity (2011). Among the key findings are that as residential density increases, body mass index
(BMI) decreases. In addition, individuals living in mixed-use neighborhoods were 2.4 times more
likely to meet the CDC’s physical activity guidelines. Many of the vision elements voted on by
participants in the PedNet Coalition’s Community Conversations about Transit were votes for
December 2012Transit Expansion HIA 38
improved transit-related infrastructure, including exploring transit-oriented developments in
Columbia.
In 2004 Columbia became the first city in Missouri to enact a complete streets policy. Complete
streets are roadways designed for use by all modes of motorized and non-motorized transportation.
Common features include bike lanes, safe crosswalks, and roundabouts. These features are designed
to promote more trips taken by active transportation. An assumption of complete streets policy is
that active transportation and public transportation will complement each other. Individuals
engaging in active transportation benefit from opportunities for physical activity as well as the
increase in range by which they can travel using public transit.
In 2005, Columbia was one of four cities across the country to receive a federal non-motorized
transportation grant. The purpose of the grant was to determine if investments in programs and
projects related to active transportation would get more people walking and bicycling. The funds
were used to build sidewalks, bicycle lanes, and pedestrian and bicycle trails that connect directly
with transit stations, schools, businesses, recreation areas, and other community activity centers in
Columbia. As a result of the changes made to the infrastructure, there were significant
improvements in pedestrian and bicycle activity. To monitor these improvements, pedestrian and
bicycle counts and surveys were performed at seven strategic locations throughout the city. In 2011,
peak-hour weekday pedestrian activity increased by approximately 56% over the 2010 count, and
74% from the 2007 count. In 2011, peak-hour weekday bicycle activity increased by approximately
46% from the 2010 count, and 147% from the 2007 count.
December 2012Transit Expansion HIA 39
Access to Outdoors
What we thought we would find: Use of parks and recreational areas affects
health. The degree to which use of parks affects health depends on activities
performed within parks and recreational areas. In addition, barriers to accessing
parks and recreational areas limit the potential for positive health impacts.
What did the literature tell us: Parks and green space influence both physical and
mental health. Proximity to a park or green space is associated with higher usage.
Public transit could improve access for low-income populations who have limited
access to parks. Columbia residents visit parks to engage in adult and youth activities,
but indicated that park facilities are not close enough to their home. Many would like
to see more trails and more parks in their neighborhoods.
The majority of Americans visit their local parks, with nine out of ten annually participating in
an outdoor recreational activity (Cordell et al., 2004; Godbey et al., 1992, as cited in Mowen, 2010).
Research has shown that living in proximity to a park or green space, generally defined as within
one-half mile, is associated with greater usage, increased opportunities for physical activity, and
decreased stress. Similarly, having more parks and park acreage within a community is associated
with higher physical activity rates within parks among a variety of populations (Kaczynski &
Henderson, 2007; Brownson et al., 1992, as cited in Mowen, 2010). Deshpande et al. (2005) reported
that respondents who had used parks in the past month were more than four times more likely to
have engaged in physical activity at least five times per week for more than 30 minutes per episode
(as cited in Kaczynski & Henderson, 2007). The CDC recommends at least 30 minutes per day of
physical activity at a moderate-intensity level, or enough to raise your heart rate. Regular exercise at a
moderate-intensity level can reduce the risk for several chronic health conditions such as type II
diabetes, cardiovascular disease, and some types of cancer. There may also be numerous
December 2012Transit Expansion HIA 40
psychological benefits for park users that arise from being in proximity to natural environments
(Bedimo-Rung et al., 2005). Park users have reported lower levels of anxiety and depression after
visiting parks. Parks also facilitate social interaction, which can influence physical activity and mental
health.
Transit expansion will likely impact access and exposure to park and recreation areas in
Columbia. Expanding the availability of, safety of, and access to a variety of transportation options
and integrating health-enhancing choices into transit policy has the potential to prevent chronic
diseases (CDC, 2011). Lower income populations and some racial and ethnic minority populations
have limited access to parks and recreational facilities. These disparities partially explain lower
physical activity levels among these populations (Mowen, 2010). Providing greater access by
improving travel connections to parks and recreational areas is one strategy to offer low
socioeconomic populations opportunities for physical activity and social cohesion.
The National Recreation and Park Association recommend that a community’s park system
should be minimally composed of a ratio of about 6.25 to 10.5 acres of developed open space per
1,000 population. Currently, Columbia has 3,040 city-owned acres of parks and green space and
50.03 miles of trails. At about 28 acres per 1,000 people (3,040 acres/108,500 residents per 2010
census x 1,000), the city’s park space to population ratio exceeds recommendations.
A 2011 survey conducted by the City of Columbia’s Parks and Recreation Department found
that 99% of those surveyed visited at least one city park in the past year. The three most-visited
parks were Cosmo, Stephens, and Cosmo-Bethel. Forty-seven percent of survey respondents
indicated that someone in the household visited the park to participate in adult or youth sports.
Seventy-nine percent of survey respondents visited at least one of Columbia’s trails, with the MKT
Trail being the most visited. However, 24% of respondents indicated that park facilities were not
close enough to their residences, while 29% responded that there were not sufficient parks and
December 2012Transit Expansion HIA 41
green space within walking distance of their home. Households also indicated they would like to see
more walking and biking trails and small neighborhood parks.
December 2012Transit Expansion HIA 42
Access to Health Care, Employment, Education, and Healthy Food Options
Public transit currently accounts for a relatively small portion of trips in most communities, but
these trips tend to be high value to users and society. Transit provides basic mobility by helping
people reach important activities such as medical services, education, and employment (Litman,
2012). The decision to ride public transit is based on a complex set of circumstances, including
mobility, availability of alternatives, cost of service, safety in getting from origin to bus stop and bus
stop to destination, travel barriers along pedestrian paths, and other factors (Hess, 2009). Combined
into this section are the identified health impacts of access to health care and social services,
employment, education, and healthy food options under general mobility offered by an expanded
public transportation system.
Access to Health Care Facilities
What we thought we would find: Transportation is a significant barrier to
obtaining health care services for the transportation disadvantaged.
What did the literature tell us: Households that are transportation disadvantaged
experience barriers to health care services. A significant number of Americans do not
access health services due to transportation problems. When accessing health care,
transportation barriers are nearly as significant as cost barriers. Public transit riders
are more likely to be late for appointments or not keep them at all.
What our local survey found: Respondents who reported being primarily
dependent on public transit were more likely than those who owned cars to miss
health care appointments. Most respondents chose health care services based on
proximity to the bus route.
Public transit is considered one of the most important social determinants of health. Reducing
health disparities by increasing the prevention workforce’s collaboration with community partners
December 2012You can also read