Exploration of Urban Interaction Features Based on the Cyber Information Flow of Migrant Concern: A Case Study of China's Main Urban ...
←
→
Page content transcription
If your browser does not render page correctly, please read the page content below
International Journal of
           Environmental Research
           and Public Health

Article
Exploration of Urban Interaction Features Based on the
Cyber Information Flow of Migrant Concern: A Case
Study of China’s Main Urban Agglomerations
Chun Li and Xingwu Duan *
 Institute of International Rivers and Eco-Security, Yunnan University, Kunming 650091, China;
 lichun@ynu.edu.cn
 * Correspondence: xwduan@ynu.edu.cn

 Received: 1 April 2020; Accepted: 11 June 2020; Published: 13 June 2020

 Abstract: In the context of “space of flow”, urban interaction has become the key force impacting
 urban landscape evolution and urban sustainable development. Current research on urban interaction
 analysis is mainly conducted based on the interaction of geographical elements, the virtual flow of
 information in cyberspace has not been given sufficient attention, particularly the information flows
 with explicit geographical meaning. Considering the dramatic population migration and the explosive
 growth of cyberspace in China’s main urban agglomerations, we constructed the information flow of
 migrant attention (IFMA) index to quantify the urban information interaction derived from public
 migrant concern in cyberspace. Under the framework coupling spatial pattern analysis and spatial
 network analysis, exploration spatial data analysis (ESDA) and complex network analysis (CNA)
 were adopted to identify the urban interaction features depicted by IFMA index in the three main
 urban agglomerations in China. The results demonstrated that, in the study area: (1) The IFMA index
 presented a reasonable performance in depicting geographical features of cities; (2) the inconformity
 between urban role in the network and development positioning confirmed by national planning
 existed; (3) in the context of New-type urbanization of China, urban interaction feature can be a
 beneficial reference for urban spatial reconstruction and urban life improvement. Using the cyber
 information flow with geographical meaning to analyze the urban interaction characteristics can
 extend the research angle of urban relationship exploration, and provide some suggestion for the
 adjustment of urban landscape planning.

 Keywords: urban interaction; information flow; urban agglomeration; urban network; cyberspace

1. Introduction
      In the context of globalization and production fragmentation, cities are no longer islands and have
begun to exploit scale economies in complementary relationships and synergies in cooperative activities.
The pattern, which relies solely on internal know-how, does not fit in this development stage and brings
the presence of “market failure” [1]. Under the continuous construction of high-speed interactive
passages, intercity interactions expressed by the flowing of populations, materials, information,
techniques, capital, etc., has been reinforced. This brings the achievement of urban economies of
agglomeration [2]. The evolution pattern of urban space is transforming from the static “space of place”
into the dynamic “space of flow” under the push of such intensified urban interaction [3]. Internal
resources, environmental and socio-economic conditions are no longer the only force that impacts the
change of urban landscape. External influences, accompanied by the activities of interaction between
cities, merged into the process of urban development and promoted the form of urban organization
mechanism in a networked and linked way. In such a context, the influence of urban interaction is

Int. J. Environ. Res. Public Health 2020, 17, 4235; doi:10.3390/ijerph17124235    www.mdpi.com/journal/ijerph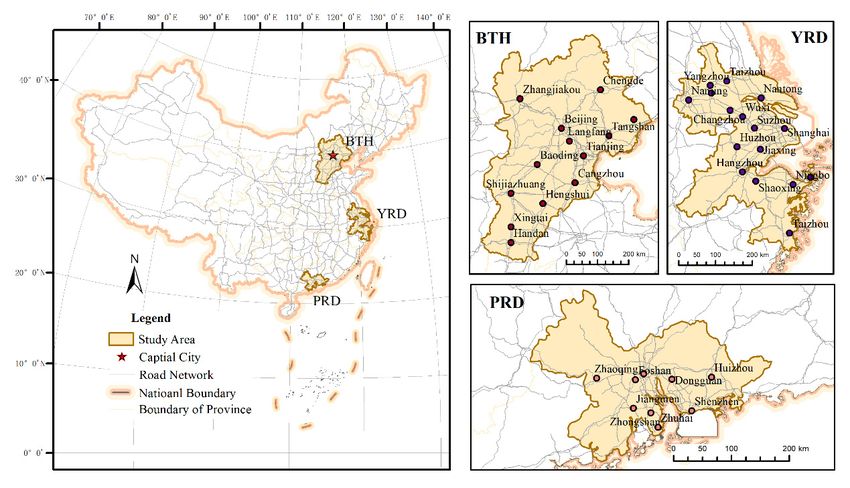
Int. J. Environ. Res. Public Health 2020, 17, 4235                                                      2 of 20

further emphasized. Measuring and analyzing urban interaction feature becomes more and more
crucial for effectively guiding urban landscape evolution, urban resource allocation, and protection of
the urban environment, etc. [4–7].
      Urban interaction represents the exchange of multiple regional elements, which cover various
aspects of production activity and daily activities. It is the one thing that makes cities, which are spatially
separated from each other, constitute an urban system with a certain structure and function. Existing
studies regarding urban interaction can be divided into two types: studies based on the value chain or
on the flow of elements. The value chain-based studies conventionally explore the characteristics of
urban interaction from the perspective of the market. Based on a series of market activities, which aim
at increasing the industrial value of the inner and outer city, the value chains network of urban areas,
such as the allocation of global industry, the distribution pattern of headquarters and branches of
multinational corporations, etc. are constructed [8–12]. This type of study conventionally explores
urban interactions among global cities, mega cities, or regional core cities. The suitability of these studies
for small cities or towns is limited due to the lack of industrial data. Another type of interaction research
is conducted based on the monitoring and analysis of the flow of urban elements. This type of research
can cover cities with different levels and sizes. They are based on the interaction links triggered by
intercity elements flow that with orientation and quantitative features to conduct relevant exploration.
The monitoring of actual flow and the modeling of flowing situations are the main approaches adopted.
Thereby, the monitoring of actual flow can provide accurate and detailed information to explore urban
interactions, such as the monitoring of cargo transport [13,14], population migration [15,16], intercity
telecommunication flow [17], etc. However, the dynamic monitoring of actual flows required a great
deal of time, manpower, and material resources to deploy, which may be too expensive for many
researchers. Due to the difficulty in obtaining interaction data, many scholars have endeavored to derive
models according to relevant theories, such as the theory of spatial interaction, the law of universal
gravitation, and the field theory. A series of interaction models have been developed to help explore
urban interaction features, including the Reilly model [18,19], the break point model [20,21], the Huff
model [22,23], the maximum entropy model [24,25], the radiation model [26,27], the field-intensity
model [28] etc. Along with the rise of the networked research framework, the exploration of element
flow with the help of social network or complex network analysis gets more attention [29,30]. Through
the construction of an urban network based on the modeling results of interaction models or actual
interaction flows [31,32], relevant network indexes have been employed to identify the pattern and
structure of urban interaction networks.
      With the diversity and complications of urban systems, there are some deficiencies that should be
supplemented in the current interaction research. In terms of the research objective, relevant studies
mainly focused their attention on the urban interaction features depicted by the flow of entities elements
in geographical space, the virtual elements flow, such as information flow in cyberspace, has not been
well studied. Some studies concerned with the flow of insubstantial elements mainly conduct their
analyses based on the interaction structure of the element itself [33]. The explanation of the actual
meanings of such flows is insufficient. From the angle of the research approach, relevant research
largely focuses on the topology structure analysis of urban interactions. The comprehensive analysis
of urban distribution patterns coupled with interaction structures is deficient. As we know, different
elements’ interactions typically provide distinct urban characteristics, and the lack of exploration
regarding virtual elements flow may pose some impediment to the comprehensively understanding of
urban development in the current information era. Both the spatial distribution pattern and interaction
relationship of urban elements are important in pushing the networked development of urban areas,
the comprehensive analysis is necessary.
      Urban agglomeration is the new spatial unit that currently participated in global competitions
that is also the organic whole with complex and close inner interactions [34]. The exploration of urban
interaction features is extremely important in this area, especially for China’s urban agglomerations.
Since the reform up in 1978, China has experienced rapid urbanization and economic growth [35].
Int. J. Environ. Res. Public Health 2020, 17, 4235 3 of 20
The enormous and widespread flowing of urban elements can be identified in such processes. Therein,
one of the most significant flow can be seen as the migration of population. In 2015, there was an
estimated population of 247 million migrants in the whole country, which accounted for 17.96% of the
total national population [36]. Meanwhile, along with the explosive growth of cyberspace, the flow
of information has become more and more convenient in China. Taking the amount of netizens
as an example, the number has increased from 4 million in 1999 to 688 million in 2015, and the
internet penetration rate (the ratio of netizens to the total population) in 2015 reached 50.30% [37,38].
Such dramatic flows of regional elements have reinforced urban interactions and have pushed the
construction of urban networks in China, both in geographical space and cyberspace. The role
of urban agglomeration in this process cannot be neglected [34]. Taking the three national urban
agglomerations in China [39] as an example, they occupy only 5.09% of national territory but have the
highest urbanization rate. In 2015, the amount of the migrant population in these areas has arrived
more than 65 million, accounting for 25.32% of the total migrants [36]. Internet penetration has reached
more than 70%, which was much higher than that of the whole country [37]. These areas had the
most active urban interaction and are leading the construction of urban network in China. Therefore,
understanding and exploring urban interaction features in the urban agglomerations of China can
provide valuable information for improving inner urban relationships, nurturing urban systems,
and realizing regional coordinated development. It is a good reference not only for China but also for
other regions where with dramatic interactions resulted from elements’ flows.
In this paper, focused on the increasing influence of urban interaction under networked develop
trends of urban space, we aim at exploring the urban interaction characteristic through the analysis of
information flows. Considering the widely observed population migration and the explosive growth of
cyberspace, the cyber information flow, which has not received enough attention in relevant studies but
occupied a significant role in the current information era, is quantified to construct an information flow
of migrant attention (IFMA) index. Migration-related cyber search queries have been adopted in IFMA
index to express intercity information flow triggered by public migrant concerns in cyberspace. Taking
three main urban agglomerations of China as study area, the comprehensive framework coupling
spatial pattern description and spatial network analysis is built to explore urban interaction features
conveyed by IFMA index in these areas. Based on the research, we strive to extend the research angle of
urban interaction, combine the geographical meaning with virtual information flow, and provide some
support for healthy management and planning of urban areas. This paper is organized as follows:
In Section 2, we introduce the study area and data. In Section 3, we present the methods used in
this paper, including the construction of the IFMA index and the analysis framework that couples
spatial patterns and spatial networks. Section 4 reports the results from the spatial characteristic
analysis. Section 5 conducts the further discussions based on the results. Last, in Section 6, we conclude
this paper.
2. Study Area and Data
2.1. Study Area
The Chinese urban spatial structure is composed of three metropolitan regions and 13 urban
agglomerations [40]. Therein, the Beijing-Tianjin-Hebei metropolitan region (BTH), the Yangtze River
Delta (YRD), and the Pearl River Delta (PRD) are the three world-class metropolitan interlocking
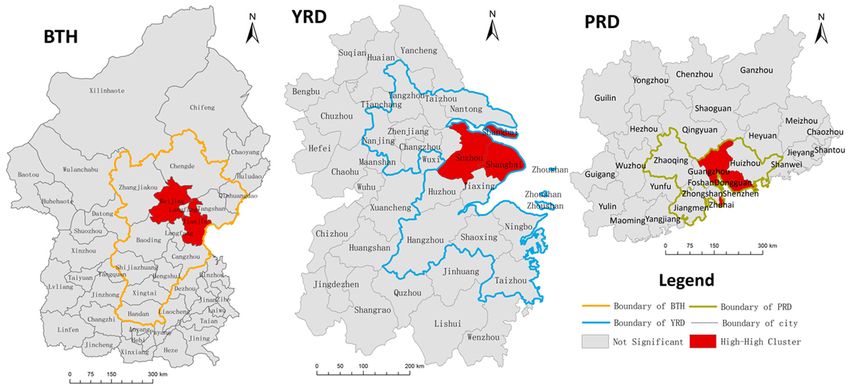
regions of China. In this study, we selected these three metropolitan regions, which included 38 cities
(i.e., 13 cities from BTH, 16 from YRD, and nine from PRD), as our study area, as shown in Figure 1.
According to the Nationwide Urban System Planning of China (2006–2020), there are four national
central cities (i.e., Beijing, Tianjin, Shanghai, and Guangzhou), and five regional central cities (i.e.,
Shijiazhuang, Shenzhen, Nanjing, Hangzhou, and Ningbo) located in the study area. Remarkable
advantages in scientific and technological innovations, transportation, international competition,
cultural influence, human resources, etc. can be observed in these areas and bring them a powerful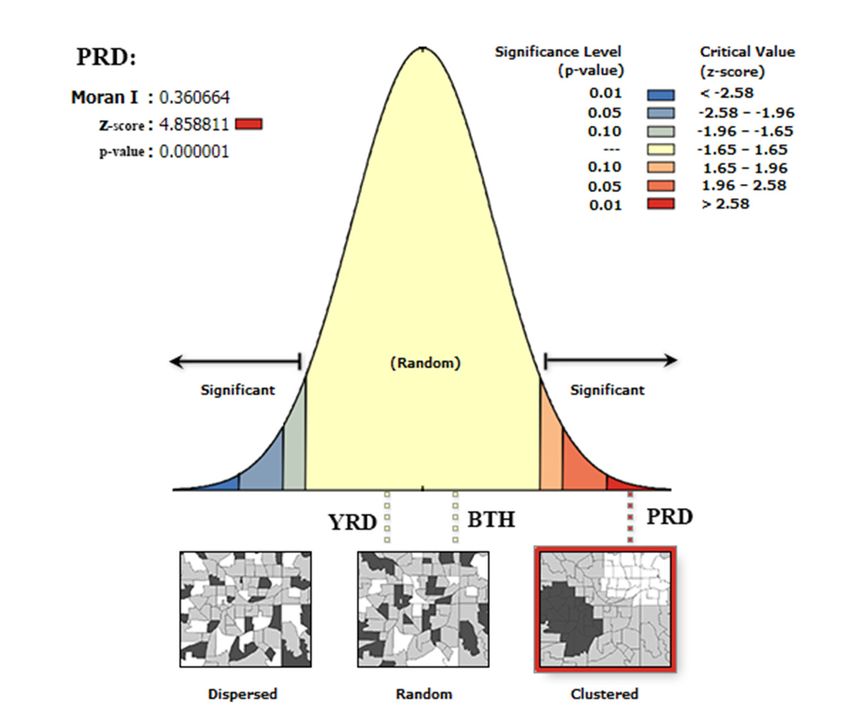
Int. J. Environ. Res. Public Health 2020, 17, 4235 4 of 20
product (GDP) in 2015, respectively. From the perspective of urban network links, these regions are
significantly superior
Int. J. Environ. Res. in the
Public Health layout
2020, of interaction corridors, such as the wide distribution of modern
17, 4235 4 of 20
ports and airports, well-organized road networks, and integrated regional policies, etc. Dominant
roles in promoting the development of the national urban system can be depicted in these regions.
attractiveness. From the perspective of urban element distribution, this study area aggregates massive
Therefore, research focused on these areas can be a good reference not only for guiding the healthy
urban resources. For instance, these areas occupy approximately 5.09% of the land of China, but they
development of China’s urban system but also for exploring urban interaction features in other urban
accounted for 23.65% and 39.87% of the national permanent residents’ and gross domestic product
areas with drastic elements flows.
(GDP) in 2015, respectively. From the perspective of urban network links, these regions are significantly
The consistent importance of these regions in China’s development has been confirmed by
superior in the layout of interaction corridors, such as the wide distribution of modern ports and
national planning, which shows that they not only play supporting roles in constructing the multi-
airports, well-organized road networks, and integrated regional policies, etc. Dominant roles in
center pattern of China’s urban system but also be appointed as the core areas of China to participate
promoting the development of the national urban system can be depicted in these regions. Therefore,
in the global economic competition in the future [39]. Thus, exploring these areas is also necessary
research focused on these areas can be a good reference not only for guiding the healthy development
for implementing national general planning and improving urban competitiveness in
of China’s urban system but also for exploring urban interaction features in other urban areas with
future China.
drastic elements flows.
Figure 1. Locations of the study area.
Figure 1. Locations of the study area.
The consistent importance of these regions in China’s development has been confirmed by national
2.2. Data which shows that they not only play supporting roles in constructing the multi-center pattern
planning,
of China’s urban
The data system
mainly usedbut
in also be appointed
this paper includedasthe
thedynamic
core areas of China of
monitoring to migration
participatedata,
in the
theglobal
basic
economic competition in the future [39]. Thus, exploring these areas is also necessary for
geographical information data, and the search query data in cyberspace. The dynamic monitoring implementing
national
data general planning
of migration were usedandtoimproving
confirm theurban competitiveness
major reasons causingin future
public China.
attention on migration in
cyberspace. It is obtained from the dynamic monitoring survey of China’s migration population in
2.2. Data
2015 (http://www.chinaldrk.org.cn/wjw/#/home), which was conducted by the Migrant Population
TheCenter
Service data mainly used to
attached in this
the paper included
National Healththe Commission
dynamic monitoring of migration
of China. Meanwhile, data,the
the basic
geographical information data, and the search query data in cyberspace. The
geographic information was obtained from the National Geomatic Center of China. Finally, search dynamic monitoring
data ofdata
query migration were used
were collected to confirm
based the major
on the Baidu reasons causing
Index-offered by thepublic
Baidu attention on migration
search engine which isina
cyberspace.
widely used Itinternet
is obtained fromprovides
tool and the dynamic monitoring
convenient survey ofinformation
and low-cost China’s migration population
for internet in
users. To
2015 (http://www.chinaldrk.org.cn/wjw/#/home),
better exhibit and exploit the search query data, which relevantwas conducted
search exploitbyservices
the Migrant
basedPopulation
on search
Servicedata
query Center
wereattached to thetypically
produced, Nationalas Health
Google Commission of China. Meanwhile, theand
Trend (www.google.com/trends/) basicBaidu
geographic
Index
information was obtained from the National Geomatic Center of China. Finally, search
(http://index.baidu.com/). In 2015, there were 566 million search engine users in China, accounting query data were
collected
for 82.27% based
of theonnational
the Baidu Index-offered
netizens. A seriesbyofthe Baiduhave
studies search engine
been which is
conducted thata widely used
analyzed internet
data from
tool andTrend
Google providesandconvenient
Baidu Index,and low-cost
and theirinformation
robustnessfor andinternet users. Towere
effectiveness better exhibit and
assessed exploit
[41–44]. In
the search query data, relevant search exploit services based on search query
China, compared to Google, which is the largest search engine in the world, Baidu has a larger sharedata were produced,
typically of
(77.07%) asthe
Google Trend
internet (www.google.com/trends/)
search engine market [37]. Vaughan and Baidu
and Chen Index
[45](http://index.baidu.com/).
collected and compared
In 2015,
the there Google
data from were 566andmillion
Baidu,search engine
and found thatusers
Baiduin Index
China,can accounting
offer morefor 82.27%
search of thedata
volume national
than
netizens. A series of studies have been conducted that analyzed data from Google Trend and Baidu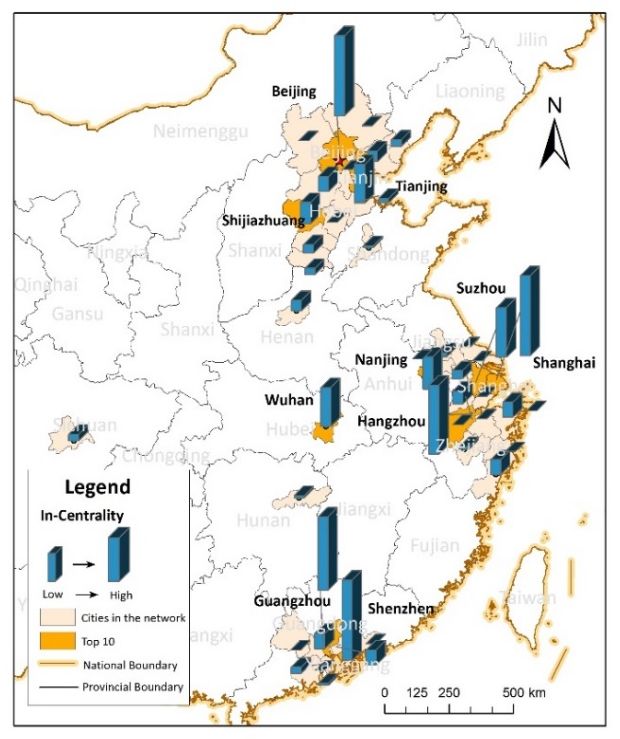
Int. J. Environ. Res. Public Health 2020, 17, 4235 5 of 20
Index, and their
Int. J. Environ. robustness
Res. Public and
Health 2020, 17, effectiveness
4235 were assessed [41–44]. In China, compared to Google, 5 of 20
which is the largest search engine in the world, Baidu has a larger share (77.07%) of the internet search
Googlemarket
engine Trend [37].
in China.
VaughanIn this
andcontext,
Chen [45] Baidu Indexand
collected was employed
compared thetodata
quantify search and
from Google queries
Baidu,in
the cyberspace.
and found that Baidu Index can offer more search volume data than Google Trend in China. In this
context, Baidu Index was employed to quantify search queries in the cyberspace.
3. Methodology
3. Methodology
Urban interaction as the significant force for urban evolution in the context of rapid element
Urban interaction
flowing, exploring as thehas
its feature significant
become theforce for urban
inevitable evolution
content in the context
for identifying urban of develop
rapid element
trends
flowing,
and achievingexploring its feature has become
the agglomeration economicsthe inevitable content for identifying
of cities. Conventional researchesurbanoftendevelop
explore trends
urban
and achieving
interaction the agglomeration
features based on theeconomics of cities.
entity elements in Conventional
geographical researches
space, the often explore
interaction urban
features
interaction
expressed by features
massive based on the entity
information flow elements
in cyberspacein geographical
have beenspace, the interaction
neglected. In this paper,features
we
expressed
endeavor by massive the
to explore information
characteristicflow inof cyberspace have been
urban interaction neglected.
based on the In this paper,
flowing we endeavor
of information in
to explore the
cyberspace, andcharacteristic
further support of urban interaction
the healthy based onofthe
development flowing
urban spaceofin
information
the processin ofcyberspace,
networked
and furtherTo
evolution. support
identifythe healthy
such development
interaction features,of twourban
issuesspace in the
should be process
concerned: of networked
first, how toevolution.
quantify
To
theidentify such interaction
information flow with features,
geographical two issues
meaning should be concerned:
in cyberspace; first, how
second, how to quantify
identify the
information
characteristicflow with geographical
of urban interaction based meaning oninsuchcyberspace; second, howflow.
cyber information to identify
For the thefirst
characteristic
issue, the
of urban interaction
information flow ofbased on such
migrant cyber information
attention (IFMA) index, flow.which
For thebased
first issue,
on the thepublic
information flowon
attention of
migrant
migrating attention
to specific(IFMA)
citiesindex, which based
in cyberspace, on the
has been public attention
constructed on migrating
to quantify to specific
the information cities
flow in
with
cyberspace, has been constructed to quantify the information flow with objective
objective geographical meaning. For the second issue, the analysis frameworks of spatial pattern and geographical meaning.
For the second
spatial network issue,
havethebeen
analysis
coupled.frameworks
Employing of spatial pattern and
the approach of spatial network
exploratory have data
spatial been coupled.
analysis
Employing
(ESDA) andthe approach
complex of exploratory
network analysisspatial
(CNA),data weanalysis
explore (ESDA) and complexfeatures
the comprehensive networkof analysis
urban
(CNA), we explore the comprehensive features of urban interaction
interaction from the perspective of spatial distribution and interactional links. The research from the perspective of spatial
distribution
framework isand interactional
displayed links.
in Figure 2. The research framework is displayed in Figure 2.
Figure 2. Research framework.
3.1. The Expression of Information Flow Derived from Public Migrant Concerns in Cyberspace
To measure cyber information flow with geographical meaning which indicated population
migration, three issues should be investigated: (1) What causes the public attention on migration? (2)
How the causes of migration in cyberspace be delineated? (3) How to comprehensively express the
information flow triggered by public migrant concerns?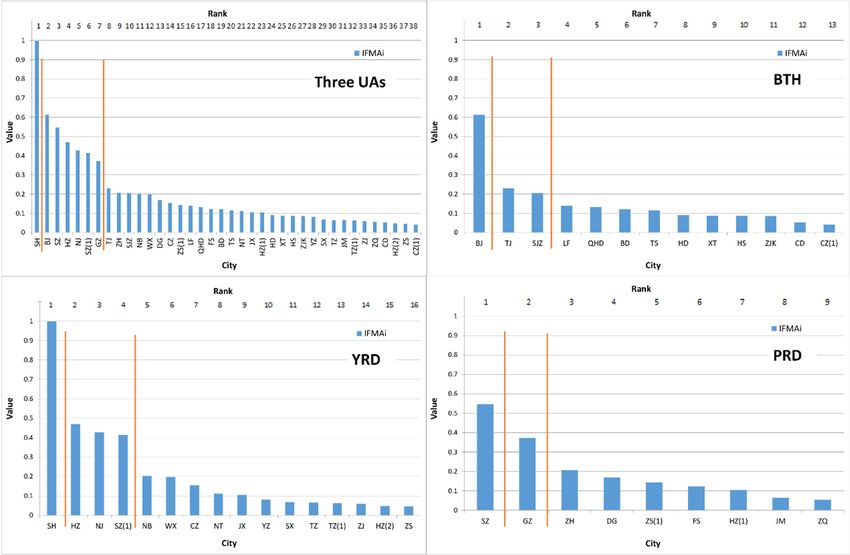
Int. J. Environ. Res. Public Health 2020, 17, 4235 6 of 20
3.1. The Expression of Information Flow Derived from Public Migrant Concerns in Cyberspace
To measure cyber information flow with geographical meaning which indicated population
migration, three issues should be investigated: (1) What causes the public attention on migration?
(2) How the causes of migration in cyberspace be delineated? (3) How to comprehensively express the
Int. J. Environ.
information Res. Public
flow Health by
triggered 2020, 17, 4235migrant concerns?
public 6 of 20
For the first issue, we adopted the results from the dynamic monitoring survey of China’s
For the first issue, we adopted the results from the dynamic monitoring survey of China’s
migration population in 2015 as a reference, based on the statistics of the major reasons for migration in
migration population in 2015 as a reference, based on the statistics of the major reasons for migration
the three urban agglomerations to confirm the major causes in evoking public attention on migration,
in the three urban agglomerations to confirm the major causes in evoking public attention on
as shown in Figure 3. It can be seen that work and trade, study and training, accompanying transferring
migration, as shown in Figure 3. It can be seen that work and trade, study and training, accompanying
of family members and relocation were the main migration factors in the study area. As the transferring
transferring of family members and relocation were the main migration factors in the study area. As
of family members always accompanies family relocation [46], we viewed them as one perspective and
the transferring of family members always accompanies family relocation [46], we viewed them as
marked them as relocation.
one perspective and marked Therefore,
them three main reasons
as relocation. for population
Therefore, migration
three main reasonswere
for confirmed
populationas
work and trade, study and training, and relocation.
migration were confirmed as work and trade, study and training, and relocation.
Figure
Figure 3. The
3. The percentage
percentage ofofmigrant
migrantpopulation
population based
based onon diverse
diversemigration
migrationreason
reasonininthe study
the studyarea.
area.
WT: Work and trade; AFM: Accompanying transferring of family members; R: Relocation;
WT: Work and trade; AFM: Accompanying transferring of family members; R: Relocation; ST: Study ST: Study
andand training;
training; O:O: Others;M:M:Marriage;
Others; Marriage;JRF:
JRF:Join
Join relatives
relatives and
and friends
friendsto
tofind
findaameans
meansofofliving; OM:
living; OM:
Occupation mobility; DH: Deponi of
Occupation mobility; DH: Deponi of Hukou.Hukou.
ForFor
thethe second
second issue,
issue, ininthe
theinternet
internetera,
era,the
theapplication
application of of cyber
cyber tools
toolscan
canhelp
helpinternet
internetusers
userstoto
promptly acquire low-cost information. The flowing of information triggered
promptly acquire low-cost information. The flowing of information triggered by individual action in by individual action in
cyberspace
cyberspace hashas become
become moreand
more andmore
moreconvenient.
convenient. As As the
the most
most widely
widelyusedusedinternet
internettools,
tools,search
search
engines provide information and also record individual attention on specific objectives. The
engines provide information and also record individual attention on specific objectives. The collection
collection of public concerns on specific search keywords can quantify the interaction of information
of public concerns on specific search keywords can quantify the interaction of information which with
which with certain directions in cyberspace. In this paper, we selected a series of migration-related
certain directions in cyberspace. In this paper, we selected a series of migration-related keywords,
keywords, which are suited for cyber searching, to depict the public attention on migration derived
which are suited for cyber searching, to depict the public attention on migration derived from distinct
from distinct migrant reasons. The selection of keywords following the least effort principle in cyber
migrant reasons. The selection of keywords following the least effort principle in cyber information
information retrieval behaviors [47,48], the basic structure of keywords is set as in Chinese, with
retrieval
simplebehaviors
and brief[47,48],
features.theThe
basicspecific
structure of keywords
keyword is set were
candidates as in Chinese,
confirmed with
by simple and brief
brainstorming
features. The specific keyword candidates were confirmed by brainstorming
common words used in searching for migration and review of related literature [49–52]. Words common words used
in searching forkeyword
related to the migration and review
candidates wereofalso
related
been literature
selected, such[49–52]. Words
as “rent” andrelated
“lease”.to the keyword
candidates were also been selected, such as “rent” and “lease”.
For the third issue, the information flow of migrant attention (IFMA) index was constructed to
For the third issue,
comprehensively depictthethe
information
informationflow flowofderived
migrant attention
from public (IFMA)
migrant index wasinconstructed
attention cyberspace.to
comprehensively
The construction depict
of thethe information
IFMA flow derived
index followed from(1)
four steps: public
The migrant
keywordsattention
candidatesin cyberspace.
and their
Thesimilar
construction
words of the combined
were IFMA index followed
with fourof
the names steps: (1) The
objective keywords
cities candidates
to construct and theirsearch
the combined similar
keywords,
words which express
were combined with thepublic migrant
names attentioncities
of objective on the objective cities.
to construct (2) The Baidu
the combined searchIndex (BI)
keywords,
offered
which by the
express Baidu
public search attention
migrant engine was onemployed to quantify
the objective the
cities. (2) cyber
The attention
Baidu Index on(BI)the combined
offered by the
search
Baidu keywords
search engineduring a specifictoduration
was employed quantifyofthetime,
cyberto identify
attentionthe
onintercity information
the combined searchflow with
keywords
distinct original and terminal cities. (3) The sifting of keywords was conducted following the
principle of maximum value and continuity in time. The most popular keyword was chosen from a
series of its similar words (e.g., “house renting” with BI: 11,795 was selected, “rent” with BI: 477 and
“lease” with BI: 636 were removed), keywords without a continuous BI in a year resolution are also
removed. The retained of combined the combined keywords were ensured to be the most popular
and effective ones. Then, the correlations among them were tested to reduce data redundancy. The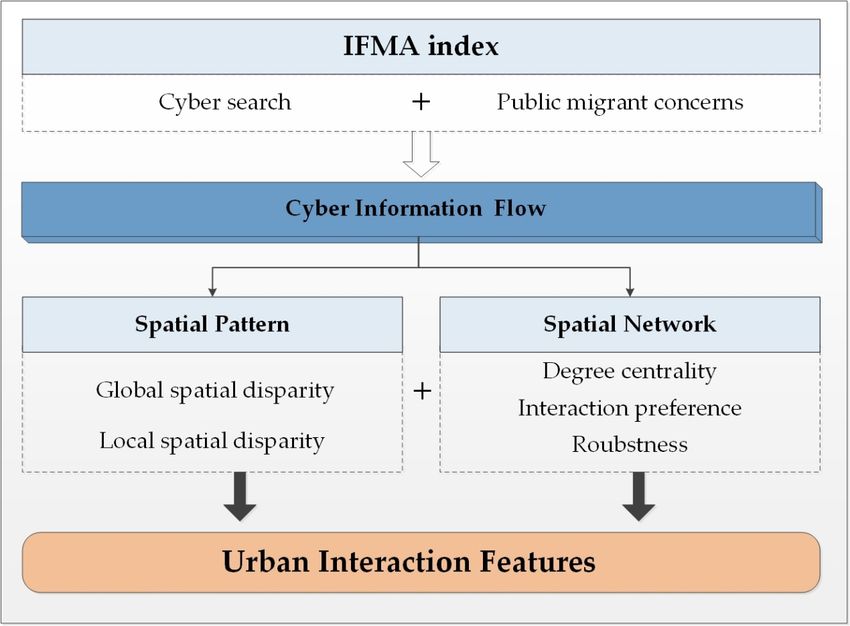
Int. J. Environ. Res. Public Health 2020, 17, 4235                                                                  7 of 20

during a specific duration of time, to identify the intercity information flow with distinct original and
terminal cities. (3) The sifting of keywords was conducted following the principle of maximum value
and continuity in time. The most popular keyword was chosen from a series of its similar words
(e.g., “house renting” with BI: 11,795 was selected, “rent” with BI: 477 and “lease” with BI: 636 were
removed), keywords without a continuous BI in a year resolution are also removed. The retained of
combined the combined keywords were ensured to be the most popular and effective ones. Then,
the correlations among them were tested to reduce data redundancy. The final qualified keywords
were confirmed as shown in Table 1. (4) Based on the qualified search keywords, the IFMA index
was constructed to comprehensively express the information flow triggered by migrant attention in
cyberspace. The formula can be seen in Equations (1) and (2).

                                                      3
                                                     XX
                                       IFMAi =                 Wijn × IFn /IFMAmax , i , j                             (1)
                                                     j=1 n=1

                                                       3
                                                       X
                                         IFMAij =           Wijn × IFn /IFMAmax , i , j                                (2)
                                                      n=1

where, IFMAi is the total amount of cyber migrant concerns that city i received from urban external
areas; IFMAij is the information flow triggered by migrant attention derived from city j to city i
in cyberspace; IFn is the average value of Baidu Index regarding different search keywords under
migration reason n; Wijn refers to the weights of IFn , which are defined by the proportion of people who
migrate into city i for this reason; and IFMAmax is the maximum absolute value of the IFMA indexes.

                                          Table 1. Selection of the search keywords.

                    Migrant Reason              Keywords in Chinese                      Translation in English
                    Work and trade                    招聘, 租房                           Recruitment, house renting
                  Study and training                     学校                                     School
                      Relocation                     房价, 地图, 天气                        House price, map, weather

3.2. Interaction Characteristic Analysis of Urban Area Based on the Cyber Information Flow

3.2.1. Spatial Pattern Characteristics
     To investigate the spatial distribution characteristics of IFMA, we introduced exploratory spatial
data analysis (ESDA) to visually describe the IFMAi of a single city in an effort to identify regional
problems. ESDA combined statistical analysis with geospatial information to explore the aggregation
and dispersion characteristics in geographical space [53]. In this paper, Moran’s I and local indicators
of spatial association (LISA) were utilized to analyze the spatial adjacency relationship and the spatial
pattern of regional units depicted by IFMAi . The global Moran’s I reflects the comprehensive situation
of the whole area [54], which can be used to express the holistic characteristic of the spatial pattern
presented by IFMAi . The formula of Moran’s I can be expressed as:
                                                                   n P
                                                                   P n
                                                                             wij (xi − x)
                                              1                    i=1 j=1
                                         I= n n                ×    n
                                                                                            ,i , j                     (3)
                                            P P                     P              2
                                                         wij              (xi − x) /n
                                               i=1 j=1              i=1

where, I is the regional Moran’s I index, xi is the observed IFMAi value of unit i; x is the average value
of IFMAi , and wij is the binary spatial weight matrix created based on the distance standard to reflect
the locational similarity between spatial objects.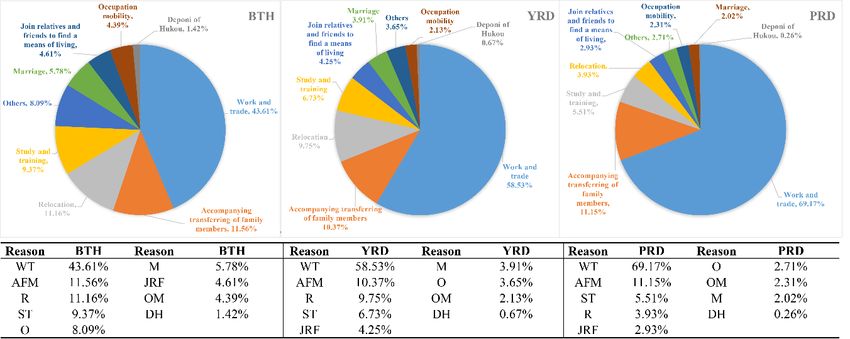
Int. J. Environ. Res. Public Health 2020, 17, 4235                                                   8 of 20

    LISA can further explore the spatial heterogeneity which exists in the partial area, it will offer
powerful help in confirming the high-impact areas in the specific region [55]. The formula of LISA is
shown as:
                                                  Xn
                                       LISAi = Zi     wij Z j                                      (4)
                                                              i=1

where, LISAi is the LISA index of spatial unit i, Zi , and Zj are the standardized results of objects i and
j’s observed IFMAi values.
      The Z test was employed to test the significance of Moran’s I and LISA. Critical values of 1.96 and
−1.96, which through the two-sided significance test in 95% confidence interval, were viewed as the
standard to judge the significance. The formula can be shown as follows:

                                                             1 − E(I )
                                                     Z(I ) = p                                          (5)
                                                               Var(I )

where, E(I) shows the expectation value of the objective index, and Var(I) is the variance of the
objective index.

3.2.2. Spatial Network Characteristic
      Based on the definition of the IFMA index, IFMAij is that index displays the information flow among
cities. It can be used to delineate the quantity of information flow among cities with different scales and
administrative levels, which also can indicate the derived and targeted direction of information flow.
In this paper, an urban interaction network triggered by cyber information flow was constructed based
on the IFMAij index. A sequence of networked indicators was employed to analyze the characteristics
of such networks.

(1)    The Construction of nIFMA

     To further delineate the spatial features of information flow, we constructed the spatial network of
IFMAij (nIFMA) to help express the interaction characteristics of networked cities. Urban nodes were
viewed as network nodes, and the information flow depicted by IFMAij between different cities was
viewed as network links. To eliminate the negative influence from spurious and statistically insignificant
links for analysis and visualization of the urban network, we adopted the global threshold method to
extract the major structure of nIFMA under the principle of no harm for urban network connectivity.
Two strategies were adopted to analyze and spatially explicit nIFMA: the geospatial location-based
approach and the graph theory-based approach. Therein, the geospatial location-based approach
expresses urban network based on the geospatial location of urban nodes, urban network can be
depicted comprehensively by coupling the networked information with the geographical distribution.
The graph theory-based approach was then implemented by adopting the Fruchterman-Reingold force
model [56], urban networks can be spatially explicated in a relatively symmetrical and balanced way.

(2)    Network Structure Analysis

     Network indexes from complex network analysis are effective tools to reflect the interaction
characteristics of a specific network. A series of network indicators were employed to explore the
features of nIFMA. From the network, node, and edge scales, eight network analysis indicators were
confirmed, including the degree, weighted degree, network diameter, graph density, number of nodes,
average clustering coefficient, number of edges, and average path length.
     Especially, the degree centrality of network nodes was estimated to analyze the interaction
role of each city in nIFMA. Regarding the directed property of the IFMAij network, two kinds of
centrality indexes were employed to delineate the urban network features in diverse directions:
In-degree centrality and out-degree centrality. Focused on the urban attractiveness for cyber attention,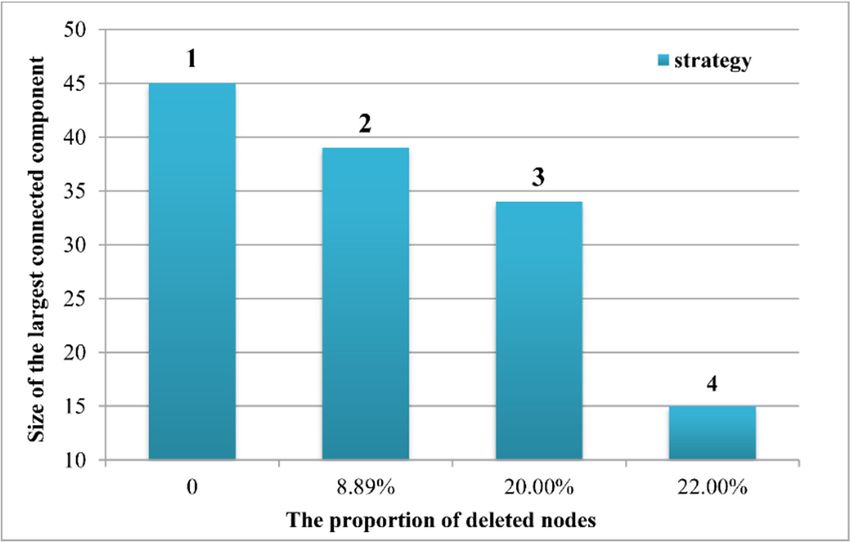
Int. J. Environ. Res. Public Health 2020, 17, 4235                                                      9 of 20

we adopted in-degree centrality to represent the urban positive influences for the inflow of information,
and the formula can be shown as follows:
                                                    X
                                             DI_i =     aij                                           (6)
                                                               j=n

where, DI_i is the in-degree centrality of city i, and aij is the number of network links that originate
from city j to target city i.
     Furthermore, the degree correlation was adopted to investigate the urban interaction preference
in nIFMA. It is the relationship between cities’ degree k and the average degree of the neighbors of all
k-degree nodes [57]. Cities with a high degree of centrality incline to interact with each other is referred
to as assortativity. Otherwise, cities with a high degree of centrality incline to interact with low-degree
nodes is referred to as disassortativity [58]. The average degree of each urban node can be defined as:

                                                               1X
                                                     k (i) =      kj                                       (7)
                                                               ki
                                                                j∈Ni

where k(i) is the average degree of Ni , ki and kj are the degree of city i and j respectively; and Ni is the
number of urban nodes that link with city i. The average degree of all k-degree nodes’ neighbors can
be defined as:
                                                       1 X
                                            K (k ) =         K (i)                                         (8)
                                                     N (k )
where N(k) is the number of urban nodes with the degree of k. The degree correlation is the relationship
between k and K(k).
      To effectively describe how the urban network reacts to external attacks [59], we evaluated the
robustness of nIFMA. The largest connected component size F, which was a fraction of the network
size, was used in quantitatively measuring the robustness of the urban network. Following different
urban nodes removal strategies, including the removal of none cities, national central cities, regional
central cities and others, the largest connected component size was measured to analyze the network
robustness and the urban roles in the urban network of cyber information flow.

4. Results

4.1. Size and Ranking of IFMAi
      The size and rank of the 38 cities’ IFMAi are depicted in Figure 4. It can be observed that
Beijing, Shanghai, and Shenzhen, which separately role as the predominant cities in their own urban
agglomerations, are the top three cites in attracting public migrant attention in cyberspace. Among all
38 cities, the values of the top 12 cities were higher than the average of the IFMAi indexes. Therein,
three cities (i.e., Beijing, Tianjin, and Shijiazhuang) located in the BTH (north China), six cities (i.e.,
Shanghai, Hangzhou, Nanjing, Suzhou, Ningbo, and Wuxi) located in the YRD (eastern China) and
another three cities(i.e., Shenzhen, Guangzhou, and Zhuhai) located in the PRD (south China).
      In the three urban agglomeration areas, two breakpoints could be separately found in their interior
domains. In the BTH, the first breakpoint lies between Beijing and Tianjin. The IFMAi of Beijing was
165.65% higher than that of Tianjin. Significant deviance can be observed to emphasize the predominant
role of Beijing in the BTH; in the YRD, a similar situation can be seen between Shanghai and the second
ladder cities (the IFMAi of Shanghai was 112.38% higher than that of Hangzhou), while a slightly
different pattern was exhibited in the PRD. Two break points partitioned Shenzhen, Guangdong and
other cities into three parts. The deviance between the first and second ladder (46.50%) was relatively
lower than that of the BTH and the YRD, and two leading cities were detected in the PRD.
      Comparing the urban size depicted by IFMAi with the urban roles classified by regional planning,
it can be seen that, the national and regional central cities conventionally displayed a relatively higher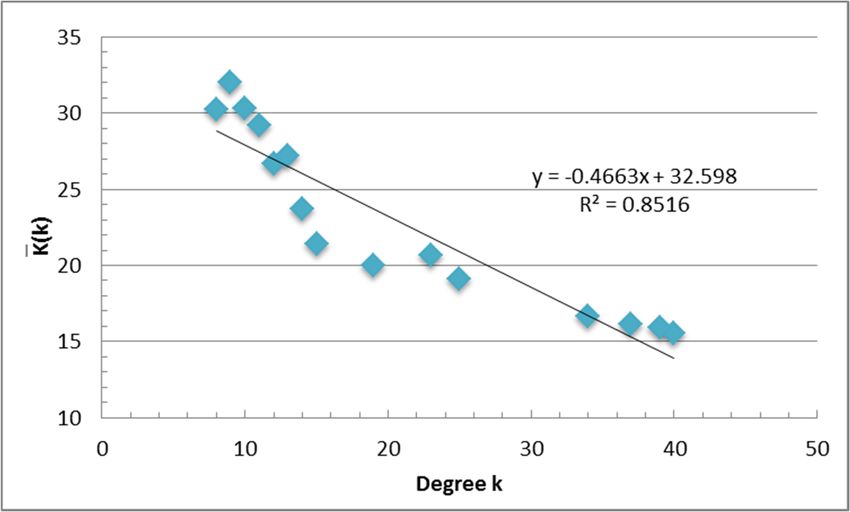
Int. J. Environ. Res. Public Health 2020, 17, 4235                                                                  10 of 20

interaction size in the study area. However, some incongruity was also observed. For the national
central cities, the interaction size of Tianjin and Guangzhou were obviously insufficient, their IFMAi
even lower than that of three regional central cities and one non-central city.
        For the regional central cities, the interaction sizes of Shijiazhuang and Ningbo were relatively
lower than the expected value of the regional planning. For the non-central cities, Suzhou and Zhuhai
deserve more attention. Especially the Suzhou City, its interaction size depicted by IFMAi , surpassed
the
Int. J.national   central
        Environ. Res. Publiccities—Guangzhou
                            Health 2020, 17, 4235 and Tianjin.                                    10 of 20

              4. Rank
      Figure 4.   Rankandandsize of IFMA
                              size       i . SH:
                                    of IFMA       Shanghai,
                                              i. SH: Shanghai,BJ: Beijing, SZ: Shenzhen,
                                                                   BJ: Beijing,            HZ: Hangzhou,
                                                                                 SZ: Shenzhen,            NJ: Nanjing,
                                                                                                  HZ: Hangzhou,    NJ:
      SZ(1): Suzhou,
      Nanjing,   SZ(1): GZ:  Guangzhou,
                        Suzhou,             TJ: Tianjin,TJ:
                                   GZ: Guangzhou,        ZH:   Zhuhai,
                                                            Tianjin,   ZH:SJZ: Shijiazhuang,
                                                                            Zhuhai,            NB: Ningbo,
                                                                                      SJZ: Shijiazhuang,   WX:
                                                                                                         NB:    Wuxi,
                                                                                                              Ningbo,
      DG:
      WX: Dongguan,      CZ: Changzhou,
            Wuxi, DG: Dongguan,              ZS(1): Zhongshan,
                                      CZ: Changzhou,                LF: Langfang,
                                                           ZS(1): Zhongshan,     LF:QHD:    Qinhuangdao,
                                                                                      Langfang,            FS: Foshan,
                                                                                                  QHD: Qinhuangdao,
      BD:  Baoding,
      FS: Foshan,    TS:Baoding,
                   BD:    Tangshan,TS:NT:  Nantong,
                                       Tangshan,      JX:Nantong,
                                                    NT:    Jiaxing, HZ(1):   Huizhou,
                                                                      JX: Jiaxing,      HD:
                                                                                   HZ(1):     Handan,
                                                                                           Huizhou,   XT:Handan,
                                                                                                     HD:  Xingtai, XT:
                                                                                                                   HS:
      Hengshui,   ZJK:  Zhangjiakou,   YZ:   Yangzhou,   SX:  Shaoxing,    TZ: Taizhou,  JM: Jiangmen,
      Xingtai, HS: Hengshui, ZJK: Zhangjiakou, YZ: Yangzhou, SX: Shaoxing, TZ: Taizhou, JM: Jiangmen,  TZ(1): Taizhou,
      ZJ: Zhenjiang,
      TZ(1): Taizhou,ZQ:ZJ:Zhaoqing,
                             Zhenjiang,CD:
                                         ZQ:Chengde,
                                                Zhaoqing,HZ(2):    Huzhou, ZS:
                                                             CD: Chengde,         Zhoushan,
                                                                               HZ(2):  Huzhou,CZ(1): Cangzhou. CZ(1):
                                                                                                 ZS: Zhoushan,
      Cangzhou.
4.2. Spatial Pattern of IFMAi
4.2. Spatial
4.2.1. GlobalPattern of Disparity
               Spatial  IFMAi

4.2.1.To analyze
       Global     the spatial
              Spatial         correlation of IFMAi , the Global Moran’s I of IFMAi in the BTH, the YRD,
                       Disparity
and the PRD were separately calculated; then the Z test was employed to test the significance of
      To analyze the spatial correlation of IFMAi, the Global Moran’s I of IFMAi in the BTH, the YRD,
Moran’s I. The results are shown in Table 2. Only the PRD with a Z-score of 4.86, which was lower
and the PRD were separately calculated; then the Z test was employed to test the significance of
than the critical value of the two sides test of normal distribution at 95% confidence interval (−1.96),
Moran’s I. The results are shown in Table 2. Only the PRD with a Z-score of 4.86, which was lower
had a significant Moran’s I index. This indicates that the IFMAi of the cities in the PRD had a clustered
than the critical value of the two sides test of normal distribution at 95% confidence interval (−1.96),
trend in geographical space, as shown in Figure 5. The cities with similar IFMAi characteristic incline
had a significant Moran’s I index. This indicates that the IFMAi of the cities in the PRD had a clustered
to represent aggregated distribution in the PRD.
trend in geographical space, as shown in Figure 5. The cities with similar IFMAi characteristic incline
to represent aggregated distribution in the PRD.

                           Table 2. Moran’s I of IFMAi in the different urban agglomerations.

   Area               Moran’s I                       E[I]        Sd               Z-Score                 p-Value
   BTH                  0.04                         −0.02       0.00                1.31                    0.19
   YRD                  0.04                         −0.03       0.01                0.70                    0.49
   PRD                  0.36                         −0.04       0.01                4.86                    0.00
      Note: BTH: the Beijing-Tianjin-105 Hebei metropolitan region; YRD: the Yangtze River Delta; PRD:
      the Pearl River Delta; Sd: standard deviation.
Int. J. Environ. Res. Public Health 2020, 17, 4235 11 of 20
Table 2. Moran’s I of IFMAi in the different urban agglomerations.
Area Moran’s I E[I] Sd Z-Score p-Value
BTH 0.04 −0.02 0.00 1.31 0.19
YRD 0.04 −0.03 0.01 0.70 0.49
PRD 0.36 −0.04 0.01 4.86 0.00
Int.J.J.Environ.
Int. Environ.Res.
Res.Public
PublicHealth
Health2020,
2020,17,
17,4235
4235 11ofof20
11 20
Note: BTH: the Beijing-Tianjin-105 Hebei metropolitan region; YRD: the Yangtze River Delta; PRD: the Pearl River
Delta; Sd: standard deviation.
Figure 5. The distribution pattern of IFMAi in the different urban agglomerations.
Figure5.5.The
Figure Thedistribution
distributionpattern
patternofofIFMA
IFMAi in
i inthe
thedifferent
differenturban
urbanagglomerations.
agglomerations.
4.2.2. Local Spatial Disparity
4.2.2.Local
4.2.2. LocalSpatial
SpatialDisparity
Disparity
To further explore the spatial association patterns in local areas, we analyzed the LISA index of
IFMA To
To further
i and
further explore
tested thespatial
their the
explore spatialassociation
significance association patterns
in an extensional ininlocal
spatial
patterns local areas,
scope. The
areas, we
we analyzed
results were
analyzed the LISAindex
spatially
the LISA indexofof
explicit
IFMAi iand
expressed
IFMA andtested
tested
in their
Figure significanceininan
6. significance
their anextensional
extensionalspatial
spatialscope.
scope.The
Theresults
resultswere
werespatially
spatiallyexplicit
explicit
expressedininFigure
expressed Figure6.6.
Figure 6.6.6.The
Figure locallocal
The
The indicators
local of spatial
indicators
indicators association
ofof (LISA) of IFMA
spatial association
spatial association i in the of
(LISA)
(LISA) different
of IFMA
IFMAurban inagglomerations.
i i in the different
the different
urban agglomerations.
urban agglomerations.
Mostofofthe
Most thecities
citiesdid
didnot
nothave
haveaasignificant
significantspatial
spatialcorrelation
correlationlocally,
locally,except
exceptfor
forthe
theeast
eastofofBTH
BTH
(i.e.,Beijing
(i.e., Beijingand
andTianjin),
Tianjin),the
theeast
eastofofYRD
YRD(i.e.,
(i.e.,Shanghai
ShanghaiandandSuzhou)
Suzhou)andandthe
thesouth
southofofPRD
PRD(i.e.,
(i.e.,
Guangzhou and Shenzhen). The type of spatial correlation patterns in the study area
Guangzhou and Shenzhen). The type of spatial correlation patterns in the study area were mainly were mainly
High-Highclusters,
High-High clusters,which
whichdemonstrated
demonstratedthatthatthe
thespatial
spatialconcentration
concentrationwas
wasmainly
mainlyobserved
observedamong
amongInt. J. Environ. Res. Public Health 2020, 17, 4235 12 of 20
Int. J. Environ. Res. Public Health 2020, 17, 4235 12 of 20
a largeMostnumber of the
of cities did not
resources werehave a significant
gathered in thesespatial
two correlation locally,
cities; the same except for
situation wasthe east of BTH
observed in
(i.e., Beijing and Tianjin), the east of YRD (i.e., Shanghai and Suzhou)
PRD, where Guangzhou and Shenzhen are separately the national central city and the regional and the south of PRD (i.e.,
Guangzhou
central and Shenzhen).
city, similarly gathered The withtype of spatial
enormous correlation
regional patterns
resources; in YRD,
in the the study area were
although Suzhou mainly
is
High-High clusters, which demonstrated that the spatial concentration was mainly
not the central city assigned by the national plan, it has a substantial population and economic scales, observed among
the larger
even cities with a high
than the IFMAi . capital
provincial The spatial location
of Jiangsu of the cluster cities coincided with the areas with
Province—Nanjing.
significant spatial correlations. For individual cities, the High-High cluster cities all had noticeable
influences
4.3. in the region.
Spatial Network AnalysisInofthe BTH, Beijing and Tianjin were the only two national central cities, and a
nIFMA
large number of resources were gathered in these two cities; the same situation was observed in PRD,
whereWe Guangzhou
constructed and the network
Shenzhenofare IFMA ij (nIFMA), the 38 cities and the cities most interested for
separately the national central city and the regional central city,
them in the top 10 have been viewed as
similarly gathered with enormous regional resources; nodes in the network. In addition
in the YRD, althoughtoSuzhou
the 38 is
cities, another
not the central
seven cities were selected, including Jinan, Zhengzhou, Wuhan, Changsha, Chengdu,
city assigned by the national plan, it has a substantial population and economic scales, even larger Wenzhou, and
Jinhua. The cyber information flows of public
than the provincial capital of Jiangsu Province—Nanjing. migrant attention between the different cities were
viewed as links. There were 342 links have been finally built in the network. The Baidu Index of the
given
4.3. migration keywords
Spatial Network andofthe
Analysis city’s name was collected to calculate the IFMAij. The IFMAij from
nIFMA
city j to city i was defined as the weight of linkij. Based on the geographical location of each city, we
We constructed the network of IFMAij (nIFMA), the 38 cities and the cities most interested for
expressed the network in a spatially explicit way. Simultaneously, the Fruchterman-Reingold force
them in the top 10 have been viewed as nodes in the network. In addition to the 38 cities, another seven
model was employed to establish the network from the perspective of graph theory, as shown in
cities were selected, including Jinan, Zhengzhou, Wuhan, Changsha, Chengdu, Wenzhou, and Jinhua.
Figure 7. Under the assistance of complex network analysis, the main measured indexes of the whole
The cyber information flows of public migrant attention between the different cities were viewed
network were obtained as demonstrated in Table 3.
as links. There were 342 links have been finally built in the network. The Baidu Index of the given
migration keywords and the city’s name was collected to calculate the IFMAij . The IFMAij from
Table 3. The network indexes of the spatial network of IFMAij (nIFMA).
city j to city i was defined as the weight of linkij . Based on the geographical location of each city,
we expressedNetwork the network in a spatially explicit way. NodeSimultaneously, the Fruchterman-Reingold
Edge force
Degree 15.111 Number of nodes 45 Number of edges 342
model was employed to establish
Weighted degree 7.556
the network from the perspective
Average clustering coefficient 0.497
of graph theory, as1.642
Average path length
shown in
Figure 7. Under
Network diameter the assistance3 of complex network analysis, the main measured indexes of the whole
network were obtained as demonstrated in Table 3.
Graph density 0.172
Figure 7. The network of IFMA .
Figure 7. The network of IFMAij. ij
A random network of the same size was constructed for comparison. The average clustering
coefficient and the average path length of the random network were separately 0.178 and 2.06,
respectively. A higher clustering coefficient and a shorter path length depicted the small-world
features of nIFMA. Though the combination of the two types of networks, we can see that the network
can be distinctly divided into three parts. Except for a small number of cities located in the middle of
the network, most cities paid more attention to the internal cities of its attached agglomeration. ForInt. J. Environ. Res. Public Health 2020, 17, 4235 13 of 20
Table 3. The network indexes of the spatial network of IFMAij (nIFMA).
Network Node Edge
Degree 15.111 Number of nodes 45 Number of edges 342
Weighted degree 7.556 Average clustering coefficient 0.497 Average path length 1.642
Network diameter 3
Graph density 0.172
A random network of the same size was constructed for comparison. The average clustering
coefficient and the average path length of the random network were separately 0.178 and 2.06,
respectively. A higher clustering coefficient and a shorter path length depicted the small-world features
of nIFMA. Though the combination of the two types of networks, we can see that the network can
be distinctly divided into three parts. Except for a small number of cities located in the middle
of the network, most cities paid more attention to the internal cities of its attached agglomeration.
For example, Shijiazhuang, which is located in the BTH, was more likely to concern the cities located in
the BTH than the other two urban agglomerations; Zhongshan, which is located in the PRD, more likely
to concern the cities located in the PRD. A lack of interregional migrant attention was observed in most
objective cities. The noticeable role of geographical distance in affecting individuals’ migrant attention
could be revealed from such spatial network pattern.
Beijing, Shanghai and Shenzhen occupied the core state in the network, which could be delineated
as the hubs of the network. Their prominent role in obtaining the influx of cyber information can be
further displayed. In the periphery, they were separately followed by Tianjin in the BTH, Suzhou,
Nanjing and Hangzhou in the YRD and Guangdong in the PRD. Stronger support from other cities for
the predominant city was depicted in the YRD. It is noteworthy that Shijiazhuang, as a regional central
city in the BTH area, had an obvious marginalized location in the network compared to other regional
central cities, even more marginalized than the regional regular cities. This highlights that the network
function of Shijiazhuang, whose role of a regional center, was not well demonstrated.
4.3.1. Degree Centrality of Cities
Based on Equation (6), we calculated the in-degree centrality of each city, and the results are
spatially expressed in Figure 8. Beijing, Shanghai, and Shenzhen had the highest in-degree centrality
in the network, which implies that they were the most concerned cities in nIFMA. There were 10 cities
with an in-degree centrality higher than the average value: Beijing, Shenzhen, Shanghai, Guangzhou,
Hangzhou, Suzhou, Tianjin, Wuhan, Nanjing, and Shijiazhuang. We further analyzed the characteristics
of these 10 cities and found that they also had the population scales larger than the average of the 38
cities, and they were listed in the top 30% of the population scale rank. Their economic scales were also
ranked in the forefront. Except for Shijiazhuang, all the nine cities with GDP larger than the average
value and ranked in the top 24% of all cities. Considering the hierarchy of these cities, which released
by Nationwide Urban System Planning of China 2006–2020 (the planning generally states the specific
function of cities based on their composite influence in the urban system of China), there were four
national central cities and five regional central cities. A relatively higher attractiveness of the central
cities was displayed compared to the regular cities. The degree centrality characteristics depicted by
IFMAij essentially matched the situation of the urban population, the economic and urban status in
regional planning.of these cities, which released by Nationwide Urban System Planning of China 2006–2020 (the
planning generally states the specific function of cities based on their composite influence in the
urban system of China), there were four national central cities and five regional central cities. A
relatively higher attractiveness of the central cities was displayed compared to the regular cities. The
degree centrality characteristics depicted by IFMAij essentially matched the situation of the urban
Int. J. Environ. Res. Public Health 2020, 17, 4235 14 of 20
population, the economic and urban status in regional planning.
Figure8.8.Spatial
Figure Spatial distribution of urban
distribution of urbanin-degree
in-degreeofofcentrality.
centrality.
Int. J. Environ. Res. Public Health 2020, 17, 4235 14 of 20
4.3.2. Interaction Preference of Cities
4.3.2. Interaction Preference of Cities
To investigate the interaction preference of the objective cities, based on Equations (7) and
(8), weTocalculated
investigatedegree
the interaction preference
correlation of nIFMAof the as
objective
−0.4663,cities, basedfollows
which on Equations
a linear(7) and (8),
function:
we calculated degree correlation of nIFMA as −0.4663, which follows
y = −0.4663x + 32.598 (R2 = 0.8516), as shown in Figure 9. The results delineate the disassortativity a linear function:
y = −0.4663x + 32.598 (R2 = 0.8516), as shown in Figure 9. The results delineate the disassortativity in
in the degree correlation. The higher the degree of centrality the node owns, the lower the average
the degree correlation. The higher the degree of centrality the node owns, the lower the average
degree owned by its neighbors. For instance, Beijing had the highest degree of 40 and the lowest
degree owned by its neighbors. For instance, Beijing had the highest degree of 40 and the lowest
neighbors’ average degree of 15.55. Shenzhen and Shanghai had the second highest degrees of
neighbors’ average degree of 15.55. Shenzhen and Shanghai had the second highest degrees of 39,
39, with the neighbors’ average degrees of 15.90 and 15.92, respectively. Among the low-degree
with the neighbors’ average degrees of 15.90 and 15.92, respectively. Among the low-degree cities,
cities, the cities with a degree of 9 had the highest K(k) as 32.02, and the cities with degrees of
the cities with a degree of 9 had the highest ⎯K(k) as 32.02, and the cities with degrees of 10 and 8
10 ranked
and 8 ranked
the secondthe and
second
thirdand third⎯K(k).
highest highest
TheK(k). The disassortativity
disassortativity in the cities
in the low degree low degree cities
was more
was more considerable,
considerable, when k ≤when k ≤ 15,
15, with y =with y = −1.1715x
−1.1715x + 41.383 +(R2
41.383 (R2 = and
= 0.8167); 0.8167);
when andthewhen k ≥ 15,
the with
k ≥ 15,
with = −0.2395x + =
y = −0.2395x + 25.123 (R2 = 0.9605). The results show that the low-degree cities preferred the high-the
y 25.123 (R2 0.9605). The results show that the low-degree cities preferred
high-degree
degree citiescities more
more than
than thethe preference
preference of of high-degree
high-degree cities
cities forfor low-degree
low-degree cities.
cities. ForForthethe individual
individual
cities, thethe
cities, national
nationalandandregional
regionalcentral
centralcities
citieshad
hadaarelatively
relativelylower ⎯K(k).The
lower K(k). Thehigher
higherattractiveness
attractiveness of
these citiescities
of these for regional regular
for regional cities
regular cancan
cities thus be be
thus delineated.
delineated.
Figure9.9. The
Figure The degree correlation
correlationof
ofnIFMA.
nIFMA.
4.3.3. Robustness of the Interaction Network
To test the robustness of the interaction network and to evaluate the network dependence on
specific nodes, we calculated the largest connected component size of the network under different
removal strategies. Referring to the definition of the different types of cities in the Nationwide UrbanYou can also read