Factors affecting the occurrence and activity of clouded leopards, common leopards and leopard cats in the Himalayas
←
→
Page content transcription
If your browser does not render page correctly, please read the page content below
Biodiversity and Conservation
https://doi.org/10.1007/s10531-019-01912-7
ORIGINAL PAPER
Factors affecting the occurrence and activity of clouded
leopards, common leopards and leopard cats
in the Himalayas
Özgün Emre Can, et al. [full author details at the end of the article]
Received: 19 March 2018 / Revised: 31 July 2019 / Accepted: 20 November 2019
© The Author(s) 2019
Abstract
Clouded leopards are one of the least known of larger felids and were believed to be extinct
in Nepal until 1987. They are particularly interesting because their Asian range spans a
diversity of habitats in the fastest disappearing forests in the world and encompasses a
guild which differs in composition from place to place. As a part of a wider camera-trap-
ping study of this guild, involving 2948 camera traps at 45 sites in nine countries, and par-
alleling a similar study of the Sunda clouded leopard including a further 1544 camera traps
spanning 22 sites distributed across two countries, we deployed 84 pairs of camera traps
for 107 days in 2014 and 2015 at Langtang National Park, Nepal between 1823 and 3824 m
a.s.l. within a grid encompassing c. 120 km2. We documented the presence of clouded
leopards for the first time at an altitude as high as 3498 m a.s.l. Naïve occupancy for
clouded leopard was 8.6% (correcting for detection, 10.1%). Clouded leopards were least
active in the middle of the day, and largely crepuscular and nocturnal, as were the com-
mon leopards and leopard cats. The peak of clouded leopard activity overlapped with that
of musk deer. Prey species for both clouded leopard and common leopard were available
across the elevation range studied although the availability of some prey species declined
as elevation increased, whereas Himalayan serow, Himalayan goral, and musk deer showed
no association with elevation. Before this study, there was no hard evidence that clouded
leopards occurred above 2300 m a.s.l., having documented them at almost 4000 m a.s.l. in
the Himalayas, we emphasise the importance of this extreme portion of the species’ range
where climate is likely to change more rapidly and with greater consequences, than the
global average. The discovery of clouded leopards in Langtang National Park consider-
ably extends their known range, and raises the possibility that they occur from the Terai
in southern Nepal up to the Nepal-Tibet (China) border in the north. Insofar as this study
has extended the known extreme boundary of the clouded leopard’s geographic range to
encompass Langtang National Park in the Nepali Himalayas.
Keywords Clouded leopard · Common leopard · Leopard cat · Jungle cat · Camera traps ·
Himalayas · Nepal
Communicated by David Hawksworth.
Electronic supplementary material The online version of this article (https://doi.org/10.1007/s1053
1-019-01912-7) contains supplementary material, which is available to authorized users.
13
Vol.:(0123456789)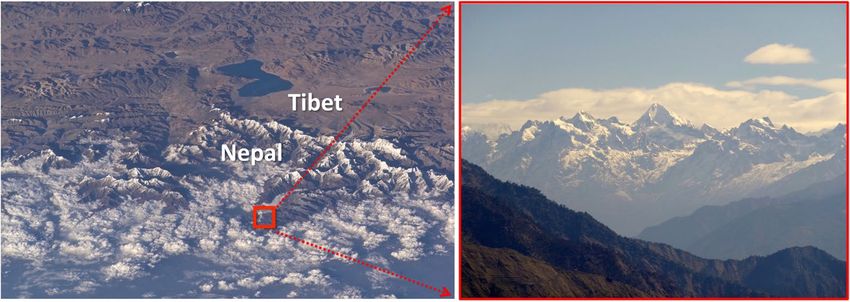
Biodiversity and Conservation Fig. 1 Views of the study site as seen from the International Space Station (photograph on the left, source: NASA) and from the ground (photograph on the right, by Özgün Emre Can) Introduction The edges of species distributions are often determined by tolerances to environmental extremes (e.g., tolerance to cold or aridity) (Easterling et al. 2000). The mainland clouded leopard, Neofelis nebulosa has not hitherto been recorded above 2300 m a.s.l., elevations achieved at the western extent of its geographic range in Nepal (Dinerstein and Mehta 1989; Ghimirey and Acharya 2018). Clouded leopards are amongst the least known of larger felids, and are particularly interesting because their expansive Asian range spans a diversity of habitats and encompasses a guild, differing in composition from place to place, of up to nine different felids, living in the fastest disappearing forests in the world (Miettinen et al. 2011). Before this study, there was no hard evidence that clouded leop- ards occurred above 2300 m a.s.l. Having now documented them at almost 4000 m a.s.l. in the Himalayas, we emphasise the importance of this extreme portion of the species’ range where climate is likely to change more rapidly and with greater consequences, than the global average (Loarie et al. 2009; Sharma et al. 2009). The mean annual temperature is projected to increase on average by 2.9 °C in just 33 years and up to 4.3 °C in 83 years (Sharma et al. 2009). Climate change affects the distributions and interactions of species with ecosystem scale consequences (e.g. Hersteinsson and Macdonald 1992; Lovari et al. 2013; Elsen and Tingley 2015), which, especially in the case of top predators, are likely to have cascading effects (Ripple et al. 2014; Sandom et al. 2017). This study is part of a wider, camera-trapping study of this guild, involving 2948 camera traps at 45 sites in nine countries (Macdonald et al. in review), and paralleling a similar study of the Sunda clouded leopard, Neofelis diardi, including a further 1544 camera traps spanning 22 sites distrib- uted across two countries (Macdonald et al. in prep.). Insofar as this study has extended the known extreme boundary of the clouded leopard’s geographic range to encompass Lang- tang National Park, we thereby identify an ideal place to examine the interaction between intra-guild competition and prey availability in extreme environmental conditions. In 1976 Langtang National Park became the first protected area in the Nepali Hima- layas (Fig. 1), covering a core area of 1710 km2 with a 420 km2 buffer zone along the Nepal–China border (DNPWC 2017), and coinciding with an international illegal wildlife trade route (BBC 2008; WWF 2013) (For detailed information on the park, reader can refer to: http://www.langtangnationalpark.gov.np/index.php/component/content/article/2-uncat egorised/11-langatang-description). Clouded leopards were even believed to be extinct in 13
Biodiversity and Conservation

Nepal until 1987 (Dinerstein and Mehta 1989). Our attention was attracted to Langtang
National Park by rumours of a clouded leopard sighting in the late 1970s in the park (Bor-
radaile et al. 1977; Green 1981).
    The presence of other guild members is likely to affect the ecology of clouded leop-
ards and thus inter-specific competition. Intra-guild hostility is commonplace amongst the
Carnivora, and specifically amongst sympatric felids (Palomares and Caro 1999; Donadio
and Buskirk 2006; Macdonald et al. 2010). Felids both larger and smaller than clouded
leopards occur at Langtang National Park, namely common leopards (they are larger than
clouded leopards), Panthera pardus, and leopard cats, Prionailurus bengalensis, and jun-
gle cats, Felis chaus. Therefore while seeking the presence of clouded leopards, with the
aim of identifying corollaries of their distribution, we report similar information for these
two sympatric species. The major goals of our study were to identify the predictors of
felid presence (in terms of prey and environmental variables), and to explore daily activ-
ity patterns in order to shed light on possible intra-guild interactions among the three felid
species.

Methods

Between December 2014 and February 2015, we established 84 camera trap stations at
Langtang National Park, Nepal (Fig. 1). Each station comprised a pair of camera traps
placed facing each other (Cuddeback Attack IR). The stations were between 1823 and
3824 m a.s.l. and within a grid encompassing c. 120 km2 as calculated from Google Earth.
Each station was placed on animal trails and paths where possible. The distance between
stations varied between 0.5 and 1.5 km. The stations were configured in a grid pattern fol-
lowing protocols established in our broader study (e.g. Hearn et al. 2016, 2017; Naing et al.
2017; Singh and Macdonald 2017; Tan et al. 2017), and their locations were logged using
hand-held GPS units. Cameras, with the exception of those temporarily inaccessible dur-
ing extreme weather, were checked weekly to replace batteries and download images. We
excluded data derived from cameras not functioning properly (due to for example camera
failure, battery failure and heavy snow fall). The number of camera stations used was 81,
following the removal of three stations for these reasons. The survey duration was 107 days
generating 6591 camera trap days in total (a single trap day is a day when at least one cam-
era was functioning at a station).
    To investigate covariates potentially associated with habitat use, we used R software
(R Core Team (2017), and specifically the package ‘unmarked’ for occupancy analysis
(Fiske and Chandler 2011), allowing for imperfect detection (Kéry and Royle 2015). For
each camera station, we created detection histories for the three felid predators (1 for
detected, 0 for not detected). The data were collapsed into intervals of different lengths
of multiple-day sampling occasions. Models were fitted for intervals of 7, 10, 12, 15
and 20 days. Tests of the goodness of fit of models showed that 20 day occasions gave
the best fit using the c-hat (ĉ) statistic based on the frequency of different detection pat-
terns (MacKenzie and Bailey 2004); c-hat values were no higher than 1.2 for any model
using this interval. Goodness of fit tests were applied with the randomisation proce-
dure executed with the mb.gof.test command of the AICcmodavg package (Mazerolle
2017). There was no evidence that outputs were, over the range explored, sensitive to
the length of sampling occasion. This gave capture history matrices with a maximum
of six occasions (for those stations where at least one camera was functioning on all

                                                                                  13
Biodiversity and Conservation
six occasions). The number of days when at least one camera was functioning during
each occasion was used as an observation-level covariate in all models. The R package
camtrapR (Niedballa et al. 2017) was used to create both detection histories and camera
operation matrices.
Global models for each felid were defined by identifying a suite of plausible predic-
tors using a priori biological criteria, as recommended by Anderson (2008), and avoid-
ing the deprecated ‘all possible models approach’. The response variable of interest in
all occupancy models was the probability that the habitat associated with a camera sta-
tion was used by any individual of the species concerned. The predictor variables in the
model were metrics of prey availability, human activity and altitude. For the clouded
leopard, we considered five categories of putative prey: (i) red muntjac (Muntiacus vag-
inalis), (ii) wild boar (Sus scrofa), (iii) other ungulates (Himalayan serow (Capricornis
thar), Himalayan goral (Naemorhedus goral) musk deer (Moschus chrysogaster)), (iv)
primates (Nepal grey langur (Semnopithecus schistaceus) and Assam macaque (Macaca
assamensis)), and (v) the Malayan porcupine (Hystrix brachyura) and medium-sized
ground-dwelling birds. When grouping the prey species into classes, we considered the
average weight of each species and the number of camera trap records for each species.
Of these, categories i–iv were used for the common leopard. The likely prey of leopard
cat, small rodents, were not detected by our camera traps. For each prey category, and
for signs of humans (people or domestic stock), an index was calculated as the percent-
age of days a camera station was operating where any images of that category were
recorded. Elevation was included as an additional covariate. Prevalence of the larger
cats (common leopard and clouded leopard), i.e. the proportion of days at each station
where either species was recorded, was used as a plausible effect on the activity of the
leopard cat. All predictors were standardised. Moderate levels of intercorrelation were
observed (Supplementary Material Table 1); in particular, several prey species tended to
be more prevalent at lower elevations. Campbell (2000) observed that the reserve was
originally planned to be as free as possible from human interference, but that restric-
tions on human use may not be rigidly enforced. We therefore included an index of
human activity in our models as a possible influence on felid behaviour.
The best-supported model was identified by selecting the model with the lowest AICc
value and highest model weights (Anderson 2008) where higher model weights indicate a
better fit of the model to the data, taking account of parsimony and the number of param-
eter estimates included. Where no model was dominant, a model was selected if it was
a nested version of a more complex model which did not differ by more than 2.0 AICc
units, the ‘pretending variable’ issue (Richards 2005), or where the confidence intervals for
parameter estimates for additional terms in the more complex model clearly included zero
(Anderson 2008). The R package MuMin (Barton 2016) was used to calculate AICc values
and model weights for all models nested in the global occupancy model. Interaction terms
were not considered, and the effect of sampling effort (camera operation) was included as
part of the detection function in all models.
Activity patterns were explored using kernel density estimation for the diel pattern in
image records as applied with the activityDensity command of the camtrapR package
(Niedballa et al. 2017). This fits an activity curve as a function of the frequency of images
at different times of day. Overlaps in felid activity were calculated using the method of
Ridout and Linkie (2009) applied with the activityOverlap command in the same package.
The coefficient of overlap is denoted by “Dhat1” values, ranging between zero (no over-
lap) and 1.0 (complete overlap). Relationships between prey species and elevation were
explored with normal errors polynomial models.
13Biodiversity and Conservation
Results
Discovery of clouded leopards in Langtang National Park
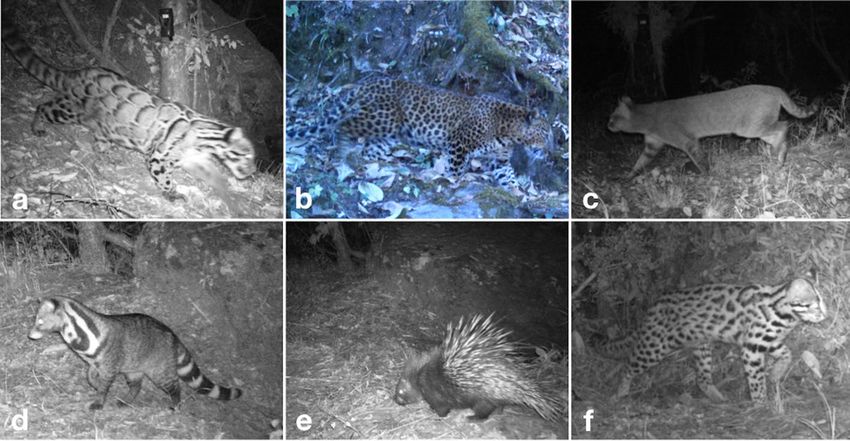
From the 21 images that featured clouded leopards, we documented the presence of three
different clouded leopards (Fig. 2), of which the highest was photographed at 3498 m a.s.l.
The highest elevation leopard cat was detected at 3824 m a.s.l. We also documented jungle
cat (Felis chaus), large Indian civet (Viverra zibetha), and Malayan porcupine (Fig. 2).
Predicted habitat use of clouded leopard, common leopard and leopard cat
Detections varied substantially among the three felid species. Naïve occupancy (the pro-
portion of sites where at least one detection was recorded) for clouded leopard was 8.6%
(correcting for detection, 10.1%), and for common leopard 23.5% (correcting for detection,
32.1%). For leopard cat, naïve detection was 45.7%, and 50.6% correcting for detection.
Investigating the influence of environment, prey, and intra-guild competition on clouded
leopards, we found only weak evidence for any effect of the potential predictors of habitat
use. The null model (the model including only an intercept term, and no covariates) had the
lowest AICc value, (Supplementary Material Table 2), which is unsurprising given that the
species was detected at few sites.
The best model for common leopard habitat use included a single, significant predic-
tor variable: muntjac prevalence. Habitat use was higher where muntjac were more preva-
lent (Fig. 3a, parameter estimate = 8.43, SE = 4.36, P = 0.053). For the leopard cat, the best
model included the other two cats and human activity. Leopard cat habitat use was highest
where the other cat species and humans were the most prevalent (Fig. 3 b, d, parameter
estimates 1.23 SE = 0.60, P = 0.04 and 1.38, SE = 0.72, P = 0.04, respectively).
Fig. 2 Selected camera trap images of clouded leopard (a), common leopard (b), jungle cat (c), large Indian
civet (d), Malayan porcupine (e) and leopard cat (f) documented by the camera trapping survey in Langtang
National Park, Nepal
13Biodiversity and Conservation Fig. 3 Predicted habitat use of common leopard (a), leopard cat (b and d) and clouded leopard (c) in Lang- tang National Park, Nepal Prey species Prey species for both clouded and common leopard were available across the study area. The naïve occupancy estimates for potential prey species were: red munt- jac—74.1% (2762 individual images); wild boar—44.4% (245 individual images); Himalayan Serow—28.4% (80 individual images); Himalayan Goral 19.8% (127 indi- vidual images); musk deer 28.3% (81 individual images); Nepal grey langur 51.9% (1847 individual images); Assam macaque 11.1% (165 individual images); Malayan porcupine 38.3% (220 individual images). But whereas the availability of some prey species declined as elevation increased (Fig. 4), others (Himalayan serow, Himalayan goral, and musk deer) showed no association with elevation. 13
Biodiversity and Conservation

Fig. 4  The relationship between abundance and elevation for potential clouded leopard prey (lines fitted
with GAM option of R ggplot2, P values are for quadratic term in normal errors model)

Activity patterns of clouded leopard, common leopard and leopard cat

While the overall activity patterns were similar, we observed some evidence for par-
titioning in patterns of activity among the three felid species. Common leopards were
active throughout the day and night, with decreased activity between mid morning and
early afternoon. In contrast, clouded leopards were active between early evening (7 pm)
and 5 am (Fig. 5a and b). Leopard cats were most active during the evening and early
in the night (Fig. 5c). While both clouded leopards and leopard cats were more active
in mid to late evening when common leopards were least active (Fig. 5d and e), leopard
cats were more active than clouded leopards (and common leopards) in late evening
(Fig. 5f). The overlap of activity between common and clouded leopards was similar
(Dhat1 value is 0.82) to that observed between leopard cats and clouded leopards (Dhat1
value is 0.79), both were higher than that between leopard cats and common leopards
(Dhat1 value is 0.67) (Fig. 5d–f). When human activity is higher than a density value of

                                                                                            13
Biodiversity and Conservation
(a) Activity of COL (b) Activity of CL (c) Activity of LC
number of records: 71 number of records: 21 number of records: 170
0.08
0.08
0.08
0.06
0.06
0.06
Density
Density
Density
0.04
0.04
0.04
0.02
0.02
0.02
0.00
0.00
0.00
0:00 6:00 12:00 18:00 24:00 0:00 6:00 12:00 18:00 24:00 0:00 6:00 12:00 18:00 24:00
Time Time Time
(d) : COL − CL (e) : LC − COL (f) : LC − CL
number of records: 71 / 21 number of records: 170 / 71 number of records: 170 / 21
0.08
Dhat1=0.82 Dhat1=0.67 Dhat1=0.79
COL LC LC
CL COL CL
0.08
0.08
0.06
0.06
0.06
Density
Density
Density
0.04
0.04
0.04
0.02
0.02
0.02
0.00
0.00
0.00
0:00 6:00 12:00 18:00 24:00 0:00 6:00 12:00 18:00 24:00 0:00 6:00 12:00 18:00 24:00
Time Time Time
(g) : HOMO − COL
(h) : HOMO − CL (i) : HOMO − LC
number of records: 5587 / 21 number of records: 5587 / 170
number of records: 5587 / 71
Dhat1=0.19
Dhat1=0.29 HOMO HOMO Dhat1=0.1
HOMO
CL LC
COL
0.12
0.12
0.12
Density
Density
Density
0.08
0.08
0.08
0.04
0.04
0.04
0.00
0.00
0.00
0:00 6:00 12:00 18:00 24:00 0:00 6:00 12:00 18:00 24:00
0:00 6:00 12:00 18:00 24:00
Time Time Time
Fig. 5 Activity patterns of common leopard (a), clouded leopard (b), leopard cat (c); overlap in the activity
patterns of the three species (d); common leopard vs. clouded leopard (e); leopard cat vs. common leopard
(f); leopard cat vs. common leopard), and human activity versus common leopard (g), common leopard (h),
and leopard cat (i)
0.04, the activity of both common and clouded leopards show low points (Fig. 5g and
h), whereas that of leopard cats is lowest when human activity is below 0.02 (Fig. 5g–i).
Activity patterns of potential principal prey species of clouded leopard
and common leopard
Clouded leopard activity (Fig. 5b) overlapped with that of musk deer (Fig. 6c,
Dhat1 = 0.76) and much less with that of red muntjac (Fig. 6e, Dhat1 = 0.43), Nepal
grey langur (Fig. 6f, Dhat1 = 0.17), Assam macaque (Fig. 6g, Dhat1 = 0.09) and
medium sized ground birds (Fig. 6i, Dhat1 = 0.25). Common leopard activity (Fig. 5a)
overlapped with that of wild boar (Fig. 6d, Dhat1 = 0.51), musk deer (Fig. 6c,
Dhat1 = 0.71) and with red muntjac (Fig. 6e, Dhat1 = 0.54). While the peak of common
leopard activity was clearly distinct from that of both Himalayan serow and Himalayan
goral, overall overlap was high (Fig. 6a, Dhat1 = 0.74; Fig. 6b, Dhat1 = 0.62). Nepal
13Biodiversity and Conservation
Fig. 6 Activity patterns of the potential principal prey species for clouded and common leopard: Himalayan
serow (a), Himalayan goral (b), musk deer (c), wild boar (d), red muntjac (e), Nepal grey langur (f), Assam
macaque (g), Malayan porcupine (h), and medium sized ground birds (i)
grey langur (Fig. 6f) and Assam macaque (Fig. 6g) were most active between early
morning and late afternoon when common leopards (Fig. 5a) were least active (Dhat1
values of 0.27 and 0.15 respectively).
Medium-sized ground birds (Fig. 6i) were most active between 6 am and 6 pm when
leopard cat (Fig. 5c) were less active (Dhat1 = 0.11). While the peak activity times of
Himalayan goral (Fig. 6b) and Himalayan serow (Fig. 6a) were distinct, they were also
active to some degree around the clock, and at the same time outside of peak activity
(Dhat = 0.7). Similarly, Himalayan goral (Fig. 6b) and red muntjac (Fig. 6e) were most
active when musk deer (Fig. 6c) were least active so their overall overlap was moderate
(Dhat = 0.60 and 0.39 respectively).
Nepal grey langur (Fig. 6f), Assam macaque (Fig. 6g) and medium-sized ground
birds (Fig. 6i) were diurnal. Red muntjacs were also mostly diurnal (Fig. 6e). Wild
boars were mostly active between early morning and late evening. Musk deer and
Malayan porcupine were active from the sunset to sunrise period.
13Biodiversity and Conservation Discussion Although fewer than 100 clouded leopards were thought to occur in Nepal (Jnawali et al. 2011), their discovery in Langtang National Park considerably extends their known range, and raises the possibility that they occur from the Terai in southern Nepal up to the Nepal–China border in the north. If our study area were to be representative of the park, then a tentative extrapolation would suggest that there are approximately 40 individuals present in the Langtang National Park alone. Our observations also extend the IUCN Red List global distribution maps for the jungle cat (Felis chaus), large Indian civet (Viverra zibetha) and Malayan porcupine (Hystrix brachyura) (Lunde et al. 2008; Gray et al. 2016; Timmins et al. 2016). Langtang National Park extends the known range of clouded leopards. The site has highly mountainous topography. Climate change is generally expected to push montane species upwards (Root and Schneider 2002; Root et al. 2006) but the pattern may not be straightforward in the Himalayas. Elsen and Tingley (2015) observed that the ‘hourglass shape’ of the Himalayas causes the available surface area to increase markedly only between 3500 and 5500 m. While available surface area does not always constitute suit- able habitat for species shifting ranges (Elsen and Tingley 2015), the extra surface area up to 5500 m in the Himalayas might become a potential habitat for clouded leopards and their prey. Insofar as we report a clouded leopard at 3498 m, a species thought to thrive in forest habitats, this may presage an increase in the species’ geographic range in this region. Regarding their predatory behaviour, like the congeneric Sunda clouded leopard (Hearn et al. 2013; Hearn et al. in review), clouded leopards in Langtang National Park were least active in the middle of the day, and largely crepuscular and nocturnal, as were the common leopards and leopard cats. Insofar as coincidental activity patterns are a basis for deducing likely prey, musk deer, detected throughout the elevational gradient, are a candidate for clouded leopards and common leopards (Figs. 5 and 6), whereas wild boar, red muntjac and musk deer are candidate prey for common leopards, as might be Himalayan goral and Himalayan serow, although these occurred at higher elevations (Fig. 4). Globally, more than half of prey species known to be eaten by large felids are either declining or threatened, and this threat of an empty ‘larder’ is particularly acute in the Indo-Malaya region (Sandom et al. 2017). Our finding of an association between the occurrence of common leopards and that of red muntjac may be suggestive of such vul- nerability (Ripple et al. 2014). Illegal trade may be a risk factor for clouded leopards (D’Cruze and Macdonald 2015; Min et al. 2018), but the role of poaching in Langtang National Park is unknown. The Nepali army and the Park Administration are working together to protect the park and to combat illegal wildlife trade, therefore these efforts may have limited poaching. Indeed, leopard cats were most prevalent where people occurred most, at lower eleva- tion, but (in common with clouded and common leopards) were least active when peo- ple were active by day (Fig. 5i). In Sabah, leopard cats showed higher occupancy closer to roads (Mathai et al. 2017), which, elsewhere, can affect predator distribution (Zhou et al. 2013). Elsewhere, in the Peninsula of Malaysia, our broader study found that clouded leop- ards occurred more in heterogeneous landscapes (Tan et al. 2017). Landscape hetero- geneity, and perhaps thus the abundance and availability of prey, can change. In 2015 13
Biodiversity and Conservation
our fieldwork was prematurely halted, because Gorkha earthquake (Mw 7.9) triggered
at least 160 landslides in Langtang valley killing at least 350 people (Lacroix 2016).
A subsequent study, such as ours, could reveal whether this geological upheaval has
affected the use of the landscape by clouded leopards.
Acknowledgements Özgün Emre Can dedicates this study to his father Professor Vedat Can who passed
away during the preparation of this research article (I miss you a lot Dad). We extend our gratitude to the
Department of National Parks and Wildlife Conservation of Nepal for providing permission for us to carry
out the study. We thank Langtang National Park administration and Sonam Tamang, and Ramesh Basnet
for participating in the fieldwork. We also thank to Dr. Maheshwar Dhakal, Hari Bhadra Acharya and Babu
Ram Bhattarai for their support during this study. We also thank the Bear Research and Conservation Nepal
and Surya Man Shresta, Anil Silwal, Niraj Thapa, Pasang Tamang, Nima Tamang and Minesh Ghimire. We
thank World Animal Protection for providing funding for this study and Margaret Balaskas for her admin-
istrative support. We are grateful to Tuğba Can for her support during the course of the project. We thank
Helen M. Bothwell and Andrew J. Hearn for providing insightful comments on an earlier draft, and Lara de
Sousa for assistance with R coding.
Open Access This article is distributed under the terms of the Creative Commons Attribution 4.0 Interna-
tional License (http://creativecommons.org/licenses/by/4.0/), which permits unrestricted use, distribution,
and reproduction in any medium, provided you give appropriate credit to the original author(s) and the
source, provide a link to the Creative Commons license, and indicate if changes were made.
References
Anderson DR (2008) Model based inference in the life sciences: a primer on evidence. Springer, New York
Barton K (2016) MuMIn: Multi-Model Inference. R package version 1.15.6. https://CRAN.R-project.org/
package=MuMIn
BBC (2008) Double trouble for Nepal’s tigers. http://news.bbc.co.uk/1/hi/sci/tech/7607203.stm. Accessed 3
Dec 2017
Borradaile L, Green M, Moon L, Robinson P, Tait A (1977) Langtang National Park Management Plan
1977-1982. Kathmandu. NEP/72/002 Field document No: 7. p 237
Campbell B (2000) Animals behaving badly: indigenous perceptions of wildlife protection. In: Knight J
(ed) Natural enemies: people-wildlife conflicts in anthropological perspective. Routledge, London, pp
124–144
D’Cruze N, Macdonald DW (2015) Clouded in mystery: the global trade in clouded leopards. Biodiv Con-
serv 24:3505–3526. https://doi.org/10.1007/s10531-015-1010-9
Dinerstein E, Mehta J (1989) The clouded leopard in Nepal. Oryx 23(4):199–201. https://doi.org/10.1017/
S0030605300023024
DNPWC. Langtang National Park. Department of National Parks and Wildlife Conservation, Nepal. http://
www.dnpwc.gov.np/protected_areas/details/langtangnationalpark Accessed 17 Aug 2017
Donadio E, Buskirk SW (2006) Diet, morphology, and interspecific killing in Carnivora. Am Nat
167(4):524–536
Easterling DR, Meehl GA, Parmesan C, Changnon SA, Karl TR, Mearns LO (2000) Climate extremes:
observations, modeling, and impacts. Science 289:2068–2074. https://doi.org/10.1126/scien
ce.289.5487.2068
Elsen PR, Tingley MW (2015) Global mountain topography and the fate of montane species under climate
change. Nat Clim Chang. https://doi.org/10.1038/nclimate2656
Fiske I, Chandler R (2011) Unmarked: an R package for fitting hierarchical models of wildlife occurrence
and abundance. J Stat Softw 43(10):1–23
Ghimirey Y, Acharya R (2018) The Vulnerable clouded leopard Neofelis nebulosa in Nepal: an update.
Oryx 52(1):166–170. https://doi.org/10.1017/S0030605316000582
Gray TNE, Timmins RJ, Jathana D, Duckworth JW, Baral H, Mukherjee S (2016) Felis chaus. The
IUCN Red List of Threatened Species 2016: e.T8540A50651463. http://dx.doi.org/10.2305/IUCN.
UK.2016-2.RLTS.T8540A50651463.en. Accessed 10 Nov 2016
Green MJB (1981) A check-list and some notes concerning the mammals of the Langtang National Park,
Nepal. J Bombay Nat Hist Soc 78(1):77–87
13Biodiversity and Conservation
Hearn AJ et al (2013) Insights into the spatial and temporal ecology of the Sunda clouded leopard Neofelis
diardi. Raffles Bull Zool 61(2):871–875
Hearn AJ, Ross J, Bernard H, Bakar SA, Hunter LTB, Macdonald DW (2016) The first estimates of mar-
bled cat Pardofelis marmorata population density from Bornean primary and selectively logged forest.
PLoS ONE 11(3):e0151046. https://doi.org/10.1371/journal.pone.0151046
Hearn AJ, Ross J, Bernard H, Bakar SA, Goossens B, Hunter LT, Macdonald DW (2017) Responses of
Sunda clouded leopard Neofelis diardi population density to anthropogenic disturbance: refining esti-
mates of its conservation status in Sabah. Oryx. https://doi.org/10.1017/S0030605317001065
Hersteinsson P, Macdonald DW (1992) Interspecific competition and the geographical distribution of Red
and Arctic foxes Vulpes vulpes and Alopex lagopus. Oikos 64(3):505–515
Jnawali SR, Baral HS, Lee S, Acharya KP, Upadhyay GP, Pandey M, Shrestha R, Joshi D, Laminchhane
BR, Griffiths J, Khatiwada AP, Subedi N, Amin R (2011) The Status of Nepal mammals: the national
red list series. Department of National Parks and Wildlife Conservation, Kathmandu
Kéry M, Royle JA (2015) Applied hierarchical modeling in ecology: analysis of distribution, abundance and
species richness in R and BUGS. Academic Press, London
Lacroix P (2016) Landslides triggered by the Gorkha earthquake in the Langtang valley, volumes and initia-
tion processes. Earth Planets Space 68:46. https://doi.org/10.1186/s40623-016-0423-3
Loarie SR, Duffy PB, Hamilton H, Asner GP, Field CB, Ackerly DD (2009) The velocity of climate change.
Nature 462(7276):1052–1055
Lovari S, Ventimiglia M, Minder I (2013) Food habits of two leopard species, competition, climate change
and upper treeline: a way to the decrease of an endangered species? Ethol Ecol Evol 25(4):305–318.
https://doi.org/10.1080/03949370.2013.806362
Lunde D, Aplin K, Molur S (2008) Hystrix brachyura. The IUCN Red List of Threatened Species 2008:
e.T10749A3212358. http://dx.doi.org/10.2305/IUCN.UK.2008.RLTS.T10749A3212358.en. Accessed
10 Nov 2016
Macdonald DW, Loveridge A, Nowell K (2010) Dramatis personae: an introduction to the wild felids. In:
Macdonald DW, Loveridge A (eds) Biology and conservation of wild felids. Oxford University Press,
Oxford, pp 3–58
MacKenzie DI, Bailey LL (2004) Assessing the fit of site-occupancy models. J Agric Biol Environ Stat
9:300–318
Mathai J, Sollmann R, Meredith ME, Belant JL, Niedballa J, Buckingham L, Wong ST, Asad S, Wilting A
(2017) Fine-scale distributions of carnivores in a logging concession in Sarawak, Malaysian Borneo.
Mamm Biol 86:56–65. https://doi.org/10.1016/j.mambio.2017.04.002
Mazerolle MJ (2017) AICcmodavg: Model selection and multimodel inference based on (Q)AIC(c). R pack-
age version 2.1-1. https://cran.r-project.org/package=AICcmodavg
Miettinen J, Shi C, Liew SC (2011) Deforestation rates in insular Southeast Asia between 2000 and 2010.
Glob Change Biol 17(7):2261–2270. https://doi.org/10.1111/j.1365-2486.2011.02398.x
Min S, D’Cruze N, Macdonald D (2018) A note on felid trade at local markets in Myanmar. CATnews
67:25–28
Naing H, Ross J, Burnham D, Htun S, Macdonald D (2017) Population density estimates and conservation
concern for clouded leopards Neofelis nebulosa, marbled cats Pardofelis marmorata and tigers Pan-
thera tigris in Htamanthi Wildlife Sanctuary, Sagaing, Myanmar. Oryx. https://doi.org/10.1017/S0030
605317001260
Niedballa J, Courtiol A, Sollmann R (2017) camtrapR: camera trap data management and preparation of
occupancy and spatial capture-recapture analyses. R package version 0.99.8. https://CRAN.R-proje
ct.org/package=camtrapR
Palomares F, Caro TM (1999) Interspecific killing among mammalian carnivores. Am Nat 153(5):492–508
R Core Team (2017) R: A language and environment for statistical computing. R Foundation for Statistical
Computing, Vienna, Austria. https://www.R-project.org
Richards SA (2005) Testing ecological theory using the information-theoretic approach: examples and cau-
tionary results. Ecology 86:2805–2814
Ridout MS, Linkie M (2009) Estimating overlap of daily activity patterns from camera trap data. J Agric
Biol Environ Stat 14:322–337
Ripple WJ, Estes JA, Beschta RL, Wilmers CC, Ritchie EG, Hebblewhite M, Berger J, Elmhagen B, Letnic
M, Nelson MP, Schmitz OJ, Smith DW, Wallach AD, Wirsing AJ (2014) Status and ecological effects
of the World’s largest carnivores. Science 343(6167):1241484. https://doi.org/10.1126/science.12414
84
Root TL, Schneider SH (2002) Climate change: overview and implications for wildlife. In: Root TL, Schnei-
der SH (eds) Wildlife responses to climate change: North American case studies. Island Press, Wash-
ington, DC, pp 1–56
13Biodiversity and Conservation
Root TL, Liverman D, Newman C (2006) Managing biodiversity in the light of climate change: current
biological effects and future impacts. In: Macdonald DW, Service K (eds) Key topics in conservation
biology. Blackwell Publishing, Oxford, pp 85–104
Sandom CJ, Williams J, Burnham D, Dickman AJ, Hinks AE, Macdonald EA, Macdonald DW (2017)
Deconstructed cat communities: quantifying the threat to felids from prey defaunation. Divers Distrib
23:667–679. https://doi.org/10.1111/ddi.12558
Sharma E, Chettri N, Tse-ring K, Shrestha AB, Jing F, Mool P, Eriksson M (2009) Climate change impacts
and vulnerability in the Eastern Himalayas. ICIMOD, Kathmandu
Singh P, Macdonald DW (2017) Populations and activity patterns of clouded leopards and marbled cats in
Dampa Tiger Reserve, India. J Mammal 98(5):1453–1462. https://doi.org/10.1093/jmammal/gyx104
Tan CKW, Rocha DG, Clements GR, Brenes-Mora E, Hedges L, Kawanishi K, Mohamad SW, Rayan DM,
Bolongon G, Moore J, Wadey J (2017) Habitat use and predicted range for the mainland clouded leop-
ard Neofelis nebulosa in Peninsular Malaysia. Biol Conserv 206:65–74. https://doi.org/10.1016/j.bioco
n.2016.12.012
Timmins RJ, Duckworth JW, Chutipong W, Ghimirey Y, Willcox DHA, Rahman H, Long B, Choudhury A
(2016) Viverra zibetha. The IUCN Red List of Threatened Species 2016: e.T41709A45220429. http://
dx.doi.org/10.2305/IUCN.UK.2016-1.RLTS.T41709A45220429.en. Accessed 10 Nov 2016
WWF (2013) Another milestone towards curbing wildlife trade in Nepal. http://www.wwfnepal.org/?20730
9/Another-milestone-towards-curbing-wildlife-trade-in-Nepal. Accessed 3 Dec 2017
Zhou Y, Buesching CD, Newman C, Kaneko Y, Xie Z, Macdonald DW (2013) Balancing the benefits of
ecotourism and development: the effects of visitor trail-use on mammals in a Protected Area in rapidly
developing China. Biol Conserv 165:18–24
Publisher’s Note Springer Nature remains neutral with regard to jurisdictional claims in published maps and
institutional affiliations.
Affiliations
Özgün Emre Can1 · Bhupendra Prasad Yadav2 · Paul J. Johnson1 · Joanna Ross1 ·
Neil D’Cruze1,3 · David W. Macdonald1
* Özgün Emre Can
ozgunemrecan@gmail.com
1
Wildlife Conservation Research Unit, Department of Zoology, The Recanati‑Kaplan Centre,
University of Oxford, Tubney House, Abingdon Road, Tubney, Oxon OX13 5QL, UK
2
Department of National Parks and Wildlife Conservation, Babarmahal, Kathmandu, Nepal
3
World Animal Protection, 5th Floor, 222 Grays Inn Road, London WC1X 8HB, UK
13You can also read