Fast in-situ X-ray scattering reveals stress sensitivity of gypsum dehydration kinetics
←
→
Page content transcription
If your browser does not render page correctly, please read the page content below
ARTICLE
                  https://doi.org/10.1038/s43246-021-00156-9                OPEN

                  Fast in-situ X-ray scattering reveals stress
                  sensitivity of gypsum dehydration kinetics
                  Christoph Eckart Schrank1 ✉, Oliver Gaede 1, Tomasz Blach2, Katherine Carmen Michelle Gioseffi1,
                  Stephen Mudie3, Nigel Kirby3, Klaus Regenauer-Lieb 2 & Andrzej P. Radliński3,4

                  The dehydration of gypsum to hemihydrate has been studied for decades because it is an
                  important model reaction for understanding fluid-triggered earthquakes, and due to the
                  global use of plaster of Paris in the construction industry. The dehydration kinetics of gypsum
                  strongly depend on temperature and water vapour pressure. Here, we perform fast, time-
1234567890():,;

                  resolved synchrotron X-ray scattering on natural alabaster samples, finding that a small
                  elastic load accelerates the dehydration reaction significantly. The mechanical acceleration of
                  the reaction consumes about 10,000 times less energy than that due to heating. We propose
                  that this thermodynamically surprising finding is caused by geometry-energy interactions in
                  the microstructure, which facilitate nucleation and growth of the new crystalline phase. Our
                  results open research avenues on the fundamental thermo-mechanics of crystal hydrates and
                  the interaction of stress and chemical reactions in crystalline solids with a wide range of
                  implications, from understanding dehydration-triggered earthquakes to the energy-efficient
                  design of calcination processes.

                  1 Queensland University of Technology, School of Earth and Atmospheric Sciences, Brisbane, QLD, Australia. 2 The University of New South Wales, School of

                  Minerals and Energy Resources Engineering, Anzac Parade, Kensington, NSW, Australia. 3 Australian Synchrotron, Clayton, VIC, Australia. 4 University of
                  Warsaw, Faculty of Physics, Warsaw, Poland. ✉email: christoph.schrank@qut.edu.au

                  COMMUNICATIONS MATERIALS | (2021)2:51 | https://doi.org/10.1038/s43246-021-00156-9 | www.nature.com/commsmat                                           1
ARTICLE                                                                 COMMUNICATIONS MATERIALS | https://doi.org/10.1038/s43246-021-00156-9

T
        he calcium sulphate dihydrate gypsum (CaSO4·2H2O) is                     results in a negative correlation of pH2O with κ18. In contrast, the
        the most common sulphate evaporite mineral on our                        effect of mechanical stress on gypsum dehydration kinetics is not
        planet1. Sulphate evaporites play an important role in                   well understood. A single study on high-pressure dehydration of
Earth’s sulphur cycle and are primary recorders of geochemical                   single crystals, conducted in the pressure range 343–1085 MPa
fluxes through time2,3. Upon heating, gypsum gradually loses its                  using a diamond anvil cell under water-saturated conditions19,
water, transforming into the hemihydrate, also known as bassa-                   found that a pressure increase decreases the reaction rate. This
nite, (CaSO4·0.5H20) and anhydrite (CaSO4). While gypsum and                     result contrasts with the conclusions of a comprehensive study on
anhydrite deposits are common on Earth, bassanite is unstable at                 the effects of confining pressure, pc, and pore-fluid pressure, pf,
its surface1. However, bassanite, as well as gypsum, deposits have               on dehydration kinetics of natural gypsum rock (Volterra
been detected on Mars, and their origin remains a matter of                      alabaster)20, performed on cylindrical specimens (20 × 50 mm) in
ongoing debate4–7. The gypsum-hemihydrate transformation has                     a triaxial stress apparatus. It turned out that the reaction rate is
been long studied as a laboratory analogue for seismogenic                       negatively correlated with pf, consistent with the rate-inhibiting
dehydration reactions during subduction8,9 and as a model of                     impact of pH2O, whereas pc has a negligible effect.
metamorphic dehydration reactions per se10,11. Hemihydrate,                         Triaxial dehydration experiments are usually conducted under
often referred to as plaster of Paris, has been used by humans for               constant-stress load (often to >100 MPa20), which causes com-
centuries. The modern construction industry alone produces                       plex interactions between the transient hydraulic, chemical, and
~100 billion kg of hemihydrate per year globally by gypsum                       mechanical processes in gypsum samples20–22. Whereas without
calcination7. It serves as binder in cement, mortars, and stucco,                large confining stresses the shrinking of the denser dehydrated
and orthopaedicians employ it for the immobilisation of fractured                phase produces ~30% porosity, the dehydration-induced pore
limbs12,13. In the US, 47% of the domestically mined and syn-                    network collapses under high constant-stress load9. Therefore,
thesised gypsum supplies are calcined to hemihydrate to be used                  the evolving drainage network loses connectivity, and micro-
as plaster14. Due to the vast scale of production, its high energy               regions of high pore-fluid pressure can form, which in turn
demands and the significant CO2 footprint of gypsum calcination                   decelerate the reaction dramatically and possibly lead to hydraulic
(ca. 76 kg of CO2 per ton of gypsum15), it is desirable to improve               fracturing21,22. Under constant-stress boundary conditions it is
the efficiency of the dehydration procedure7. All in all, there is a              thus difficult to separate the effect of mechanical stress on kinetics
clear need to improve our understanding of the physical controls                 from the coupled chemo-hydraulic-mechanical processes. This is
on the kinetics of the gypsum-hemihydrate transformation.                        further compounded by the need to infer the progress of dehy-
   The rate of the gypsum-hemihydrate transformation is dom-                     dration from proxies, usually the measured volume of expelled
inantly controlled by temperature, T, and the water vapour                       excess fluid20–22. This method is not sensitive enough to capture
pressure in the reaction environment, pH2O16–18. A temperature                   the onset of dehydration and generally leads to an under-
increase causes an exponential increase in reaction rate κ                       estimation of the dehydration rate11.
according to the Arrhenius relation κ ¼ AeE=ðRT Þ where A is a                     To overcome these challenges, we conducted in-situ experi-
reaction-specific constant, R is the universal gas constant, and E is             ments using time-resolved synchrotron X-ray scattering techni-
the activation energy. Increasing pH2O in the sample environment                 ques specifically designed to investigate and quantify the impact
slows down the evacuation of H2O from the crystalline phase and                  of stress on the dehydration kinetics of the gypsum-hemihydrate
                                                                                 transformation11. Dehydration of axially pre-stressed, heated
                                                                                 discs of natural gypsum rock (Volterra alabaster) was monitored
                                                                                 in a purpose-built loading cell while collecting 2D small- and
                                                                                 wide-angle X-ray scattering patterns11 (SAXS/WAXS, Fig. 1).
                                                                                 Experiments were performed at controlled temperature in the
                                                                                 elastic differential pre-stress regime (Δσ), such that the resulting
                                                                                 pore network could evolve freely, and the sample did not fracture
                                                                                 macroscopically. Details of the pre-stress regime are discussed in
                                                                                 Supplementary Note 1. Our experiments provide unambiguous
                                                                                 evidence that dehydration kinetics and differential stress are
                                                                                 coupled. For the examined dehydration temperatures of 129 °C
                                                                                 and 142 °C, the pre-stressed samples dehydrate about two times
                                                                                 faster than their low-stress equivalents (Fig. 2, Supplementary
                                                                                 Table 1). 3D grain-scale numerical models demonstrate that the
                                                                                 elastic differential pre-stress combined with internal stresses due
                                                                                 to the elastic anisotropy of the gypsum grains produce substantial,
                                                                                 geometrically controlled stress perturbations at the grain scale
                                                                                 (Fig. 3). It is hypothesised that these stress perturbations explain
                                                                                 the observed acceleration of the dehydration reaction, as pre-
                                                                                 dicted theoretically more than thirty years ago23.

                                                                                 Results
                                                                                 2D SAXS/WAXS patterns. We report the results of four dehy-
                                                                                 dration experiments (Fig. 2, Supplementary Table 1). Two pre-
Fig. 1 Unscaled schematic drawing of the experimental in-situ cell in its        stresses, low (hand-tight) and high (estimated Δσ
COMMUNICATIONS MATERIALS | https://doi.org/10.1038/s43246-021-00156-9 ARTICLE
Fig. 2 Key SAXS/WAXS results of all four dehydration experiments. Upper row a, c, e, g: pairs of 2D SAXS and WAXS maps of unreacted Volterra
alabaster for low- and high-stress experiments (see map titles) at T = 129 °C ± 2.5 °C (a, c) and T = 142 °C ± 2.5 °C (e, g). The colour scale maps the
decadic logarithm of raw intensity in the interval [0; 6] where blue denotes low values and red high ones. Characteristic gypsum reflections are annotated
and marked with white arrows, indexed according to space group C2/c32. Centre row b, d, f, h: pairs of 2D SAXS/WAXS maps for the reacted samples.
Selected hemihydrate reflections are annotated and marked by white arrows, indexed in space group I231. i, j Conversion curves as a function of time
showing reaction progress for low- (white circles) and high-stress (grey squares) experiments at T = 129 °C ± 2.5 °C on the left (i), and at T = 142 °C ± 2.5
°C on the right (j). Error bars for time and conversion fraction are smaller than the symbol size and thus not shown. Orange markers indicate datapoints at
induction time (α = 0.05) and green ones those at the characteristic time (α = 0.63). The orange and green double arrows above the plot boxes indicate
the differences in induction and characteristic times, respectively. The induction time is often interpreted as the time required for the formation of critical
nuclei and growth to detectable size while the period thereafter involves crystal growth from those nuclei33,34. The characteristic time denotes the inverse
of the kinetic rate constant for exponential conversion models35,36.
small interrogation volume in the sample centre. The SAXS/ variations along the hemihydrate (110)-ring are noticeable in
WAXS patterns reflect the evolution of nano-structural features Fig. 2b but perhaps not obvious because of the logarithmic colour
in the scale range from 0.15 to 23 nm, which covers characteristic scale. The conversion curve for a second, adjacent interrogation
Bragg reflections of gypsum and hemihydrate (Fig. 2a–h) as well point of the same sample with a more uniform microfabric
as the development of nano-porosity and nano-crystallites of exhibits less fluctuations and shows similar kinetics (Supplemen-
hemihydrate11. Analysis of Bragg reflections enabled in situ tary Fig. 2) because the micro-strains are averaged out. The
tracking of the lattice transformation during dehydration (Fig. 2i, homogenisation of the Bragg rings in the product (Fig. 2b, d, f, h)
j; see Methods for details). indicates growth of smaller, randomly oriented hemihydrate
For three experiments, gypsum fully converted to hemihydrate grains, confirmed by ex-situ imaging of the samples (Supple-
(Fig. 2c–h). Only the low-stress experiment at T = 129 °C mentary Figs. 3 and 4). The high-intensity SAXS region around
retained ~1% of gypsum in the sample centre11 (Fig. 2a, b). the beam stop contains scattering due to nano-pores, and in the
The Bragg reflections of the unreacted samples form patchy rings reacting samples, to a smaller degree, also due to nano-crystallites
(Fig. 2a, c, e, g), indicating random orientation of grains of a of hemihydrate embedded in gypsum grains11. In the unreacted
number insufficient to form a powder-like truly isotropic samples, the SAXS iso-intensity profiles are nearly circular (with
pattern24. The (020)-reflection of the gypsum sample used at T aspect ratio ≤1.03), suggesting random orientation of nano-pores.
= 129 °C and low pre-stress exhibits a noticeable gap in the The corresponding SAXS patterns of reacted samples display a
upper-left quadrant of the (020)-ring, indicating the local significant increase in intensity caused by growth of nano-pores
alignment of grains in this specific interrogation point (Fig. 2a). and nano-crystallites11. In the low-stress experiments, the iso-
As a result of this alignment, local micro-strains, expressed by intensity profiles remain almost circular, with aspect ratios ≤1.05
changes of the width and height of the azimuthally integrated (Fig. 2b, f). In contrast, their high-stress counterparts have an
growing hemihydrate (110)-peak24, lead to fluctuations of the 1D aspect ratio of ~1.16, which indicates preferential growth of
conversion curve (black circles in Fig. 2i). Azimuthal intensity anisotropic nano-pores and/or nano-crystallites along the radial
COMMUNICATIONS MATERIALS | (2021)2:51 | https://doi.org/10.1038/s43246-021-00156-9 | www.nature.com/commsmat 3ARTICLE COMMUNICATIONS MATERIALS | https://doi.org/10.1038/s43246-021-00156-9
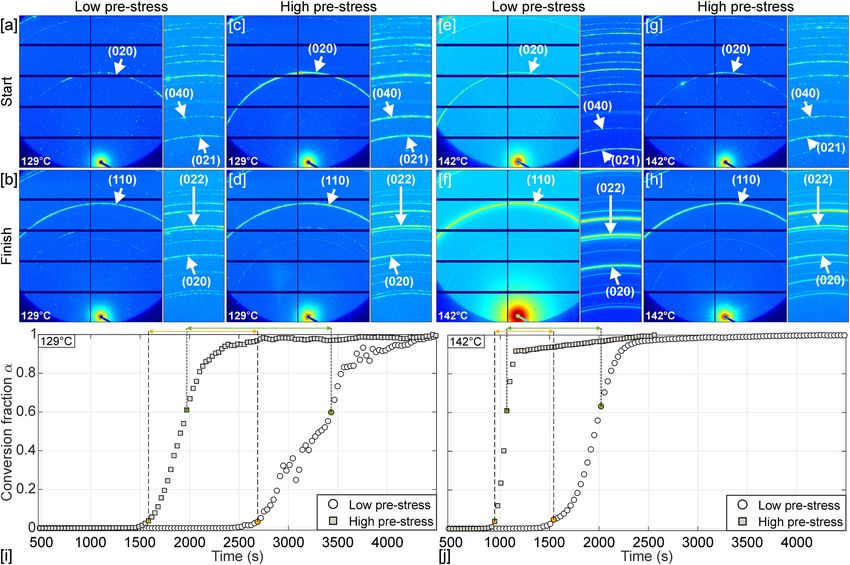
Fig. 3 Results of 3D numerical models for the grain-scale stress state induced by elastic pre-stress. a Numerical simulation of grain-boundary normal
contact stresses for a polycrystalline model cube with an edge length of 1 mm under a constant-displacement load (black arrow) equivalent to the one
applied to our samples. For simplicity, a polygonal foam microstructure is used. Model grains have the anisotropic elastic properties of gypsum26 with
randomly oriented crystallographic axes. Several model grains have been removed to unveil the model interior. Tensile stresses are negative and shown in
blue colours. The white circle with the minus-sign marks a grain boundary at low angle to shortening under tensile loading. Compressive stresses are
positive. The plus-sign in a white circle marks a grain boundary at high angle to the shortening direction, which accordingly is in compression. Completely
white grain boundaries are located at the outer surfaces of the model cube and thus have no contact stress. b Visualisation of grain-boundary segments
that formed incipient grain-boundary cracks. The colour scale is the same as in a and shows the opening displacement over the interval [2; 30] nm. As
expected37, grain-boundary cracking commences at grain vertices and triple lines. From these locations, cracks preferentially propagate across grain
interfaces sub-parallel to the loading direction.
real-space direction under the increased Δσ. The nano-scale loading results in heterogeneous grain-scale stresses caused by
tubular structures parallel to the long axes of the elongated geometric mismatch of the anisotropically deforming, randomly
hemihydrate grains (Supplementary Figs. 3 and 4) and radially oriented grains (Fig. 3, Supplementary Note 3). The resulting
propagating nano-scale voids inclined relative to the incident local contact stresses may be normal to grain boundaries, espe-
beam could be the physical cause of the observed anisotropic cially on interfaces at a high angle to the compression direction,
scattering pattern. whereas most grain boundaries sub-parallel to the pre-stress
direction are under local tension (Fig. 3a) and may start to crack
Dehydration kinetics. The striking impact of Δσ on kinetics is at higher Δσ (Fig. 3b). The observed anisotropy of the final SAXS
revealed by the conversion curves (Fig. 2i, j, see Methods for iso-intensity patterns at high Δσ attests to stress-controlled for-
definition). At both temperatures, increased Δσ accelerates the mation of anisotropic nano-scale structures, such as radially
dehydration reaction by a factor of about 2, as measured by the growing inclined cracks or hollow hemihydrate nano-crystallites,
induction and characteristic times (Fig. 2i, j, Supplementary in our samples. Increased normal stresses on grain boundaries
Table 1). Therefore, higher Δσ promotes both the formation and enhance the chemical potential gradient and fluid pressure gra-
subsequent growth of nuclei. The conversion curve for T = 129 °C dient locally, which can accelerate the transformation20,23,28,29.
at high pre-stress is very similar to the one at T = 142 °C and low Therefore, we hypothesise that the high elastic pre-stress pro-
pre-stress. Thus, one can compare the energy needed to accelerate motes local dissolution of gypsum at grain-interface regions with
the dehydration reaction by a factor of 2, at T = 129 °C and low high contact stresses and facilitates subsequent transport to and
stress, through heating or elastic straining. Most significantly, precipitation near those with low or tensile contact stresses. This
accelerating the dehydration by heating turns out to be more than prediction can be tested by examining gypsum rocks with a
10,000 times more expensive energetically than doing so via pre- strong crystallographic preferred orientation such as satin spar. In
stress (Supplementary Note 1). The dramatic impact of pre-stress such materials, transformation kinetics should be less sensitive to
on kinetics does neither depend on nor alter the microphysical pre-stress.
dehydration mechanisms, as revealed by post-mortem analyses of Our results imply that elastic stresses can accelerate dehydra-
scanning-electron microscope images (Supplementary Note 2, tion reactions dramatically in crystalline solids with randomly
Supplementary Figs. 3 and 4). oriented grains. This notion supports the call for the development
of a thermodynamically consistent model for the coupling of
stress and reaction kinetics in such materials28; it should also
Discussion inspire a new class of kinetic experiments that explores the effect
Why does a small differential stress Δσ accelerate dehydration? of small elastic stresses on mineral transformations systematically.
The answer probably lies in the microstructure of the material. Our results hint at a potentially ubiquitous geometric thermo-
Volterra alabaster contains randomly oriented gypsum grains25 dynamic effect of a polycrystalline microstructure. Finally, this
with significant elastic anisotropy26. Nucleation of hemihydrate is work should open new research avenues for the energy-efficient
common within the vacancy-rich water layer of the (010)-plane in design of calcination processes for gypsum and other solids.
the gypsum parent, especially where this plane intersects crystal
edges16. Since the critical resolved shear stress on the (010)-plane
is ca. 0.5 MPa at low confining pressure27, it is likely that suitably Methods
Starting material. We dehydrated discs of natural alabaster from Volterra, Italy,
oriented (010)-planes slip slightly under pre-stress (Fig. 3a), with a diameter of 10 mm and a thickness of 1 mm. Volterra alabaster is a standard
which in turn may promote nucleation by producing new material in experimental rock mechanics because of its small grain size, low por-
vacancies and vacancy clusters16. Moreover, any pre-stress osity, and purity9,20,22,25. This alabaster consists of randomly oriented, subhedral,
4 COMMUNICATIONS MATERIALS | (2021)2:51 | https://doi.org/10.1038/s43246-021-00156-9 | www.nature.com/commsmatCOMMUNICATIONS MATERIALS | https://doi.org/10.1038/s43246-021-00156-9 ARTICLE
tabular gypsum grains with a mean grain size that varies on the scale of centimetres where I denotes SAXS intensity and t is the time. The corresponding time evo-
and is generally in the range of 45–123 μm25. A representative image of the lution of the (020)- and (220)-reflections resolved in the WAXS detector yield the
unreacted alabaster is shown in Supplementary Fig. 4a. same results and are omitted for clarity. We demonstrate the validity of this
method for quantifying the gypsum dehydration process in our methodological
review paper11. All experiments proceeded to reaction completion except for the
Beamline set-up and data processing. We used the pinhole-geometry SAXS/
one at T = 129 °C and low pre-stress. Post-mortem powder XRD confirmed that
WAXS beamline at the ANSTO Australian Synchrotron described in Kirby, et al.30.
1% gypsum remained in the sample centre, as can also be seen qualitatively in the
A 3 m-long, 22 mm-period in-vacuum undulator source (Kmax of 1.6 at 6.6 mm
SAXS/WAXS images (Fig. 2b) and the post-mortem microstructural images
minimum insertion device gap) and a flat Si(111) double-crystal monochromator
(Supplementary Figs. 3 and 4). The data tables for the conversion curves plotted in
provide a photon flux of up to 1013 photons per second in the energy range from 5
Fig. 2i, j are provided in Supplementary Data 1 accompanying this article.
to 20 keV. X-ray energy of 16 keV, corresponding to the photon wavelength of
0.775 Å, was used in all experiments. Focusing is achieved with a KB mirror pair
with Si, Rh, and Pt stripes for harmonic rejection. Four monochromatic slits allow Scanning-electron microscopy (SEM). SEM images (Supplementary Figs. 3 and
flexible adjustment of the collimation system to minimise parasitic scattering at 4) of the surfaces of uncoated reacted and unreacted samples were obtained with
different camera lengths. The vacuum SAXS camera can be adjusted to camera the Tescan Mira 3 Variable Pressure Field Emission SEM under low vacuum
lengths between 60 and 720 cm. Its rear module contains the beamstop and the (40 Pa). We used an accelerating voltage of 10 kV, beam intensity index of 12, and a
SAXS detector. The WAXS detector is located above the frontal nose cone of the working distance between 9 and 14 mm. A mixed mode of backscattered-electron
SAXS camera. The 169 × 179 mm Pilatus 1 M and the 33 × 169 mm Pilatus 200 K signal (70%) and secondary-electron signal (30%) helped to eliminate edge effects
(pixel size of 172 × 172 μm2), were used to collect 2D SAXS and WAXS scattering compared to imaging in pure secondary-electron mode.
(diffraction) images in transmission mode. The sample-to-detector distances of
1.03 and 0.45 m, respectively (Fig. 1), were calibrated using silver behenate. This
set-up covered the real-space size range of ca. [0.15; 1.0] nm on the WAXS Data availability
detector, and ca. [0.3; 23] nm on the SAXS detector. The corresponding full range The azimuthally integrated, calibrated, time-series 1D SAXS curves underpinning the
of the magnitude of the scattering vector q11 covered 2.2 × 10⁻² A1 to 4.1 A1 . In conversion curves shown in Fig. 2 and the processed data for the conversion curves as
this configuration, the SAXS detector monitored the prominent (110)-reflection of well are provided as electronic supplement (Supplementary Data 1). The authors will
hemihydrate while the WAXS detector captured the time evolution of the (020)- arrange for sharing of the uncalibrated, uncompressed 32-bit TIFF images from the
and (220)-reflections. The time evolution of these reflections served for tracking of SAXS/WAXS detectors upon reasonable request.
the dehydration reaction, as explained below. 2D diffraction patterns were recorded
as uncompressed 32-bit TIFF images. Since the obtained Bragg reflections were Received: 22 September 2020; Accepted: 28 April 2021;
circular, 2D SAXS/WAXS images were transformed into 1D curves by azimuthal
averaging using the scatterBrain IDL program (http://archive.synchrotron.org.au/
aussyncbeamlines/saxswaxs/software-saxswaxs), developed at the SAXS/WAXS
beamline at the ANSTO Australian Synchrotron. SAXS intensity curves were
converted to absolute units. This procedure entailed correction for background
signal through measurements of the empty cell, dark current, intensity normal-
isation for transmitted flux using a beam-stop detector, and intensity calibration References
against a glassy carbon standard. The calibrated 1D SAXS curves employed to 1. Chang, L. L. Y., Howie, R. A. & Zussman, J. Non-silicates: Sulphates,
produce the conversion curves in Fig. 2i, j are available as electronic supplement Carbonates, Phosphates, Halides 2nd edn, Vol. 5B (Geological Society of
(Supplementary Data 1). London, 1998).
2. Blättler, C. L. et al. Two-billion-year-old evaporites capture Earth’s great
Cell loading and heating. For each experiment, a sample disc was placed into the oxidation. Science https://doi.org/10.1126/science.aar2687 (2018).
cell centre before the remaining components (seal, spacer, and axial piston; Sup- 3. Spencer, R. J. Sulfate minerals in evaporite deposits. Rev. Miner. Geochem. 40,
plementary Fig. 1a) were assembled. Then, the piston was screwed carefully to a 173–192 (2000).
hand-tight state in low-stress experiments; additional tightening with a calibrated 4. Rapin, W. et al. Hydration state of calcium sulfates in Gale crater, Mars:
torque wrench was applied for high-stress experiments (Supplementary Note 1). identification of bassanite veins. Earth Planet. Sci. Lett. 452, 197–205 (2016).
The closed cell was mounted on a high-precision translation stage in the orien- 5. Wray, J. J. et al. Identification of the Ca-sulfate bassanite in Mawrth Vallis,
tation shown in Fig. 1. Ambient humidity was not controlled, and the sample Mars. Icarus 209, 416–421 (2010).
chamber contained air from the SAXS experimental hutch. The fluid ports of the 6. Langevin, Y., Poulet, F., Bibring, J.-P. & Gondet, B. Sulfates in the north polar
cell remained closed during all experiments (port 1 was connected to a pressure region of Mars detected by OMEGA/Mars express. Science 307, 1584 (2005).
transducer11), locking in the air surrounding the sample. In the radial directions, a 7. Stawski, T. M. et al. Formation of calcium sulfate through the aggregation of
gap of 1 cm remained between the sample disc and the cell wall, providing space for sub-3 nanometre primary species. Nat. Commun. 7, 11177 (2016).
the evacuation of the liberated water. Three or five equidistant regions of interest 8. Heard, H. C. & Rubey, W. W. Tectonic implications of gypsum dehydration.
were chosen on each disc, always including the disc centre and additional points GSA Bull. 77, 741–760 (1966).
along the horizontal radius. The beam spot size was 100 × 100 μm2 in all experi- 9. Brantut, N. et al. Dehydration-induced damage and deformation in gypsum
ments but the one at T = 142 °C and low pre-stress, in which the spot size was and implications for subduction zone processes. J. Geophys. Res. https://doi.
250 × 250 μm2. The larger beam size was the requirement of modified beamline org/10.1029/2011JB008730 (2012).
hardware and explains the elevated scattering intensity seen in Fig. 2e, f. We found 10. Bedford, J., Fusseis, F., Leclère, H., Wheeler, J. & Faulkner, D. A 4D view on
that the measured progress of transformation does not depend on the position of the evolution of metamorphic dehydration reactions. Sci. Rep. 7, 6881 (2017).
the region of interest on the sample under our experimental conditions11. There- 11. Schrank, C. E. et al. Tracking metamorphic dehydration reactions in real time
fore, we only report data acquired for the central point here. Reference SAXS/ with transmission small- and wide-angle synchrotron X-ray scattering: the
WAXS patterns were measured at ambient conditions before heating. In the next case of gypsum dehydration. J. Petrol. https://doi.org/10.1093/petrology/
step, the heater was switched on, and SAXS/WAXS patterns were recorded with an egaa041 (2020).
exposure time of 5 seconds per point, moving the sample stage successively in the 12. Sharma, H. & Prabu, D. Plaster of Paris: past, present and future. J. Clin.
horizontal direction relative to the stationary X-ray beam, starting at the disc centre Orthop. Trauma 4, 107–109 (2013).
and stepping radially outwards. Time increments needed to move between points 13. Van Driessche, A. E. S., Stawski, T. M., Benning, L. G. & Kellermeier, M. in
ranged from 6 to 11 s. As a result, the average time interval between acquisition of New Perspectives on Mineral Nucleation and Growth: From Solution Precursors
successive SAXS/WAXS images in the sample centre amounted to ~30 s. Addi- to Solid Materials (eds Alexander, E. S. Van Driessche, Matthias Kellermeier,
tional set-up details and the calibration of the heating system are presented in our Liane G. Benning, & Denis Gebauer) (Springer International Publishing,
recent review paper on time-resolved synchrotron X-ray transmission scattering
2017).
experiments11. Supplementary Note 4 demonstrates experimentally that the
14. U. S. Geol. Survey, (ed U.S. Department of the Interior) 200, https://doi.org/
application of the high pre-stress does not affect the heating history of the samples.
10.3133/mcs2020 (Washington, 2020).
The observed acceleration of the dehydration reaction is due to elastic pre-stress
15. Fořt, J. & Černý, R. Carbon footprint analysis of calcined gypsum production
loading.
in the Czech Republic. J. Clean. Prod. 177, 795–802 (2018).
16. Fowler, A., Howell, H. G. & Schiller, K. K. The dihydrate-hemihydrate
Tracking of the phase transformation. Here, we use the time evolution of the transformation in gypsum. J. Appl. Chem. 18, 366–372 (1968).
normalised intensity of the hemihydrate (110) reflection, indexed according to 17. McAdie, H. G. The effect of water vapour upon the dehydration of
Ballirano, et al.31 at |q| = 1.0463 Å−1, tracked by the SAXS detector as measure for CaSO4•2H2O. Can. J. Chem. 42, 792–801 (1964).
the conversion fraction αðt Þ: 18. Preturlan, J. G. D., Vieille, L., Quiligotti, S. & Favergeon, L. Kinetics and
½I ðt Þ I ðt ¼ 0Þ mechanism of the dehydration of calcium sulfate dihydrate: a comprehensive
αð t Þ ¼ ð1Þ approach for studying the dehydration of ionic hydrates under controlled
max½I ðt Þ I ðt ¼ 0Þ
COMMUNICATIONS MATERIALS | (2021)2:51 | https://doi.org/10.1038/s43246-021-00156-9 | www.nature.com/commsmat 5ARTICLE COMMUNICATIONS MATERIALS | https://doi.org/10.1038/s43246-021-00156-9
temperature and water vapor pressure. J. Phys. Chem. C 124, 26352–26367 Acknowledgements
(2020). We are grateful for the support of the ANSTO, in providing the SAXS/WAXS beamline
19. Liu, C., Zheng, H. & Wang, D. The dehydration kinetics of gypsum at high at the Australian Synchrotron used in this work. We also acknowledge the Central
pressure and high temperature. High Press. Res. 35, 273–281 (2015). Analytical Research Facility (CARF) at the Queensland University of Technology for
20. Llana-Fúnez, S., Wheeler, J. & Faulkner, D. R. Metamorphic reaction rate supporting the laboratory work outside the Synchrotron and thank the following col-
controlled by fluid pressure not confining pressure: implications of leagues for their help, training, and advice: Donald McAuley and Gus Luthje (sample
dehydration experiments with gypsum. Contrib. Mineral. Petrol. 164, 69–79 preparation), Dr. Henry Spratt, Dr. Tony Raftery, and Dr. Tony Wang (XRD), and Dr.
(2012). Chris East (SEM). Computational resources and services used in this work were provided
21. Ko, S.-C., Olgaard, D. L. & Wong, T.-F. Generation and maintenance of pore by the eResearch Office of the Queensland University of Technology. The authors thank
pressure excess in a dehydrating system 1. Experimental and microstructural Elnaz Raghami for providing the mesh for the numerical model shown in Fig. 3, and Dr.
observations. J. Geophys. Res. 102, 825–839 (1997). Harald Milsch for supplying Volterra alabaster. K.R.L. acknowledges financial support by
22. Olgaard, D. L., Ko, S.-C. & Wong, T.-F. Deformation and pore pressure in the University of New South Wales through grant no. SPF01.
dehydrating gypsum under transiently drained conditions. Tectonophysics
245, 237–248 (1995).
23. Wheeler, J. The significance of grain-scale stresses in the kinetics of
Author contributions
Conceptualisation: C.E.S., T.B., O.G., A.R., and K.R.L. Investigation: C.E.S., T.B.,
metamorphism. Contrib. Mineral. Petrol. 97, 397–404 (1987).
K.C.M.G., S.M., N.K., O.G., and A.R. Formal analysis: C.E.S., O.G., K.C.M.G., and A.R.
24. Lavina, B., Dera, P. & Downs, R. T. Modern X-ray diffraction methods in
Visualisation: C.E.S., K.C.M.G. Supervision: C.E.S., K.R.L., O.G. Project administration:
mineralogy and geosciences. Rev. Mineral. Geochem. 78, 1–31 (2014).
C.E.S. Writing—original draft: C.E.S. Writing—review & editing: all authors. Funding
25. Fusseis, F. et al. Pore formation during dehydration of polycrystalline gypsum
acquisition: T.B., C.E.S., K.R.L.
observed and quantified in a time-series synchrotron radiation based X-ray
micro-tomography experiment. Solid Earth 3, 857–900 (2012).
26. Bass, J. D. in Mineral Physics and Crystallography: a Handbook of Physical Competing interests
Constants Vol. 2, AGU Reference shelf (ed Ahrens, T. J.) (American The authors declare no competing interests.
Geophysical Union, 1995).
27. Williams, S. C. The shear strength of gypsum single crystals on three cleavage
planes. Tectonophysics 148, 163–173 (1988). Additional information
28. Wheeler, J. The effects of stress on reactions in the Earth: sometimes rather Supplementary information The online version contains supplementary material
mean, usually normal, always important. J. Metamorph. Geol. 36, 439–461 available at https://doi.org/10.1038/s43246-021-00156-9.
(2018).
29. Gratier, J.-P., Dysthe, D. K. & Renard, F. in Advances in Geophysics Vol. 54 (ed Correspondence and requests for materials should be addressed to C.E.S.
Renata Dmowska) (Elsevier, 2013).
Peer review information Primary handling editor: John Plummer.
30. Kirby, N. M. et al. A low-background-intensity focusing small-angle X-
ray scattering undulator beamline. J. Appl. Crystallogr. 46, 1670–1680
Reprints and permission information is available at http://www.nature.com/reprints
(2013).
31. Ballirano, P., Maras, A., Meloni, S. & Caminiti, R. The monoclinic I2 structure
Publisher’s note Springer Nature remains neutral with regard to jurisdictional claims in
of bassanite, calcium sulphate hemihydrate (CaSO4 · 0.5H2O). Eur. J. Mineral.
published maps and institutional affiliations.
13, 985–993 (2001).
32. Comodi, P., Zanazzi, P. F., Nazzareni, S. & Speziale, S. High-pressure
behavior of gypsum: a single-crystal X-ray study. Am. Mineral. 93, 1530–1537
(2008). Open Access This article is licensed under a Creative Commons
33. Lasaga, A. C. Kinetic Theory in the Earth Sciences (Princeton University Press, Attribution 4.0 International License, which permits use, sharing,
1998). adaptation, distribution and reproduction in any medium or format, as long as you give
34. Ossorio, M., Van Driessche, A. E. S., Pérez, P. & García-Ruiz, J. M. The appropriate credit to the original author(s) and the source, provide a link to the Creative
gypsum–anhydrite paradox revisited. Chem. Geol. 386, 16–21 (2014). Commons license, and indicate if changes were made. The images or other third party
35. Milsch, H., Priegnitz, M. & Blöcher, G. Permeability of gypsum samples material in this article are included in the article’s Creative Commons license, unless
dehydrated in air. Geophys. Res. Lett. https://doi.org/10.1029/2011GL048797 indicated otherwise in a credit line to the material. If material is not included in the
(2011). article’s Creative Commons license and your intended use is not permitted by statutory
36. Ballirano, P. & Melis, E. Thermal behaviour and kinetics of dehydration of regulation or exceeds the permitted use, you will need to obtain permission directly from
gypsum in air from in situ real-time laboratory parallel-beam X-ray powder the copyright holder. To view a copy of this license, visit http://creativecommons.org/
diffraction. Phys. Chem. Miner. 36, 391–402 (2009). licenses/by/4.0/.
37. Raghami, E., Schrank, C. & Kruhl, J. H. 3D modelling of the effect of thermal-
elastic stress on grain-boundary opening in quartz grain aggregates.
Tectonophysics https://doi.org/10.1016/j.tecto.2019.228242 (2019). © The Author(s) 2021
6 COMMUNICATIONS MATERIALS | (2021)2:51 | https://doi.org/10.1038/s43246-021-00156-9 | www.nature.com/commsmatYou can also read