First Quarter of Fiscal 2021 Supplementary Material
←
→
Page content transcription
If your browser does not render page correctly, please read the page content below
First Quarter of Fiscal 2021
                                                Supplementary Material

                                                POLA ORBIS HOLDINGS INC.
                                                Director
                                                Finance, Legal & Administration,
                                                PR, IR and CSR
                                                Akira Fujii

This report contains projections of performance and other projections based on information currently available
and certain assumptions judged to be reasonable. Actual performance may differ materially from these projections
resulting from changes in the economic environment and other risks and uncertainties.
1.   Highlights of Consolidated Performance
2.   Segment Analysis
3.   Forecasts for Fiscal 2021
4.   Initiatives Going Forward & Appendices

                                              1
Q1 Key Topics
Cosmetics Market
The overall size of the Japanese cosmetics market (including exports) continued to shrink due to the impact of COVID-19
Inbound demand was sluggish due to Japanese border entry restrictions
The outlook for the net domestic market remains unclear, with the declaration of another state of emergency in some
regions by the Japanese government on January 8, which was lifted only to be reimposed on April 25
Source: Ministry of Economy, Trade and Industry, Ministry of Internal Affairs and Communications,
Japan Tourism Agency, Japan Department Stores Association, and Intage SLI
Our Group
Consolidated revenue and income increased, thanks to a strong performance Medium-term Management
from POLA overseas, and growth in e-commerce across each brand Plan Indicators (2021Q1)
POLA overseas revenue increased (+63% YoY), with high growth continuing in China 18.3%
Overseas sales ratio
(+3.3ppt*)
ORBIS revenue and income decreased, with little activity from existing customers
Domestic e-commerce 26.5%
Jurlique China revenue increased, and losses were improved
sales ratio (+2.6ppt*)
Achieved a profit in overseas business across the Group *vs Dec. 2020
Acquired tricot, Inc. as a subsidiary on April 1 (not reflected in the consolidated results forecast)
YoY Change in Consolidated Monthly Net Sales
Impacted by the declaration of a state of emergency, revenue
(%) Jan. Feb. Mar. decreased in January-February 2021 compared to the high
10%
10 level achieved in the same period in the previous year, which
was before the impact of the COVID-19 pandemic
Results for the first quarter slightly exceeded the plan, as
0%0
strong performance from POLA overseas and e-commerce
Monthly net sales YoY across each brand compensated for a decline in revenue in
(month by month) domestic storefront operations
Monthly net sales YoY
-10
-10% (cumulative total) 2
Consolidated P&L Changes Analysis
Net Sales to Operating Income
FY2020 FY2021 YoY Change
(mil. yen) Q1 Results Q1 Results Amount %
Consolidated net sales 43,316 43,561 245 0.6%
Cost of sales 7,106 6,399 (706) (9.9%)
Gross profit 36,210 37,162 951 2.6%
SG&A expenses 34,204 32,854 (1,349) (3.9%)
Operating income 2,006 4,307 2,301 114.7%
Key Factors
Consol. net sales Increased, as e-commerce and overseas operations compensated for
the decrease in revenue from storefront operations
Cost of sales Cost of sales ratio improved due to an increase in the contribution
from POLA’s high price range products
Cost of sales ratio 2020Q1 : 16.4% ⇒ 2021Q1 : 14.7%
SG&A expenses Labor expenses: down ¥129 mil. YoY
Sales commissions: down ¥ 1,031 mil. YoY
⇒ Resulted from a sales decline at POLA consignment sales channel.
Sales related expenses: down ¥365 mil. YoY
⇒ Reduced due to expense rationalization
Administrative expenses, etc.: up ¥177 mil. YoY
Operating income Operating margin 2020Q1: 4.6% ⇒ 2021Q1: 9.9%
3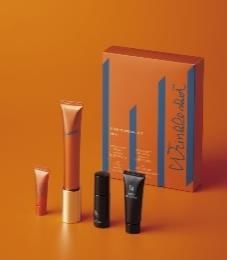
Consolidated P&L Changes Analysis
Operating Income to Profit Attributable to Owners of Parent
FY2020 FY2021 YoY Change
(mil. yen) Q1 Results Q1 Results Amount %
Operating income 2,006 4,307 2,301 114.7%
Non-operating income 88 1,518 1,429 -
Non-operating expenses 2,248 62 (2,186) (97.2%)
Ordinary income (154) 5,763 5,917 -
Extraordinary income 0 0 0 (74.9%)
Extraordinary losses 744 210 (533) (71.7%)
Profit before income
taxes
(898) 5,552 6,450 -
Income taxes etc. 352 1,600 1,247 353.8%
Profit attributable to
non-controlling interests
(4) 11 15 -
Profit attributable to
owners of parent
(1,246) 3,939 5,186 -
Key Factors
Non-operating income: Foreign exchange gain ¥1,396 mil.
Extraordinary losses: Impairment loss related to storefront operations ¥185 mil.
4Factors Impacting Profit Attributable to Owners of Parent
An increase in gross profit, a change in the business structure, and the impact of
the exchange rate boosted profit attributable to owners of parent by ¥5,186 million YoY
(mil. yen) Positive impact Negative impact
6,000
5,000 533
1,263
4,000
3,939
3,000 3,615
Decrease due to
POLA consignment sales decline
2,000
1,000 365
177
1,031
0 129
Impact of exchange rates
204 746
-1,000
-1,246
-2,000
FY2020 Q1 Increase Improved Labor Sales Sales- Admin. Non- Extraordinary Income FY2021 Q1
Profit in gross cost of expenses commissions related expenses, operating income taxes, Profit
attributable profit sales ratio expenses etc. income and loss etc. attributable
to owners and loss to owners
of parent of parent
51. Highlights of Consolidated Performance
2. Segment Analysis
3. Forecasts for Fiscal 2021
4. Initiatives Going Forward & Appendices
6Segment Results
FY2020 FY2021 YoY Change
(mil yen) Q1 Results Q1 Results Amount %
Consolidated net sales 43,316 43,561 245 0.6%
Beauty care 42,082 42,445 363 0.9%
Real estate 636 530 (106) (16.7%)
Others 597 585 (11) (2.0%)
Operating income 2,006 4,307 2,301 114.7%
Beauty care 1,700 4,190 2,490 146.5%
Real estate 289 206 (83) (28.8%)
Others 4 13 8 161.3%
Reconciliations 11 (102) (113) -
Segment Results Summary
Beauty care Revenue increased year on year, due to an increase primarily in POLA overseas
Operating income increased significantly due to an increase in gross profit
and changes in POLA’s channel structure
Real estate Occupancy rate has been maintained at a high level
Others Revenue declined in the building maintenance business
7Beauty Care Business Results by Brands
FY2020 FY2021 YoY Change
(mil. yen) Q1 Results Q1 Results Amount %
Beauty care net sales 42,082 42,445 363 0.9%
POLA 25,057 26,330 1,273 5.1%
ORBIS 11,304 10,450 (854) (7.6%)
Jurlique 1,297 1,672 374 28.9%
H2O PLUS 284 167 (116) (41.1%)
Brands under
development
4,137 3,825 (312) (7.6%)
Beauty care
operating income
1,700 4,190 2,490 146.5%
POLA 1,592 4,123 2,531 158.9%
ORBIS 1,707 1,152 (554) (32.5%)
Jurlique (1,117) (441) 675 -
H2O PLUS (170) (184) (14) -
Brands under
development
(311) (459) (147) -
Note: Consolidated operating income and loss for each brand are shown for reference purposes only (figures are unaudited)
8Brand Analysis (1)
Q1 Result Topics
Purchase per customer for consignment sales recovered to the same level as in Renewal of POLA WRINKLE SHOT
the same period of the previous year, as a result of new product offerings, but
revenue declined due to a decrease in customer numbers
SERUM (January)
Revenue from domestic e-commerce increased substantially
Mainland China (+120% YoY) and duty-free sales in Korea performed strongly
Inbound traffic (tourists only) accounted for approximately 2% of revenue (down
3ppt YoY)
Q1 Results (mil. yen) YoY Change Quarterly net sales (mil. yen)
Net sales 26,330 5.1%
40,000
Operating income 4,123 158.9% 32,021
Key indicators 30,000 25,057 26,330
Sales ratio Consignment sales 68.0% 20,000
Overseas 20.0% 10,000
E-commerce 4.9%
0
Dept. store, B2B 7.1% 2019 1Q
Q1 2020 1Q
2020 Q1 20211Q
2021 Q1
Sales growth* Consignment sales down 3.9%
Overseas up 62.5% Quarterly operating income (mil. yen)
E-commerce up 114.9%
6,000 5,594
Dept. store, B2B down 27.9%
4,123
Consignment sales # of sales offices** 3,503 4,000
channel (down 277)
# of PB** 625 (down 11) 2,000 1,592
Purchase per customer* up 1.5%
0
# of customers* down 5.8% 2019 1Q
2019 Q1 20201Q
2020 Q1 20211Q
2021 Q1
Number of stores overseas** 112 (up 2) *YoY basis , ** vs Dec. 2020 9Topics
Structural reform of sales channels is progressing,
with overseas operations and domestic e-commerce driving POLA’s revenue growth
Domestic e-commerce
【Sales Ratio by Sales Channel】 Strengthened sales promotion
capitalizing on new products, achieving
Domestic a YoY increase in revenue of +115%
Domestic e-commerce 3.4% e-commerce 4.9%
Overseas 15.4% Overseas 20.0%
Department store and B2B 7.5%
Consignment sales 73.7%
Consignment Department
sales stores
FY2020 2021Q1
Also leading to enhanced sales in other channels
Overseas
Overseas Net Sales Trend In China, launched the new B.A in March,
5.3 bil. with progress exceeding the plan
(+63% YoY)
Net sales in China
Other
(Hong Kong,
3.2 bil.
Taiwan, etc.) grew by 2.2 times YoY
Travel Retail
国内EC
China
Launch event for the new B.A
2020Q1 2021Q1 (Yen)
10Brand Analysis (2)
Q1 Result Topics
New mail-order (e-commerce and catalog) customer acquisition Launched new brightening serum,
continued strongly at +38% YoY, but revenue declined due to the WHITE CLEAR ESSENCE
impact of a decrease in existing customers (February)
Focused on thorough communication in skincare, primarily for
ORBIS U. and new brightening products
Q1 Results (mil. yen) YoY Change Quarterly net sales (mil. yen)
Net sales 10,450 (7.6%) 20,000
Operating income 1,152 (32.5%)
15,000 12,317
Key indicators 11,304 10,450
10,000
Sales ratio E-commerce(1) 60.5%
(Proportion of domestic sales
63.1% 5,000
attributable to e-commerce)
Other mail-order 15.3% 0
2019 1Q
2019 Q1 20201Q
2020 Q1 2021 1Q
2021 Q1
Stores and overseas 24.2%
Quarterly operating income (mil. yen)
Sales growth* E-commerce up 2.3%
Other mail-order down 23.6% 4,000
Stores and overseas down 16.6%
3,000
Mail-order** purchase per customer* down 6.8%
2,000 1,719 1,707
Number of mail-order** customers* up 1.1% 1,152
1,000
ORBIS U series ratio of sales (2) 28%
(1) From FY2021, e-commerce includes sales 0
* YoY basis
from external e-commerce 2019 1Q
2019 Q1 1Q
2020 Q1 2021
2021 1Q
Q1
** include e-commerce and catalog
(2) Total of ORBIS U, U white, U encore, and U. 11Brand Analysis (3) Overseas Brands
Q1 Result Topics
Jurlique revenue increased and losses were improved, with growth in Jurlique
China, particularly in online sales, despite some store shutdowns due Renewal of major skincare products (March)
to lockdowns in Australia
H2O PLUS revenue fell significantly in the amenities business with
reduced deliveries due to shutdowns by business partners and
restrictions on operations Activating Water Essence +
Q1 Results (mil. yen) YoY Change(1) Quarterly net sales (mil. yen)
Jurlique Net sales 1,672 28.9%
OP income (441) 675 3,000
H2O PLUS Net sales 167 (41.1%) 2,220
1,840
OP income (184) (14) 1,582
1,500
Key indicators
Jurlique
Sales ratio Australia 17.6%
0
Hong Kong 13.4% 2019 1Q
Q1 2020
2020 1Q
Q1 2021
2021 1Q
Q1
Duty free 14.3% Quarterly operating income (mil. yen)
China 33.3%
Sales growth(2) Australia down 18.5% 2019
2019 1Q
Q1 2020 1Q
Q1 1Q
2021 Q1
0
Hong Kong down 10.2%
Duty free up 168.2% -500
China up 75.9% -626
-1,000
(1) For operating income, the YoY difference is shown as an amount (mil. yen) -981
(2) AUD basis, YoY
-1,500 -1,288
12Brand Analysis (4) Brands Under Development
Q1 Result Topics
THREE domestic e-commerce grew (+56% YoY) DECENCIA
Revenue from department stores and other offline channels Launched wrinkle-improving face mask
decreased, compared to the high level achieved in the previous year
(March)
DECENCIA revenue increased due to progressive new customer
acquisition since the previous year, but income declined due to the ayanasu wrinkle O/L face mask concentrate
continuation of proactive investment
Q1 Results (mil. yen) YoY Change Quarterly net sales (mil. yen)
Net sales 3,825 (7.6%)
6,000
(1)
Operating income (459) (147)
4,604
4,137 3,825
ACRO Net sales 2,101 (16.3%)
4,000
ACRO OP income(1) (659) (111)
THREE Net sales 1,686 (20.9%) 2,000
(1)
THREE OP income (228) (167)
DECENCIA Net sales 1,414 8.8% 0
Q1
2019 1Q 2020 1Q
2020 Q1 2021 1Q
2021 Q1
DECENCIA OP income 182 (2.6%)
Key indicators Quarterly operating income (mil. yen)
THREE 400
Sales ratio Domestic storefronts, etc. 59.5% 200 116
Domestic e-commerce 16.8% 0
Overseas 23.7% -200
(2)
Sales growth Domestic storefronts, etc. down 19.5% -400 -311
Domestic e-commerce up 55.7% -459
-600
2019 1Q
2019 Q1 2020 1Q
2020 Q1 2021 1Q
2021 Q1
Overseas down 43.1%
(1) The operating income YoY change is shown as the amount (mil. yen)
(2) YoY basis Note: Also includes OEM business. 131. Highlights of Consolidated Performance
2. Segment Analysis
3. Forecasts for Fiscal 2021
4. Initiatives Going Forward & Appendices
14Forecasts for Fiscal 2021 (Unchanged)
FY2020 YoY Change FY2021 YoY Change
(mil. yen) Full-year Results Amount % Full-year Plan Amount %
Consol. net sales 176,311 (43,609) (19.8%) 190,000 13,688 7.8%
Beauty care 171,658 (43,228) (20.1%) 185,900 14,241 8.3%
Real estate 2,291 (327) (12.5%) 2,000 (291) (12.7%)
Others 2,361 (53) (2.2%) 2,100 (261) (11.1%)
OP income 13,752 (17,384) (55.8%) 19,000 5,247 38.2%
Beauty care 12,965 (17,228) (57.1%) 18,850 5,884 45.4%
Real estate 710 (310) (30.4%) 600 (110) (15.6%)
Others 128 (2) (1.8%) 50 (78) (61.0%)
Reconciliations (51) 156 - (500) (448) -
Ordinary income 12,579 (18,051) (58.9%) 19,000 6,420 51.0%
Net income
attributable to 4,632 (15,062) (76.5%) 11,300 6,667 144.0%
owners of parent
Assumed exchange rates : 1.00 AUD = 76 JPY (PY 73.66) 1.00 USD = 107 JPY (PY 106.81) 1.00 CNY = 15.4 JPY (PY 15.48)
FY2020 FY2021 (plan)
Shareholder Annual ¥50 Annual ¥51 (Interim ¥20, Year-end ¥31)
returns Consol. Payout ratio 238.8% Consol. payout ratio 99.8%
Capital
investment ¥8,464 mil. ¥11,000 mil. - ¥13,000 mil.
Depreciation ¥7,255 mil. ¥7,000 mil. - ¥8,000 mil.
151. Highlights of Consolidated Performance
2. Segment Analysis
3. Forecasts for Fiscal 2021
4. Initiatives Going Forward & Appendices
16Initiatives for FY2021 Q2 Onward
Accelerate growth in overseas business
Focus on promoting the new B.A, which is performing strongly,
and strive to further accelerate growth in both storefront and e-commerce
operations through strategic additional investment
Expand customer touchpoints, planning the opening of several new duty-free stores
in Hainan during the second half
Make investment to build a customer base in domestic e-commerce over the
medium to long term, and refine segment communication to enhance LTV
Launch a Wrinkle Shot limited-edition kit to reinvigorate customer activity (June)
Launch the first multifunctional UV product that also provides brightening care in the
White Shot series (April), and strengthen sales promotion in anticipation of seasonal
demand for brightening products, through the coordination of advertising and online
events (Left) POLA WRINKLE SHOT SEASON SPECIAL KIT L
(Right) POLA WHITE SHOT SKIN PROTECTOR DX
Launch cocktail graphy, the first ORBIS personalized skincare product (April)
A flat-rate service (once a month) that provides skin measurement through an
IoT device, and delivers serum to customers
Launch WRINKLE WHITE UV PROTECTOR (April), a sunscreen that brightens the
skin and improves wrinkles, and expand skincare share within ORBIS
Commence periodic sales, and increase the repeat purchasing rate through the cocktail graphy
promotion of inducement to periodic sales
Promote shopping-around to increase the purchase per customer of existing
customers
WRINKLE WHITE
UV PROTECTOR
17Initiatives for FY2021 Q2 Onward
Overseas Brands
Renew the major skincare products, and develop them as hero products
Focus on digital-based marketing, including livestreaming by KOL
Activating Water Essence +
In e-commerce, focus on acquiring new, high-LTV customers through
Clean Beauty skincare
Brands Under Development
For THREE, expand Holistic Care products, and launch new oil gel-
type cleansing products from the BALANCING line (May)
THREE BALANCING CLEANSING OIL GEL
E-commerce-only gift promotions, launch kit products, and strengthen
e-commerce sales promotions
Shift online to improve the business structure, reduce fixed costs and
improve profitability (E-commerce limited)
ITRIM Elementary Facial Trial Kit
Improve the efficiency of customer acquisition, optimize the allocation of
advertising expenses, and enhance profitability
18(Appendix) About POLA ORBIS Group
Beauty care is the core business of the Group, and
10 different cosmetics brands are operated under the Group umbrella
FY2020
Consol. Net Sales
¥176.3 bil. Overseas Flagship Brands under
Brands Brands development
¥20,000
High Prestige
Price Range
¥10,000
Prestige
¥5,000
Middle-tier
Acquired as a subsidiary in April 2021
Beauty care business 98%
¥1,000
Real estate business 1% Mass-market
Other businesses 1%
(building maintenance business) POLA CHEMICAL INDUSTRIES
Our strengths
Multi-brand strategy Meeting diversified needs of customers
Focus on skincare products High customer repeat ratio
Flagship brands, POLA and ORBIS own and operate
Strong relationships with customers
through their own unique sales channels
19(Appendix) Beauty Care Business Brand Portfolio
Sales
ratio* Brand Concept and products Price Main sales channel
High-prestige skincare Approx. JP: Consignment sales, department stores and e-commerce
60% Leading-edge technology in aging- ¥10,000 Overseas: Department stores, directly-operated stores, DFS(1) and
Flagship Since 1929 care and skin-brightening fields or higher cross-border e-commerce
brands
Approx. JP: Mail-order (e-commerce and catalog)
Aging-care brand to draw out
26% people’s intrinsic beauty
¥1,000~ and directly-operated stores
Since 1984 ¥3,000 Overseas: E-commerce, cross-border e-commerce, and DFS(1)
Approx. AU: Department stores, directly-operated stores and e-commerce
Premium natural skincare brand
4% from Australia
¥5,000 Overseas: Department stores, directly-operated stores, DFS(1)
Acquired in 2012 or higher and cross-border e-commerce
Overseas
Brands Approx.
Skincare with concept of innovation ¥4,000
1% US: E-commerce, hotel amenities
Acquired in 2011
and power of pure water not sold in
Japan
JP: Department stores, directly-operated stores
Skincare made with natural Approx.
and e-commerce
ingredients from Japan and ¥5,000
Since 2009 fashion-forward make-up Overseas: Department stores, DFS(1) and
or higher
Operated by ACRO INC.
cross-border e-commerce
Approx. JP: Department stores and e-commerce
High prestige quality makeup from
¥5,000~
Since 2018 Japan Overseas: DFS(1) and cross-border e-commerce
¥10,000
Brands Premium skincare made from finely Approx. JP: Department stores and e-commerce
under Since 2018 selected organic ingredients ¥20,000 Overseas: DFS(1) and cross-border e-commerce
9%
develop
Approx. JP: Department stores, directly-operated stores
-ment Industry’s first men’s cosmetics and e-commerce
¥2,000~
focusing on makeup
Since 2018 ¥12,000 Overseas: DFS(1) and cross-border e-commerce
Approx. JP: E-commerce, department store
Skincare for sensitive skin ¥5,000~
Since 2007 Overseas: Cross-border e-commerce
¥10,000
Approx.
Personalized beauty care brand
¥6,000~ JP: E-commerce
operated by tricot, Inc.
Acquired in 2021 ¥10,000
*Sales ratio in the beauty care business as of FY2020. FUJIMI is excluded, as it was included in the scope of consolidation from April 2021 (1) Duty free stores 20(Appendix) Improvement in Capital Efficiency
and Shareholder Returns
Initiatives to Improve Capital Efficiency
ROE movement
(%)
Operating income CAGR30% 16.0 14.2
Achieve net income growth
EPS which is higher than operating
Target for 2023 (Earnings per share) income growth by decreasing 12.0 10.4
9.0
ROE 12%
(Return on equity) = BPS
overseas losses
Improve shareholder return
8.0
4.3
5.9
7.8
through dividends 4.3
(Book value per share) Optimize balance sheet 4.0 2.6
Investment for future growth
0.0
2013 2014 2015 2016 2017 2018 2019 2020
Improvement of Shareholder Return
238.8%
Basic Policy : 160 200%
With a policy of consolidated payout ratio of 60% or higher, 210.9% 180%
160%
enhance shareholder return by realizing stable profit growth 120
140%
Purchases of treasury stock shall be considered based on our 120%
99.6% 57.1% 130.3%
investment strategies, as well as market prices and liquidity of 80 100%
the Company’s shares 58.8%
67.7% 99.8% 80%
41.4% 60%
40
40%
Dividends forecast for FY2021: 41.5% 20%
- Dividend per share : ¥51 (Interim ¥20, Year-end ¥31) 0 0%
- Consol. payout ratio : 99.8% (yen)
2012 2013 2014 2015 2016 2017 2018 2019 2020 2021
(Plan)
Dividends Special Dividends Payout ratio
21(Appendix) 2021 – 2023 Medium-term Management Plan
Management Indicators for 2023
Consolidated net sales ⇒ ¥215.0 to 225.0 bil. in FY2023
CAGR 7 to 9%
Overseas sales ratio ⇒ 20 to 25% in FY2023 (15% in FY2020)
Net Sales
CAGR 20 to 25%
Domestic e-commerce
sales ratio ⇒ 30% in FY2023 (24% in FY2020)
Operating margin ⇒ 15% or higher in FY2023
Operating
Income
Operating income ⇒ CAGR 30% or higher
Capital
ROE ⇒ 12% in FY2023
Efficiency
Shareholder
Consolidated payout ratio ⇒ 60% or higher
Returns
Strategy 1. Evolve domestic direct selling
Strategy 2. Grow overseas businesses profitably
Strategy 3. Profit contribution from brands under development
Strategy 4. Strengthen operations
Strategy 5. Expand new brands and domains of “beauty”
22(Appendix) Beauty Care Business Results
for FY2018 – FY2020 by Brands
FY2018 FY2019 FY2020 2019 vs 2020 YoY Change
(mil. yen) Results Results Results Amount %
Consolidated net sales 248,574 219,920 176,311 (43,609) (19.8%)
Beauty care
net sales
231,207 214,886 171,658 (43,228) (20.1%)
POLA 150,183 135,502 102,888 (32,613) (24.1%)
ORBIS 51,051 50,726 45,415 (5,310) (10.5%)
Jurlique 10,386 7,765 6,444 (1,320) (17.0%)
H2O PLUS 2,041 1,470 722 (747) (50.9%)
Brands under development 17,544 19,421 16,186 (3,235) (16.7%)
Consol. operating income 39,496 31,137 13,752 (17,384) (55.8%)
Beauty care
operating income
38,294 30,193 12,965 (17,228) (57.1%)
POLA 32,574 25,529 10,927 (14,602) (57.2%)
ORBIS 9,340 9,252 7,329 (1,923) (20.8%)
Jurlique (3,763) (2,968) (2,489) 479 -
H2O PLUS (552) (825) (724) 100 -
Brands under development 695 (794) (2,076) (1,282) -
Note : Consolidated operating income and loss for each brand are shown for reference purpose only (figures are unaudited)
23You can also read