Fluorescence biosensor for real-time interaction dynamics of host proteins with HIV-1 capsid tubes - bioRxiv
←
→
Page content transcription
If your browser does not render page correctly, please read the page content below
bioRxiv preprint first posted online Apr. 30, 2019; doi: http://dx.doi.org/10.1101/619841. The copyright holder for this preprint
(which was not peer-reviewed) is the author/funder, who has granted bioRxiv a license to display the preprint in perpetuity.
                              It is made available under a CC-BY-NC-ND 4.0 International license.

     Fluorescence biosensor for real-time interaction dynamics of
     host proteins with HIV-1 capsid tubes
     Derrick Lau1, James Walsh1, Wang Peng1, Vaibhav Shah1, Stuart Turville2, David Jacques1
     and Till Böcking1,*

     1. EMBL Australia Node in Single Molecule Science and ARC Centre of Excellence in
     Advanced Molecular Imaging, School of Medical Sciences, UNSW Sydney, NSW 2052,
     Australia

     2. The Kirby Institute, UNSW Sydney, NSW 2052, Australia

     * Corresponding author: till.boecking@unsw.edu.au

     Keywords: HIV capsid, TIRF, binding, stoichiometry, kinetics, microfluidics

     Abstract
     The human immunodeficiency virus 1 (HIV-1) capsid serves as a binding platform for
     proteins and small molecules from the host cell that regulate various steps in the virus life
     cycle. However, there are currently no quantitative methods that use assembled capsid
     lattices for measuring host-pathogen interaction dynamics. Here we developed a single
     molecule fluorescence biosensor using self-assembled capsid tubes as biorecognition
     elements and imaged capsid binders using total internal reflection fluorescence microscopy
     in a microfluidic setup. The method is highly sensitive in its ability to observe and quantify
     binding, obtain dissociation constants, extract kinetics with an extended application of using
     more complex analytes that can accelerate characterisation of novel capsid binders.

     Background
     HIV-1 establishes infection by integrating its genome into a host chromosome. In order to
     access the DNA of the target cell, the viral genome must travel across the cytoplasm and
     enter the nucleus, while avoiding recognition and degradation by the host.1 The vehicle
     responsible for conveying and protecting the genome on this journey is the HIV-1 capsid, a
     metastable nanocontainer comprising ~1500 copies of the capsid protein (CA) that assemble
     into a lattice of hexamers and pentamers to form a fullerene cone. While the capsid
     physically excludes host macromolecules from accessing the viral genome, its functions are
     more nuanced than a simple inert protective shell. In addition to avoiding cell autonomous
     immune responses, the capsid has roles in cytoplasmic trafficking,2 reverse transcription,3
     nuclear entry, and integration site selection.4 It must also release the viral genome prior to
     integration in an enigmatic process called ‘uncoating’ (see Review5).

     While the CA lattice persists within the target cell, the capsid represents the dominant host-
     pathogen interface. In this role, the lattice represents a binding platform for the recruitment of
     numerous host-derived molecules that the virus hijacks to mediate the above processes.
     Three binding sites on CA have been characterised largely using structural approaches, and
     each shows affinity towards at least two host cofactors. These sites are: (1) the CypA-
     binding loop, comprising residues 85–93 which form a flexible structure on the capsid
     exterior responsible for recruiting cyclophilin A (CypA)6, 7 and the nucleoporin Nup3588; (2)
     the FG-binding site, a pocket on the N-terminal domain of CA that binds to phenylalanine-
     glycine motifs of cleavage and polyadenylation specificity factor subunit 6 (CPSF6)9, 10 and a
     second nucleoporin, Nup15310; and (3) the central arginine pore formed by a cluster of five
     or six symmetry-related copies of Arg18 that recruit deoxyribonucleotides (dNTPs) and
     inositol hexakisphosphate (IP6).11, 12 The CypA-binding loop and FG-binding site are both
     believed to play roles in nuclear import and evasion of immune recognition. The central
     arginine pore, on the other hand, is believed to play roles in selective import of dNTPs for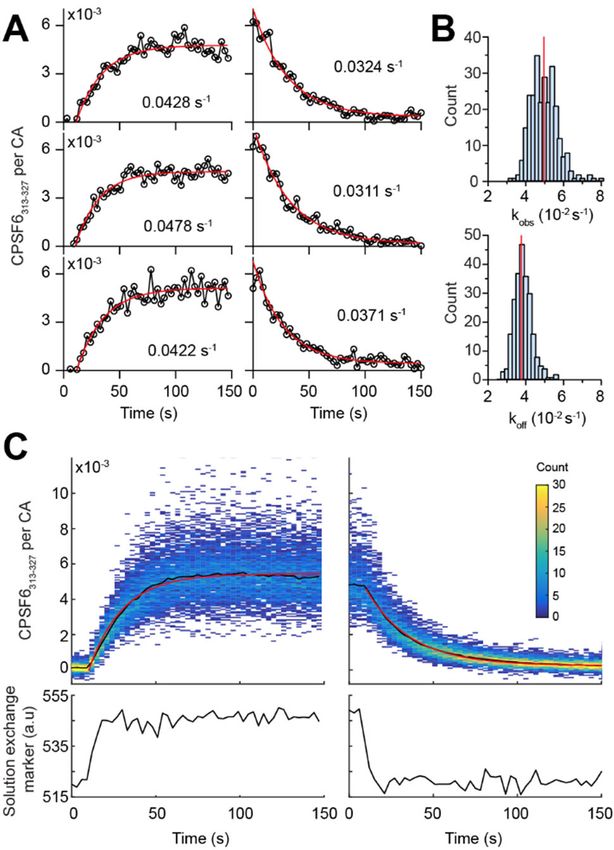
bioRxiv preprint first posted online Apr. 30, 2019; doi: http://dx.doi.org/10.1101/619841. The copyright holder for this preprint
(which was not peer-reviewed) is the author/funder, who has granted bioRxiv a license to display the preprint in perpetuity.
                              It is made available under a CC-BY-NC-ND 4.0 International license.

     reverse transcription and mediating capsid stability through recruitment of polyanions such
     as IP6. Importantly, the FG-binding site and the arginine pore are only formed in the
     assembled CA lattice as they contain structural elements that are contributed by multiple
     adjacent CA monomers. In order to study capsid-binding compounds, it is therefore
     necessary to use a system that recapitulates the assembled CA lattice.

     Current capsid binding assays are usually based on pull-down experiments using capsid as
     bait from either isolated cores,13-15 in vitro assembled CA-NC tubes,16, 17 or disulfide cross-
     linked CA A14C/E45C tubes.18 These methods are not quantitative and suffer from false
     positives (due to non-specific interactions) and false negatives (due to weak or transient
     interactions). Quantitative methods such as isothermal titration calorimetry and surface
     plasmon resonance are possible using in vitro assembled soluble CA
     A14C/E45C/W184A/M185A hexamers,19, 20 but these methods are sample-intense and not
     all CA interfaces (that would otherwise be present in fully assembled CA lattice for cofactor
     binding) are represented in the soluble hexamer.

     Here we propose to overcome the limitations of existing methods with the design of an
     interface for capsid binders that has the sensitivity to visualise and quantify binding events at
     the single molecule level using total internal reflection fluorescence microscopy (TIRFM).
     The biorecognition element consists of cross-linked and fluorescent CA tubes that are grown
     on the sensor surface inside a microfluidic device. The biosensor allows accurate
     measurements of interaction kinetics, affinity and stoichiometry and is compatible with both
     purified recombinant CA-binders and complex samples such as cell-free expression lysates
     enabling characterisation of binders that might otherwise be difficult to isolate.

     Materials and methods
     Production and labelling of recombinant proteins. HIV-1 CA (wild type, CA A14C/E45C
     and CA K158C) was expressed in bacteria and purified as previously described.21 CA
     K158C was labelled as described.22 CypA was expressed in bacteria, purified and labelled
     as described.22

     Fluorescence labelling of CPSF6313-327. A synthetic peptide from CPSF6 comprising
     residues 313-327 with a C-terminal cysteine (PVLFPGQPFGQPPLGC, Genscript) was
     dissolved (1.85 mM) in 50 mM Tris buffer (pH 8) and reacted with Alexa Fluor 488-C5-
     maleimide (1.85 mM) for 10 min. Thin-layer chromatography (silica gel, methanol:water, 1:1,
     v/v) showed near quantitative incorporation of the fluorescent dye. CPSF6313-327-AF488 was
     flash frozen and stored at -40 °C. The peptide was diluted to 50 μM with buffer (50 mM Tris,
     pH 8, 1 mM DTT) prior to use.

     Negative staining electron microscopy. CA assembly mixture (1 M NaCl, overnight, 4°C)
     was applied to a 200 mesh Cu grid coated with carbon and formvar (Ted Pella) and wicked
     dry. The sample was stained with a drop of uranyl acetate (2% w/v) and wicked dry
     immediately. This staining process was repeated three times and the grid was air dried.
     Micrographs were collected using a FEI Tecnai G2 20 or JEOL1400 transmission electron
     microscope. Tubes diameters were measured using ImageJ.

     Fabrication of microfluidic devices. An aluminium lithography mould was used to cast
     poly-dimethylsiloxane microfluidic devices with five parallel flow channels (1000x800x60 μm,
     LxWxH). The PDMS devices were treated with an air plasma (3 min) and annealed to clean
     glass coverslips.

     Sensor surface modification and in situ assembly of CA tubes. Flow channels were
     incubated with a solution of PLL(20)-g[3.5]-PEG(2)/PEG(3.4)-biotin(20%) (1 mg/mL, SuSos
     AG) for 30 min. The channels were washed with water and incubated with a streptavidin (0.2
     mg/mL) in blocking buffer (20 mM Tris pH 7.5, 0.4 mM EDTA, 50 mM NaCl, 0.006% NaN3,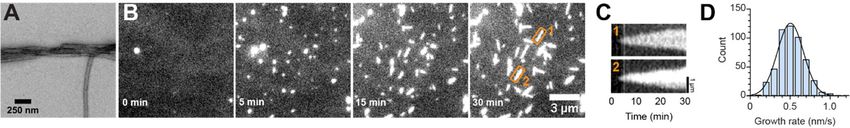
bioRxiv preprint first posted online Apr. 30, 2019; doi: http://dx.doi.org/10.1101/619841. The copyright holder for this preprint
(which was not peer-reviewed) is the author/funder, who has granted bioRxiv a license to display the preprint in perpetuity.
                              It is made available under a CC-BY-NC-ND 4.0 International license.

     0.025% Tween 20, 0.2 mg/mL BSA) for at least 20 min. Tubing was inserted into the channel
     ports and the outlet tubing was connected to a syringe pump operated in withdraw mode at a
     flow rate of 30 μL/min. Channels were rinsed with 50 μL wash buffer (50 mM Tris, pH 8, 150
     mM NaCl), filled with a solution (20 μL, 1:3000 dilution) of biotinylated α-mouse antibody
     (Jackson ImmunoResearch, 115-066-071) and α-CA antibody (Advanced Biotechnologies,
     13-102-100) and again rinsed with wash buffer (50 μL). To grow CA tubes on the sensor
     surface, a buffer solution (50 mM Tris, pH 8.0, 2 mM DTT, 0.02% NaN3) containing CA
     A14C/E45C (76 µM) and labelled CA K158C (AF488 or AF647, 4 µM) was mixed with high
     salt buffer (50 mM Tris, pH 8.0, 5 M NaCl) to give a final NaCl concentration of 500 mM,
     immediately injected into the flow cell and incubated for 30 min. CypA (10 µM) was added to
     the assembly mixture to reduce tube bundling. The flow channel was then rinsed with wash
     buffer (50 μL). Before injection of analyte, the flow channel was rinsed with 100 µL of
     imaging buffer (50 mM Tris, pH 8, 150 mM NaCl, 2 mM Trolox, 2.5 mM protocatechuic acid,
     0.25 U/mL protocatechuate-3,4-dioxygenase).

     Total internal reflection fluorescence (TIRF) microscopy and image analysis. TIRF
     images were acquired (typical exposure time 10 ms) using an inverted microscope equipped
     with a Nikon 100× CFI Apochromat TIRF oil immersion objective (1.49 NA), a NicoLase laser
     system23 and two Andor iXon 888 EMCCD cameras. Images were analysed using home-
     written image analysis software for detection of tubes and extraction of binding/dissociation
     traces (https://github.com/lilbutsa/JIM-Immobilized-Microscopy-Suite).

     Equilibrium binding analysis to determine KD and stoichiometry of CypA binding to
     CA tubes. CypA solutions (1–40 μM) were prepared with CypA-AF647 (1 μM) and
     unlabelled CypA (added to make up the desired final concentration) in imaging buffer. The
     CypA solution (30 µL) was drawn into the channel (100 µL/min) and incubated for 1 min.
     TIRF images were recorded in several fields of view (FOV) in both channels using sequential
     excitation to measure the signals associated with CA tubes (491 nm) and co-localised CypA
     (639 nm). Subsequently the CypA solution was washed out with imaging buffer (100 μL).
     Images were analysed to determine the CypA:CA molar ratio reached at equilibrium for each
     CypA concentration. Binding curves were obtained by plotting the best fit molar binding ratio
     as a function of CypA concentration. The following equation was used for model fitting to
     obtain estimates for the dissociation constant and the maximum binding ratio: R(eq) =
     [CypA] × R(max) / ([CypA] + KD), where R(eq) is the CypA:CA ratio at equilibrium for a given
     CypA concentration, [CypA] is the concentration of CypA, R(max) is the CypA:CA molar ratio
     at saturation and KD is the dissociation constant.

     Kinetics analysis of CPSF6313-327 binding to CA tubes. Imaging buffer containing the
     analyte (CPSF6313-327-AF488, 250 nM) and a free dye as a marker for solution exchange in
     the flow channel (Alexa Fluor 647, 200 nM) was injected into the flow channel (100 µL/min)
     and subsequently washed out with imaging buffer (100 µL/min) while recording the CA
     K158C-AF647 and CPSF6313-327-AF488 channels by time-lapse TIRF imaging with a frame
     rate 1/3 s-1 (150 s for wash-in and 300 s for wash-out).

     Biosensor assay of capsid-binding proteins produced by cell-free expression. The
     open reading frame for CPSF6 (isoform 2) was cloned into a vector for cell free expression
     of the protein with His6-GFP fused to its N-terminus. In vitro expression of proteins was
     initiated by adding plasmid (60 nM) to Leishmania extract24 supplemented with RNAse OUT
     (Invitrogen) and the mixture was incubated in the dark at 28 °C for 2.5 hours. Protein
     concentrations were estimated using single molecule spectroscopy with recombinant eGFP
     as a standard.25 The cell-free expression mixture was diluted with wash buffer
     (supplemented with 2 mM Trolox, 2.5 mM protocatechuic acid and 0.25 U/mL
     protocatechuate-3,4-dioxygenase) to a final concentration of 370 nM GFP-tagged protein.
     This solution (40 µL) was drawn into the flow channel (100 µL/min) and subsequently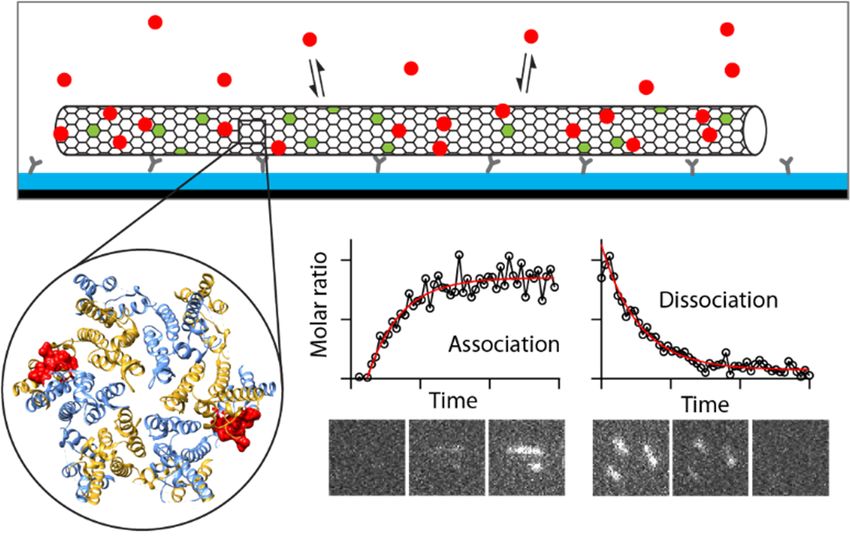
bioRxiv preprint first posted online Apr. 30, 2019; doi: http://dx.doi.org/10.1101/619841. The copyright holder for this preprint
(which was not peer-reviewed) is the author/funder, who has granted bioRxiv a license to display the preprint in perpetuity.
                              It is made available under a CC-BY-NC-ND 4.0 International license.

     washed out with imaging buffer (500 µL at 100 µL/min) while recording the CA K158C-
     AF647 channel and the GFP channel by time-lapse TIRF imaging.

     Results and Discussion
     Biosensor design. The design of the total internal reflection fluorescence (TIRF) imaging-
     based sensor for measuring the interactions between HIV-1 capsid-binding molecules and
     self-assembled CA lattices in real time is shown in Figure 1. The sensor interface is
     assembled on the surface of a glass coverslip that forms the bottom of a microfluidic channel
     device fabricated by soft lithography in PDMS. Cross-linked and fluorescent CA hexamer
     tubes are then self-assembled in situ and function as the biorecognition elements of the
     sensor. An analyte solution containing a (putative) capsid-binding species labelled with a
     different fluorescent dye is flowed through the channel while recording dual colour
     fluorescence movies using a TIRF microscope equipped with CCD cameras, whereby
     binding (or dissociation) of analytes can be visualised on individual tubes from the
     appearance (or disappearance) of fluorescence in the analyte channel. We then use single-
     molecule analysis of the fluorescence movies to extract kinetic parameters of the interaction.
     In the following, we first present the development of the sensor interface followed by
     applications of the sensor to measure binding affinity, stoichiometry and kinetics of host
     proteins known to interact with the HIV-1 capsid to promote infection.

     Figure 1. Schematic of the interface design. A. The set-up consists of a TIRF microscope for real-
     time observation of binding events on the sensor surface assembled on a glass coverslip located at
     the bottom of a PDMS microfluidic device for analyte delivery. B. Fluorescent tubes self-assembled
     from HIV-1 CA serve as the receptor for capsid-binding analytes. Binding and dissociation of analytes
     is detected by the appearance and disappearance of the analyte signal co-localised with each
     individual tube. C. The sensor surface is modified with an anti-fouling layer and antibodies for
     immobilisation of fluorescent CA tubes.

     Growth of fluorescent capsid tubes on the sensor surface as biorecognition elements.
     We used self-assembly of recombinant CA A14C/E45C at high salt concentrations to
     produce tubular lattices of disulfide cross-linked CA hexamers26 as biorecognition elements
     representing the HIV-1 capsid.18 These stabilised tubes were rendered fluorescent by co-
     assembly with a small fraction of CA K158C reacted with a fluorophore at the engineered
     cysteine (Supplementary Figure S1 and S2). This co-assembly reaction also yielded long
     tubes that aggregated into bundles in solution (Figure 2A), a process known to be driven by
     interactions between hydrophobic residues (primarily located in the CypA loop of CA) on the
     outer tube surfaces.27 Initial attempts to deposit pre-assembled CA tubes onto surfaces
     failed, presumably because of excessive aggregation into large clusters.

     Next, we investigated methods to grow tubes directly on the biosensor surface. The glass
     surface was first passivated by physisorption of a copolymer of poly(L-lysine) and
     biotinylated poly(ethylene glycol) (PLL-PEG-biotin) to resist non-specific adsorption of
     biomolecules from solution (Figure 1C). The PLL-PEG-biotin surface was further modified
     with streptavidin followed by a biotinylated secondary antibody (anti-mouse IgG F(ab’)2
     fragment) for capture of a primary mouse antibody directed against the exterior surface of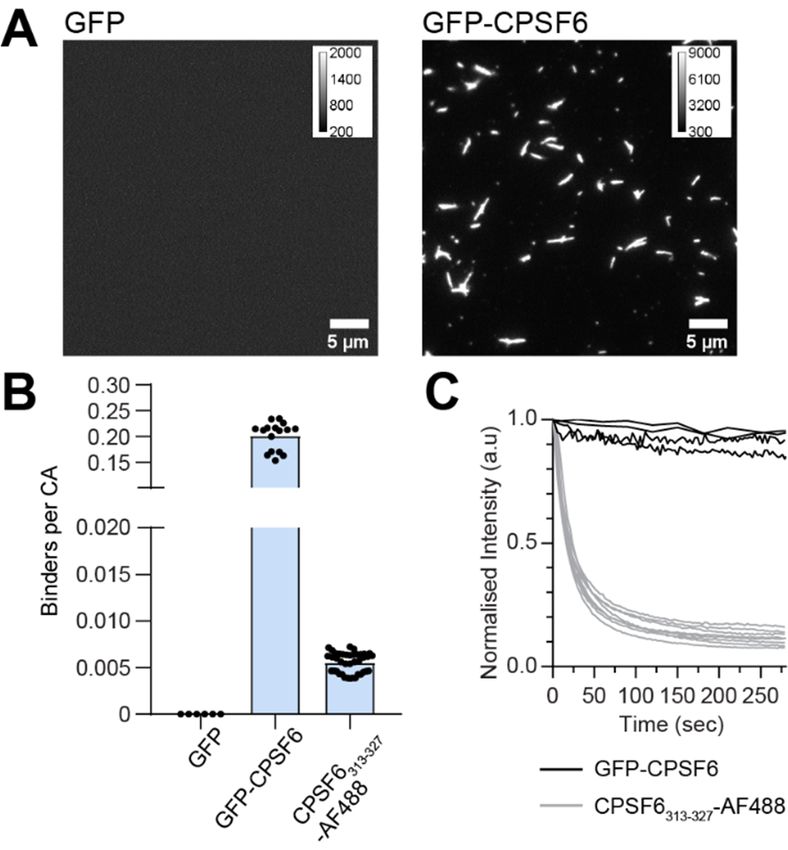
bioRxiv preprint first posted online Apr. 30, 2019; doi: http://dx.doi.org/10.1101/619841. The copyright holder for this preprint
(which was not peer-reviewed) is the author/funder, who has granted bioRxiv a license to display the preprint in perpetuity.
                              It is made available under a CC-BY-NC-ND 4.0 International license.

     CA.28 Injection of an assembly mixture containing CA A14C/E45C and labelled CA K158C
     into the flow channel followed by incubation (30 min) resulted in the growth of capsid tubes
     on the modified surface, which appeared as fluorescent lines in the TIRF image
     (Supplementary Figure S3), which could easily be distinguished from background on the
     basis of shape and intensity. Fluorescent lines were not observed on surfaces without
     antibodies (Supplementary Figure S3A) indicating that tube capture was specific. Time-lapse
     imaging of the assembly reaction on antibody-modified surfaces revealed the tube growth
     process (Figure 2B). Capsid seeds (presumably small CA assemblies formed in solution)
     were captured by the antibodies onto the surface where they appeared as bright fluorescent
     punctae within 5 min of injecting CA assembly solution into the flow channel. Over the next
     20 min these seeds grew bidirectionally by addition of CA from solution to the ends of the
     lattice into ~ 1 μm long tubes, consistent with previous observations.28 The growth kinetics
     could be determined at the level of single tubes from kymographs generated along the tube
     axis as shown for two tubes in Figure 2C, whereby the growth rate was given by the slopes
     of the kymograph edges. Under the conditions used here (500 mM NaCl), capsid tubes ends
     grew at a rate of 0.52 ± 0.17 nm/s in each direction (Figure 2D).

     Figure 2. Growth of fluorescent CA tubes on surfaces. A. Negative staining EM image of CA
     tubes assembled from A14C/E45C:K158C-AF568 (72 μM:8 μM). B. Time-lapse TIRF images showing
     the growth of immobilised fluorescent tubes assembled from A14C/E45C:K158C-AF488 (76 μM:4 μM)
     over 30 min. C. Kymographs for two selected tubes highlighted in the last image in panel B. D.
     Histogram of growth rates determined from the slopes of the edges in kymographs (N = 515 tubes).

     We observed that the fluorescence intensity along the tubes varied considerably between
     tubes in the field of view (Supplementary Figure S3B). On the basis of the narrow distribution
     of tube diameters seen in the negative staining EM images (Figure 3), we speculated that
     this variation resulted from the growth of multiple tubes bundled together or of multiwalled
     tubes 28 rather than from the growth of individual tubes with varying diameters. It has been
     shown that wild type CA tube bundling can be minimised by addition of CypA, an 18 kDa
     globular protein that binds reversibly to the outside of CA tubes.27 Assembly of tubes in
     solution from CA A14C/E45C and labelled CA K158C in the presence of substoichiometric
     amounts of CypA yielded primarily single tubes with a diameter of 66.9 ± 6.2 nm (slightly
     larger than tubes assembled in the absence of CypA with a diameter of 57.9 ± 5.8 nm) as
     determined by negative staining electron microscopy (Figure 3A and B). Some of the tubes
     appeared to have closed ends. Short tubular or conical structures were also observed.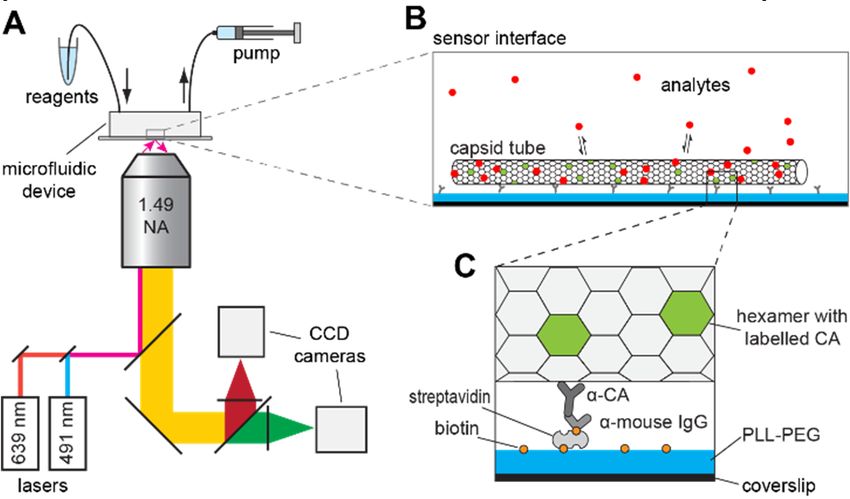
bioRxiv preprint first posted online Apr. 30, 2019; doi: http://dx.doi.org/10.1101/619841. The copyright holder for this preprint
(which was not peer-reviewed) is the author/funder, who has granted bioRxiv a license to display the preprint in perpetuity.
                              It is made available under a CC-BY-NC-ND 4.0 International license.

     Figure 3. Growth of individual tubes in the presence of CypA. A. Negative staining EM image of
     CA structures assembled from A14C/E45C:K158C-AF488 (76 μM:4 μM) in the presence of CypA (10
     μM). B. Boxplots of tube diameters measured from EM images from assembly of CA A14C/E45C and
     labelled K158C in the absence (N = 270) and presence (N = 235) of CypA. C. Histograms of the
     number of fluorophores per unit length (tubes and bundles) grown on the biosensor surface in the
     absence (N = 10941) and presence of CypA (N = 49839). The red line indicates the mean number of
     fluorophores per unit length.

     Next, we tested whether addition of CypA during CA tube growth on surfaces could suppress
     tube bundling. We grew tubes on surfaces in the absence and presence of CypA and
     identified fluorescent lines in the TIRF images using an automated image analysis algorithm
     (Supplementary Figure S4). Analysis of >10000 line-shaped objects showed a linear
     relationship between the number of fluorophores versus length for both conditions
     (Supplementary Figure S5), allowing us to represent the data as distributions of fluorophores
     per unit length. Assembly of CA A14C/E45C and labelled CA K158C in the presence of
     CypA yielded line-shaped objects with a narrow distribution centered at 223 fluorophores/µm
     (Figure 3C, right); we assign this linear density of label incorporation to that of single CA
     tubes grown on the sensor surface. While the majority of objects in this condition were single
     tubes, the asymmetry of the distribution with a shoulder at higher linear densities indicated
     that some tube bundles may still be present. In contrast, the distribution of fluorophores per
     unit length for elongated objects assembled in the absence of CypA was broad with a peak
     at 604 fluorophores/µm (Figure 3C, left), indicating that most objects assembled in the
     absence of CypA represent tube bundles with on average 3 tubes. Taken together our data
     suggest that CypA present during tube growth effectively suppresses tube bundling, allowing
     us to prepare surfaces with predominantly single tubes. On the basis of the number of
     fluorophores per unit length measurement for single tubes and the packing of CA molecules
     in the hexameric lattice (Supplementary Figure S6), we estimated that approximately 1:50–
     1:60 CA molecules in the lattice were labelled with a fluorophore, confirming that labelled CA
     K158C was incorporated less efficiently into the lattice than unlabelled CA. This ratio
     provided a calibration factor to determine the stoichiometry of analyte binding to capsid
     tubes in the biosensing experiments described below. Overall our experiments defined
     parameters for growing individual fluorescent tubes of uniform intensity on passivated
     surfaces as biorecognition elements, whereby the ability to measure the growth kinetics
     could also be exploited to test the effects of HIV-1 capsid assembly inhibitors.29

     Biosensor assay to measure CypA equilibrium binding curves. In the first application of
     our biosensor, we used equilibrium binding measurements to determine the dissociation
     constant (KD) and stoichiometry of the CypA-CA complex on CA tubes. CypA is an abundant
     host cell protein that binds to the CypA binding loop located on the N-terminal domain of CA
bioRxiv preprint first posted online Apr. 30, 2019; doi: http://dx.doi.org/10.1101/619841. The copyright holder for this preprint
(which was not peer-reviewed) is the author/funder, who has granted bioRxiv a license to display the preprint in perpetuity.
It is made available under a CC-BY-NC-ND 4.0 International license.
(Figure 4D). Recruitment of multiple CypA molecules onto the outside of the HIV-1 capsid
after host cell entry promotes HIV-1 infection30 but the precise binding mode of CypA to
assembled CA lattices remains unclear. A solution containing CypA labelled at Cys51 with
Alexa Fluor 647 was injected into the flow channel while imaging the fluorescence signals of
the cross-linked CA tubes and CypA by dual colour TIRF microscopy. CypA fluorescence
appeared rapidly in the CypA channel at locations corresponding to immobilised tubes and
reached a constant intensity upon reaching binding equilibrium (Figure 4A). The CypA
solution was then washed out and the cycle was repeated for a range of CypA
concentrations (1–40 μM). Using automated image analysis we then extracted the number of
CA and CypA molecules associated with each tube from the fluorescence intensities in the
respective channels (Figure 4B). At any given concentration, the number of bound CypA
molecules increased linearly with the number of CA molecules in a tube, i.e. longer tubes
bound proportionally more CypA molecules (see example tubes T1, T2 and T3 highlighted in
the merged image of Figure 4A and in the inset of Figure 4B). We then calculated the molar
binding ratio at each concentration (see Figure 4B for details) to obtain an equilibrium
binding curve (Figure 4C). Curve fitting with an equilibrium binding model yielded a KD of 8.0
µM and a stoichiometry of 0.5 CypA per CA at saturation, i.e. half of the CypA binding loops
on the CA lattice can be occupied simultaneously as predicted on the basis of structure and
simulations.27 The KD determined here for the CypA:CA tube interaction was in the range of
values for the complex of CypA with unassembled CA previously determined.4, 31, 32 Our
observations with CypA as an analyte demonstrate the application of the biosensor for
accurate affinity measurements, whereby calibration of the response with the intensity of a
single molecule also allowed counting of molecules and thus measurement of molar binding
ratios. We have recently demonstrated the utility of this analysis by testing the functionality
of a proposed secondary CA binding site on CypA.22
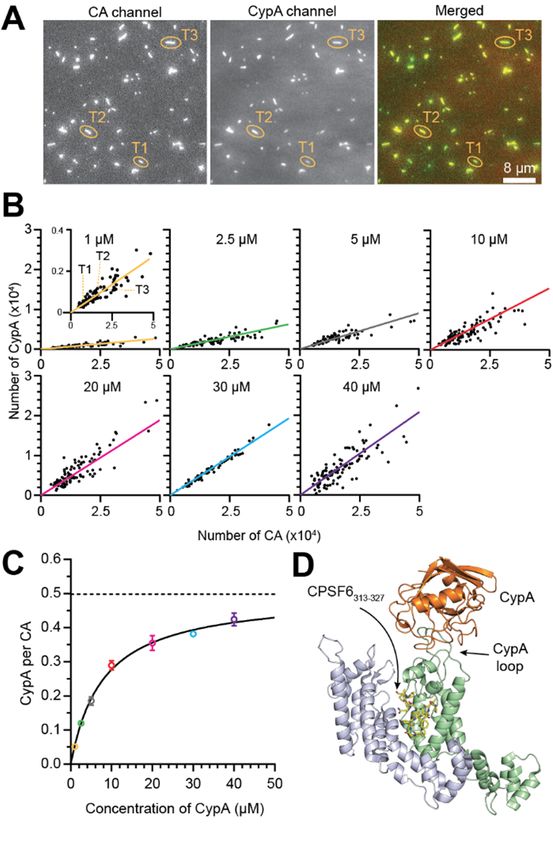
Figure 4. Affinity and stoichiometry of CypA binding to CA tubes. A. TIRF images of CA
A14C/E45C:K158C-AF488 tubes (left), CypA-AF647 (1 μM) (middle) and overlay of both channelsbioRxiv preprint first posted online Apr. 30, 2019; doi: http://dx.doi.org/10.1101/619841. The copyright holder for this preprint
(which was not peer-reviewed) is the author/funder, who has granted bioRxiv a license to display the preprint in perpetuity.
It is made available under a CC-BY-NC-ND 4.0 International license.
(right). B. Scatter plots of the number of CypA molecules versus the number of CA molecules per
tube after injection of CypA (1–40 μM); each symbol represents an individual tube. The CypA:CA ratio
for each concentration was obtained from the gradient of the line of best fit (coloured line). The inset
shows a zoomed in view of the scatter plot recorded at 1 μM CypA-AF647, whereby the data point
labelled T1, T2 and T3 correspond to the three tubes highlighted in panel A. C. Equilibrium binding
curve obtained by plotting the CypA:CA ratio as a function of CypA concentration. Error bars
represent mean ± standard deviation of at least three fields of view on the sensor surface. The fit of
an equilibrium binding model (black line) estimated a KD of 8.0 μM and CypA:CA molar binding ratio at
saturation of 0.5. D. Structural model showing two neighboring CA molecules (blue and green) of a
hexamer in complex with CypA (orange) and CPSF6313-327 peptide (yellow stick model). Generated
from PDB 1AK4,7 4U0A10 and 3H47.33
Biosensor assay to measure CPSF6 peptide binding and dissociation kinetics. Next,
we performed time-resolved biosensor measurements to determine the kinetics of
biomolecular interactions on capsid tubes. As an example analyte, we used an Alexa Fluor
488-labelled peptide derived from CPSF6 (residues 313-327), a host cell protein that
promotes nuclear import and integration targeting of the viral DNA via interactions with the
CA lattice.34, 35 CPSF6313-327 binds into a pocket formed between adjacent CA molecules in a
hexamer (Figure 4D) with low affinity (KD of 50-100 μM).34, 35 The analyte was injected into
the flow channel at concentration (250 nM) that was >100-fold below the KD, i.e. conditions
that should lead to less than 1% occupation of available binding sites. To perform kinetics
measurements, we used time-lapse dual-colour TIRF microscopy to monitor the appearance
and subsequent disappearance of the CPSF6313-327-AF488 signal during analyte injection
and subsequent washout in the flow channel (Supplementary Figure S7). Using the JIM
Immobilized Microscopy Suite of programs (freely available from a GitHub repository, see
Materials and Methods) for automated detection of CA tubes and extraction of background-
corrected fluorescence signals, we then extracted CPSF6313-327-AF488 binding and
dissociation traces for each CA tube in a field of view. Example single-tube traces (Figure
5A) and the heatmap of all traces (Figure 5C) showed that both processes followed single
exponential profiles. The molar binding ratio at equilibrium reached a value of 0.0049 ±
0.0001 CPSF6313-327 per CA (i.e. 0.5% occupation of binding sites) as expected for the low
analyte concentration but signal was readily detectable above noise at levels corresponding
to 0.1% occupation of binding sites (Figure 5A and Supplementary Figure S7). As a result,
kinetic rate constants for binding (kobs = 4.96×10⁻² s-1 at 250 nM) and dissociation (koff =
3.77×10⁻² s-1) could readily be obtained by curve fitting of individual traces (Figure 5A and B)
or median traces (Figure 5C).bioRxiv preprint first posted online Apr. 30, 2019; doi: http://dx.doi.org/10.1101/619841. The copyright holder for this preprint
(which was not peer-reviewed) is the author/funder, who has granted bioRxiv a license to display the preprint in perpetuity.
It is made available under a CC-BY-NC-ND 4.0 International license.
Figure 5. Binding and dissociation kinetics of CPSF6 peptide on CA tubes. A. CPSF6313-327-
AF488 binding (left) and dissociation (right) traces measured on different capsid tubes during
CPSF6313-327-AF488 injection (250 nM) and wash-out, respectively. The rate constants (kobs for binding
and koff for dissociation traces) were determined from least-squared single exponential fitting (red line)
of the fluorescence traces. B. Histograms of values obtained for kobs (top) from fitting individual
binding traces (N = 272 tubes) and for koff from fitting individual dissociation traces (N = 238 tubes).
The red lines indicate values from the fitting of median traces in A. C. Heatmaps (top) showing the
CPSF6313-327:CA ratio for all tubes in the field of view during CPSF6313-327-AF488 injection (250 nM,
left) and washout (right). The median CPSF6313-327-AF488 traces (black line) were fitted with
exponential functions (red line) to give rate constants of kobs = 4.96×10⁻² s-1 and koff = 3.77×10⁻² s-1,
respectively. The signal of a marker for solution exchange in the flow channel is shown in the plots at
the bottom.
Binding analysis of CPSF6 produced by cell-free protein expression. Finally, we tested
the compatibility of the biosensor with GFP-fusion proteins produced by cell-free expression,
a rapid method for producing recombinant proteins in microtiter plates for screening protein-
protein interactions.24, 36 Expression of full length CPSF6 fused at its N-terminus to GFP
(GFP-CPSF6) in Leishmania extract yielded a mixture of different oligomeric states
(Supplementary Figure S8), as previously observed for N-terminally tagged CPSF61-358
expressed in mammalian cells.37 In contrast, expression of GFP as a control protein yielded
monomers (Supplementary Figure S8). We then injected cell-free expressed proteins without
further purification (adjusted to a concentration of 370 nM) into the flow channel of the
biosensor to detect the equilibrium binding level of the proteins on CA tubes. As expected,
GFP did not bind to sensor interface (Figure 6A and B). GFP-CPSF6 bound strongly to the
tubes (Figure 6A) and reached a level of 0.20 ± 0.03 molecules per CA (Figure 6B), which
decayed slowly after wash-out (Figure 6C), while the signal of CPSF6313-327-AF488 reached
a 30-fold lower level and decayed rapidly (Figure 6B and C). These observations are
consistent with a strengthening of the CPSF6-capsid interaction through avidity and with
oligomerization playing an important role in recognizing viral capsids as suggested before.37bioRxiv preprint first posted online Apr. 30, 2019; doi: http://dx.doi.org/10.1101/619841. The copyright holder for this preprint
(which was not peer-reviewed) is the author/funder, who has granted bioRxiv a license to display the preprint in perpetuity.
It is made available under a CC-BY-NC-ND 4.0 International license.
Further experiments are needed to identify the physiologically relevant oligomeric species
and dissect their effects on the functions of CPSF6 in the viral replication cycle.
Figure 6. Binding analysis of proteins produced by cell-free expression. A. TIRF images of the
analyte channel after injection of GFP (left) and GFP-CPSF6 (right). B. Bar graph of the molar binding
ratio between analyte to CA. Each symbol represents the median value from a field of view taken from
at least two different flow channels. C. Dissociation traces of GFP-CPSF6 and CPSF6313-327-AF488
during wash-out. Each curve represents a separate experiment.
Conclusions
Our TIRF imaging-based biosensor is ideal for time-resolved and quantitative interaction
measurements between capsid-binding molecules and HIV-1 CA tubes to obtain kinetic rate
constants, binding affinity and stoichiometry. The key advantage of this system is its stable
and reusable interface which allows robust detection of analyte binding at levels
corresponding to single molecules per viral capsid (i.e. one analyte per 1500 CA molecules).
The appearance of the capsid tubes as lines in the fluorescence image facilitates detection
and extraction of traces using automated image analysis. Tubular CA lattices are commonly
used in binding studies as surrogates for the capsid16, 18, 38, 39 but lack CA pentamers and the
variable curvature of the native conical capsid. Combining our biosensor as a tool for routine
measurements with more specialised approaches using virus-like particles32 should
overcome these limitations.
The ability to monitor binding dynamics of different species labelled with distinct fluorophores
at the level of single tubes with high sensitivity and temporal resolution opens the door to
resolving binding cooperativity and competition, similar to TIRF-based measurements of
other linear biopolymers40-43. The compatibility of the biosensor with complex samples and
low reagent usage could facilitate analysis of proteins in mammalian cell lysates that are
otherwise difficult to produce (such as CPSF637 and TRIM5α39, 44) and rapid screening of
potential new interactors of the HIV-1 capsid produced by cell-free expression. Proof-of-
principle measurements demonstrated the utility of the HIV-1 capsid biosensor for testing
binding modes of host proteins involved in promoting HIV-1 infection, suggesting a role of
oligomerization for CPSF6 binding. The underlying design can conceptually be extended to
other viruses45-48 for discovery and characterization of proteins, small molecules and drugs
that interact with viral capsids to facilitate or inhibit gene delivery and viral replication.bioRxiv preprint first posted online Apr. 30, 2019; doi: http://dx.doi.org/10.1101/619841. The copyright holder for this preprint
(which was not peer-reviewed) is the author/funder, who has granted bioRxiv a license to display the preprint in perpetuity.
It is made available under a CC-BY-NC-ND 4.0 International license.
Supporting information
Supporting information (PDF) includes Supporting Materials and Methods, Supporting
Results and Supporting Figures (SDS PAGE analysis of CA K158C fluorescence labelling
kinetics and assembly efficiency; Negative staining EM of CA tubes with and without
labelled CA K158C; TIRF images of CA tubes grown on surfaces with and without antibody;
Output of analysis software developed for automated detection and masking of capsid tubes
in fluorescence images; Heatmaps of the number of fluorophores as a function of length for
elongated structures grown on the sensor surface in the absence and presence of CypA;
Schematic of CA tube geometry; TIRF images of CPSF6313-327-AF488 binding and
dissociation; Single molecule spectroscopy of proteins produced by cell-free expression
using Leishmania extract).
Author contributions
Derrick Lau – investigation (protein production/labelling/assembly, assay development,
TIRFM binding assay with CypA and CPSF6), data analysis, writing – original draft; James
Walsh – software, data analysis, writing–review and editing; Wang Peng – investigation
(TIRFM binding assay with CypA), data analysis, writing–review and editing; Vaibhav Shah –
supervision, writing–review and editing; Stuart Turville – supervision; writing–review and
editing; David Jacques – supervision, writing – original draft; Till Böcking –
conceptualisation, supervision, writing–original draft.
Funding sources
DL received an Australian Government Research Training Program Scholarship. WP was
supported by a University International Postgraduate Award from UNSW. This work was
supported by funding from the National Health and Medical Research Council of Australia
(NHMRC APP1100771 and APP1098870) and the Australian Centre for HIV and Hepatitis
Virology Research.
Acknowledgments
We thank Owen Pornillos (University of Virginia) for supplying expression constructs for CA
mutants; Alex Ma (UNSW) for help with molecular biology; Yann Gambin and Emma
Sierecki (UNSW) for supplying Leishmania extract; Philip Nicovich (current address: Allen
Institute for Brain Science, Seattle, USA) for building the TIRF microscope; Andrew Tuckwell
for providing eGFP for SMS calibration. EM data was acquired using facilities at the Electron
Microscope Unit at UNSW.bioRxiv preprint first posted online Apr. 30, 2019; doi: http://dx.doi.org/10.1101/619841. The copyright holder for this preprint
(which was not peer-reviewed) is the author/funder, who has granted bioRxiv a license to display the preprint in perpetuity.
It is made available under a CC-BY-NC-ND 4.0 International license.
References
1. Gao, D.; Wu, J.; Wu, Y. T.; Du, F.; Aroh, C.; Yan, N.; Sun, L.; Chen, Z. J., Cyclic
GMP-AMP synthase is an innate immune sensor of HIV and other retroviruses. Science
2013, 341 (6148), 903-6.
2. Dharan, A.; Opp, S.; Abdel-Rahim, O.; Keceli, S. K.; Imam, S.; Diaz-Griffero, F.;
Campbell, E. M., Bicaudal D2 facilitates the cytoplasmic trafficking and nuclear import of
HIV-1 genomes during infection. Proc Natl Acad Sci U S A 2017, 114 (50), E10707-e10716.
3. Hulme, A. E.; Perez, O.; Hope, T. J., Complementary assays reveal a relationship
between HIV-1 uncoating and reverse transcription. Proc Natl Acad Sci U S A 2011, 108
(24), 9975-80.
4. Schaller, T.; Ocwieja, K. E.; Rasaiyaah, J.; Price, A. J.; Brady, T. L.; Roth, S. L.;
Hue, S.; Fletcher, A. J.; Lee, K.; KewalRamani, V. N.; Noursadeghi, M.; Jenner, R. G.;
James, L. C.; Bushman, F. D.; Towers, G. J., HIV-1 capsid-cyclophilin interactions
determine nuclear import pathway, integration targeting and replication efficiency. PLoS
Pathog 2011, 7 (12), e1002439.
5. Campbell, E. M.; Hope, T. J., HIV-1 capsid: the multifaceted key player in HIV-1
infection. Nat Rev Microbiol 2015, 13 (8), 471-83.
6. Luban, J.; Bossolt, K. L.; Franke, E. K.; Kalpana, G. V.; Goff, S. P., Human
immunodeficiency virus type 1 Gag protein binds to cyclophilins A and B. Cell 1993, 73 (6),
1067-78.
7. Gamble, T. R.; Vajdos, F. F.; Yoo, S.; Worthylake, D. K.; Houseweart, M.;
Sundquist, W. I.; Hill, C. P., Crystal structure of human cyclophilin A bound to the amino-
terminal domain of HIV-1 capsid. Cell 1996, 87 (7), 1285-94.
8. Bichel, K.; Price, A. J.; Schaller, T.; Towers, G. J.; Freund, S. M.; James, L. C.,
HIV-1 capsid undergoes coupled binding and isomerization by the nuclear pore protein
NUP358. Retrovirology 2013, 10, 81.
9. Bhattacharya, A.; Alam, S. L.; Fricke, T.; Zadrozny, K.; Sedzicki, J.; Taylor, A. B.;
Demeler, B.; Pornillos, O.; Ganser-Pornillos, B. K.; Diaz-Griffero, F.; Ivanov, D. N.;
Yeager, M., Structural basis of HIV-1 capsid recognition by PF74 and CPSF6. Proc Natl
Acad Sci U S A 2014, 111 (52), 18625-30.
10. Price, A. J.; Jacques, D. A.; McEwan, W. A.; Fletcher, A. J.; Essig, S.; Chin, J. W.;
Halambage, U. D.; Aiken, C.; James, L. C., Host cofactors and pharmacologic ligands share
an essential interface in HIV-1 capsid that is lost upon disassembly. PLoS Pathog 2014, 10
(10), e1004459.
11. Jacques, D. A.; McEwan, W. A.; Hilditch, L.; Price, A. J.; Towers, G. J.; James, L.
C., HIV-1 uses dynamic capsid pores to import nucleotides and fuel encapsidated DNA
synthesis. Nature 2016, 536, 349.
12. Mallery, D. L.; Marquez, C. L.; McEwan, W. A.; Dickson, C. F.; Jacques, D. A.;
Anandapadamanaban, M.; Bichel, K.; Towers, G. J.; Saiardi, A.; Bocking, T.; James, L.
C., IP6 is an HIV pocket factor that prevents capsid collapse and promotes DNA synthesis.
Elife 2018, 7.
13. Shi, J.; Zhou, J.; Shah, V. B.; Aiken, C.; Whitby, K., Small-molecule inhibition of
human immunodeficiency virus type 1 infection by virus capsid destabilization. J Virol 2011,
85 (1), 542-9.
14. Yang, Y.; Luban, J.; Diaz-Griffero, F., The fate of HIV-1 capsid: a biochemical assay
for HIV-1 uncoating. Methods Mol Biol 2014, 1087, 29-36.
15. Shah, V. B.; Shi, J.; Hout, D. R.; Oztop, I.; Krishnan, L.; Ahn, J.; Shotwell, M. S.;
Engelman, A.; Aiken, C., The host proteins transportin SR2/TNPO3 and cyclophilin A exert
opposing effects on HIV-1 uncoating. J Virol 2013, 87 (1), 422-32.
16. Lienlaf, M.; Hayashi, F.; Di Nunzio, F.; Tochio, N.; Kigawa, T.; Yokoyama, S.;
Diaz-Griffero, F., Contribution of E3-ubiquitin ligase activity to HIV-1 restriction by
TRIM5alpha(rh): structure of the RING domain of TRIM5alpha. J Virol 2011, 85 (17), 8725-
37.bioRxiv preprint first posted online Apr. 30, 2019; doi: http://dx.doi.org/10.1101/619841. The copyright holder for this preprint
(which was not peer-reviewed) is the author/funder, who has granted bioRxiv a license to display the preprint in perpetuity.
It is made available under a CC-BY-NC-ND 4.0 International license.
17. Fricke, T.; Brandariz-Nunez, A.; Wang, X.; Smith, A. B., 3rd; Diaz-Griffero, F.,
Human cytosolic extracts stabilize the HIV-1 core. J Virol 2013, 87 (19), 10587-97.
18. Selyutina, A.; Bulnes-Ramos, A.; Diaz-Griffero, F., Binding of host factors to
stabilized HIV-1 capsid tubes. Virology 2018, 523, 1-5.
19. Kortagere, S.; Xu, J. P.; Mankowski, M. K.; Ptak, R. G.; Cocklin, S., Structure-
activity relationships of a novel capsid targeted inhibitor of HIV-1 replication. J Chem Inf
Model 2014, 54 (11), 3080-90.
20. Rich, R. L.; Myszka, D. G., Spying on HIV with SPR. Trends Microbiol 2003, 11 (3),
124-33.
21. Hung, M.; Niedziela-Majka, A.; Jin, D.; Wong, M.; Leavitt, S.; Brendza, K. M.; Liu,
X.; Sakowicz, R., Large-scale functional purification of recombinant HIV-1 capsid. PLoS One
2013, 8 (3), e58035.
22. Peng, W.; Shi, J.; Márquez, C. L.; Lau, D.; Walsh, J.; Faysal, K. M. R.; Byeon, C.
H.; Byeon, I.-J. L.; Aiken, C.; Böcking, T., Functional analysis of the secondary HIV-1
capsid binding site in the host protein cyclophilin A. Retrovirology 2019, 16 (1), 10.
23. Nicovich, P. R.; Walsh, J.; Bocking, T.; Gaus, K., NicoLase-An open-source diode
laser combiner, fiber launch, and sequencing controller for fluorescence microscopy. PLoS
One 2017, 12 (3), e0173879.
24. Kovtun, O.; Mureev, S.; Jung, W.; Kubala, M. H.; Johnston, W.; Alexandrov, K.,
Leishmania cell-free protein expression system. Methods 2011, 55 (1), 58-64.
25. Gambin, Y.; Polinkovsky, M.; Francois, B.; Giles, N.; Bhumkar, A.; Sierecki, E.,
Confocal Spectroscopy to Study Dimerization, Oligomerization and Aggregation of Proteins:
A Practical Guide. Int J Mol Sci 2016, 17 (5).
26. Pornillos, O.; Ganser-Pornillos, B. K.; Banumathi, S.; Hua, Y.; Yeager, M., Disulfide
bond stabilization of the hexameric capsomer of human immunodeficiency virus. J Mol Biol
2010, 401 (5), 985-95.
27. Liu, C.; Perilla, J. R.; Ning, J.; Lu, M.; Hou, G.; Ramalho, R.; Himes, B. A.; Zhao,
G.; Bedwell, G. J.; Byeon, I. J.; Ahn, J.; Gronenborn, A. M.; Prevelige, P. E.; Rousso, I.;
Aiken, C.; Polenova, T.; Schulten, K.; Zhang, P., Cyclophilin A stabilizes the HIV-1 capsid
through a novel non-canonical binding site. Nat Commun 2016, 7, 10714.
28. Barklis, E.; Alfadhli, A.; McQuaw, C.; Yalamuri, S.; Still, A.; Barklis, R. L.; Kukull,
B.; Lopez, C. S., Characterization of the in vitro HIV-1 capsid assembly pathway. J Mol Biol
2009, 387 (2), 376-89.
29. Carnes, S. K.; Sheehan, J. H.; Aiken, C., Inhibitors of the HIV-1 capsid, a target of
opportunity. Curr Opin HIV AIDS 2018, 13 (4), 359-365.
30. Sokolskaja, E.; Sayah, D. M.; Luban, J., Target cell cyclophilin A modulates human
immunodeficiency virus type 1 infectivity. J Virol 2004, 78 (23), 12800-8.
31. Yoo, S.; Myszka, D. G.; Yeh, C.; McMurray, M.; Hill, C. P.; Sundquist, W. I.,
Molecular recognition in the HIV-1 capsid/cyclophilin A complex. J Mol Biol 1997, 269 (5),
780-95.
32. Marquez, C. L.; Lau, D.; Walsh, J.; Shah, V.; McGuinness, C.; Wong, A.;
Aggarwal, A.; Parker, M. W.; Jacques, D. A.; Turville, S.; Bocking, T., Kinetics of HIV-1
capsid uncoating revealed by single-molecule analysis. Elife 2018, 7.
33. Pornillos, O.; Ganser-Pornillos, B. K.; Kelly, B. N.; Hua, Y.; Whitby, F. G.; Stout,
C. D.; Sundquist, W. I.; Hill, C. P.; Yeager, M., X-ray structures of the hexameric building
block of the HIV capsid. Cell 2009, 137 (7), 1282-92.
34. Achuthan, V.; Perreira, J. M.; Sowd, G. A.; Puray-Chavez, M.; McDougall, W. M.;
Paulucci-Holthauzen, A.; Wu, X.; Fadel, H. J.; Poeschla, E. M.; Multani, A. S.; Hughes, S.
H.; Sarafianos, S. G.; Brass, A. L.; Engelman, A. N., Capsid-CPSF6 Interaction Licenses
Nuclear HIV-1 Trafficking to Sites of Viral DNA Integration. Cell Host Microbe 2018, 24 (3),
392-404 e8.
35. Bejarano, D. A.; Peng, K.; Laketa, V.; Borner, K.; Jost, K. L.; Lucic, B.; Glass, B.;
Lusic, M.; Muller, B.; Krausslich, H. G., HIV-1 nuclear import in macrophages is regulated by
CPSF6-capsid interactions at the nuclear pore complex. Elife 2019, 8.bioRxiv preprint first posted online Apr. 30, 2019; doi: http://dx.doi.org/10.1101/619841. The copyright holder for this preprint
(which was not peer-reviewed) is the author/funder, who has granted bioRxiv a license to display the preprint in perpetuity.
It is made available under a CC-BY-NC-ND 4.0 International license.
36. Jung, W.; Sierecki, E.; Bastiani, M.; O'Carroll, A.; Alexandrov, K.; Rae, J.;
Johnston, W.; Hunter, D. J. B.; Ferguson, C.; Gambin, Y.; Ariotti, N.; Parton, R. G., Cell-
free formation and interactome analysis of caveolae. The Journal of cell biology 2018, 217
(6), 2141-2165.
37. Ning, J.; Zhong, Z.; Fischer, D. K.; Harris, G.; Watkins, S. C.; Ambrose, Z.; Zhang,
P., Truncated CPSF6 Forms Higher-Order Complexes That Bind and Disrupt HIV-1 Capsid.
J Virol 2018, 92 (13).
38. Fricke, T.; White, T. E.; Schulte, B.; de Souza Aranha Vieira, D. A.; Dharan, A.;
Campbell, E. M.; Brandariz-Nunez, A.; Diaz-Griffero, F., MxB binds to the HIV-1 core and
prevents the uncoating process of HIV-1. Retrovirology 2014, 11, 68.
39. Ganser-Pornillos, B. K.; Chandrasekaran, V.; Pornillos, O.; Sodroski, J. G.;
Sundquist, W. I.; Yeager, M., Hexagonal assembly of a restricting TRIM5alpha protein. Proc
Natl Acad Sci U S A 2011, 108 (2), 534-9.
40. Nicovich, P. R.; Janco, M.; Sobey, T.; Gajwani, M.; Obeidy, P.; Whan, R.; Gaus,
K.; Gunning, P. W.; Coster, A. C.; Bocking, T., Effect of surface chemistry on tropomyosin
binding to actin filaments on surfaces. Cytoskeleton (Hoboken) 2016, 73 (12), 729-738.
41. Hsiao, J. Y.; Goins, L. M.; Petek, N. A.; Mullins, R. D., Arp2/3 complex and cofilin
modulate binding of tropomyosin to branched actin networks. Curr Biol 2015, 25 (12), 1573-
82.
42. Schmidt, W. M.; Lehman, W.; Moore, J. R., Direct observation of tropomyosin
binding to actin filaments. Cytoskeleton (Hoboken) 2015, 72 (6), 292-303.
43. Telley, I. A.; Bieling, P.; Surrey, T., Reconstitution and quantification of dynamic
microtubule end tracking in vitro using TIRF microscopy. Methods Mol Biol 2011, 777, 127-
45.
44. Langelier, C. R.; Sandrin, V.; Eckert, D. M.; Christensen, D. E.; Chandrasekaran,
V.; Alam, S. L.; Aiken, C.; Olsen, J. C.; Kar, A. K.; Sodroski, J. G.; Sundquist, W. I.,
Biochemical characterization of a recombinant TRIM5alpha protein that restricts human
immunodeficiency virus type 1 replication. J Virol 2008, 82 (23), 11682-94.
45. Tellinghuisen, T. L.; Hamburger, A. E.; Fisher, B. R.; Ostendorp, R.; Kuhn, R. J., In
vitro assembly of alphavirus cores by using nucleocapsid protein expressed in Escherichia
coli. J Virol 1999, 73 (7), 5309-19.
46. Ceres, P.; Stray, S. J.; Zlotnick, A., Hepatitis B virus capsid assembly is enhanced
by naturally occurring mutation F97L. J Virol 2004, 78 (17), 9538-43.
47. Bajaj, S.; Banerjee, M., In vitro assembly of polymorphic virus-like particles from the
capsid protein of a nodavirus. Virology 2016, 496, 106-115.
48. Hyun, J. K.; Radjainia, M.; Kingston, R. L.; Mitra, A. K., Proton-driven assembly of
the Rous Sarcoma virus capsid protein results in the formation of icosahedral particles. J
Biol Chem 2010, 285 (20), 15056-64.
Insert Table of Contents artwork hereYou can also read