Food for a healthy and active life: New indicators to guide action in the agriculture and food sector - Anna Herforth, Ph.D.
←
→
Page content transcription
If your browser does not render page correctly, please read the page content below

Food for a healthy and
              active life:
New indicators to guide
action in the agriculture
         and food sector
                   Anna Herforth, Ph.D.
                   Independent Consultant
         Visiting Fellow, Cornell University

              Festschrift, Dec 13, 2013
What is access to adequate food?

And what is the agriculture and food sector
       supposed to do about it?
1960s-1970s: The “food shortage era”
• Green Revolution; formation of CGIAR

• “Although deficiency of vitamins and minerals
  may cause serious health problems, especially
  among children, the therapy is now well known
  and relatively easy to apply so that the
  magnitude of this problem is almost negligible in
  relation to the one created by lack of calories and
  proteins.”
       World Bank, 1972 Possible Actions on Malnutrition Problems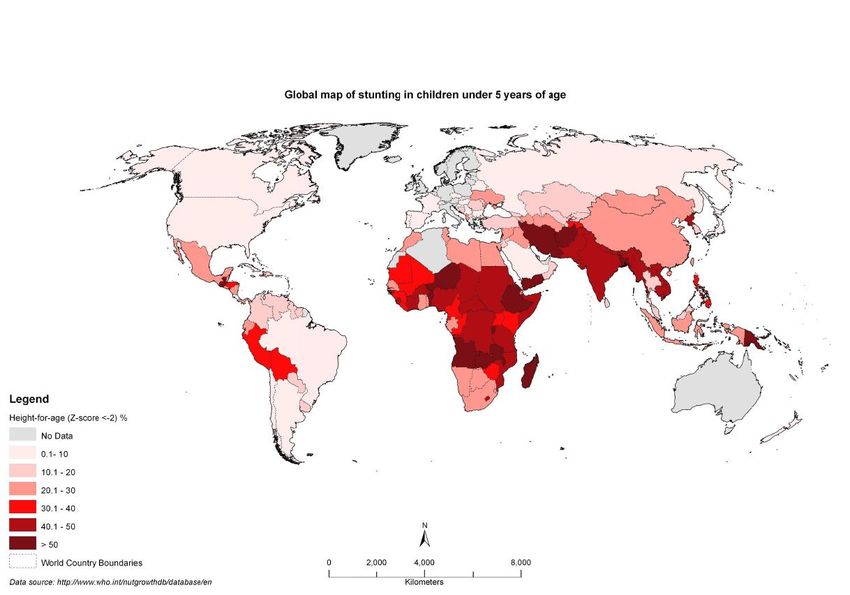
1960s-1970s                      Today
Concept of               1974 World Food Summit:        1996 World Food Summit:
food security            “availability at all           “physical and economic
                         times of adequate world food   access to sufficient, safe,
                         supplies”                      nutritious food to meet
                                                        dietary needs…for a
                                                        healthy and active life”
Nature of main           Hunger and protein             Stunting, obesity,
nutrition problems       deficiency; micronutrient      micronutrient deficiencies
                         deficiencies
Data on malnutrition     Estimates made using per       Collected in nearly all
prevalence               capita food supplies           countries regularly since
                                                        mid-1990s (DHS, MICS)
Main cause of            Considered to be lack of       Inadequate food, health,
malnutrition             calories (and protein)         and care
Data on apparent         Dietary energy supply (DES)    Next slide…
causes of malnutrition   and protein supply
Why have global indicators of “food” not
        evolved with understanding of the problem?

                         Food                              Health                             Care
1970s     Dietary Energy Supply
          Protein supply

1980s-    Dietary Energy Supply                Access to safe water               Breastfeeding to 3 mos
          Undernourishment                     Access to health services          Breastfeeding to 6 mos
mid-90s   Supply of iron and vitamin A *       Immunization                       Breastfeeding to 12 mos

1998      Dietary Energy Supply                Access to safe water               Exclusive BF 0-3 mos
          Undernourishment                     Access to adequate sanitation      BF & comp food 6-12mos
                                               Immunization                       Breastfeeding 20-23mos
                                               ORT use

2013      Dietary Energy Supply                Access to safe water               Early initiation of BF
          Undernourishment                     Access to adequate sanitation      Exclusive BF to 6 mos
          Protein supply                       Immunization                       Intro of solid/semi-solid/soft
          % calories from starches             ORS use                            foods 6-8mos
                                               VAS coverage                       Breastfeeding at age 2yrs

                  Sources: UNICEF SOWC, SCN Reports on the World Nutrition Situation, FAO SOFA and SOFI reports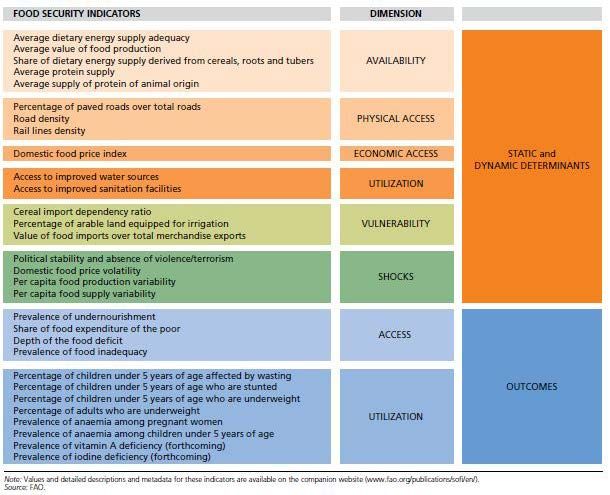
Nutrition isolationism (1980s-2008)
• “The major lesson of the last 20 years is that
  reductions in malnutrition cannot be achieved
  only by increases in food production.”
  – UNICEF first flagship “State of the World’s Children” report, 1980

• Attention went elsewhere for a long time…
  nutrition science incubated its story, data, and
  priorities
Long tradition of “personal responsibility”
             in nutrition science
• Nutrition education is and has been
  the main intervention to address diet
  quality
• Historical:
   – Since deficiencies were discovered,
     response has been supplementation,
     fortification, and nutrition education
   – Gender division: women in home
     economics; men in agricultural
     economics
• Arguably, for political/pragmatic
  reasons
   – Allows nutrition to continue to work
     by itself, without getting into the
     messy business of food policy
Politically easier to avoid food
• “[Micronutrient programs could] reduce
  human suffering yet do not threaten the
  existing economic and political structures.”
  – S Reutlinger, 1993

• Echoed in Per’s Lancet 2013 commentary
Nearly 1/3 of “high stunting-burden” countries have
              overweight + obesity rates >40%
%

80

70

60

50

40

30

20

10

 0

                   Overweight + Obesity (all age 15-100 yrs)   Stunting (age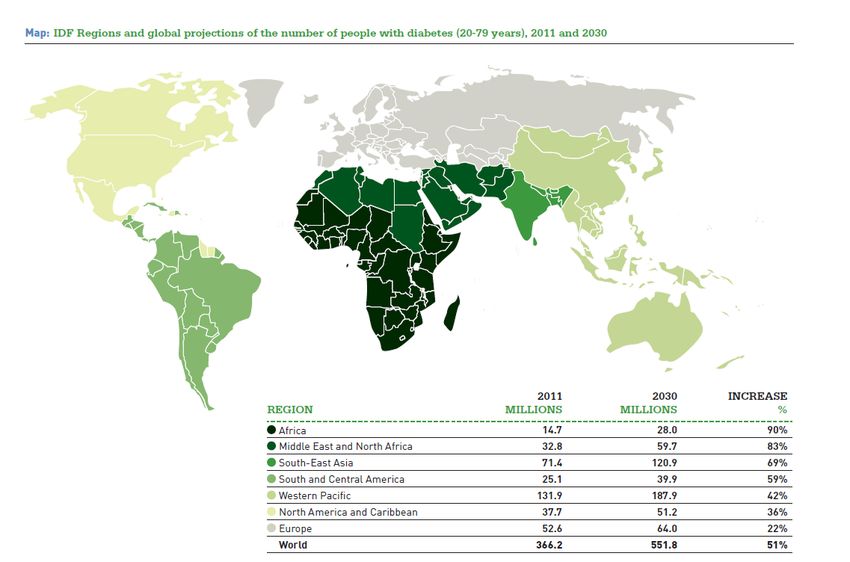
165 million under 5 are stunted
Projected increases in diabetes to 2030

Source: International Diabetes Federation, Diabetes Atlas 5th Ed. 2011
Top 10 causes of years of life lost
  All developing countries, 2010

                        Source: Institute for Health Metrics and Evaluation
Top contributors to “Dietary risks”
All developing countries, 2010
Source: Institute for Health Metrics and EvaluationCauses of poor diets? “Consumers ultimately determine what they eat and therefore what the food system produces.” – Key Message of FAO SOFA 2013 (on homepage) • Most nutritionists and agricultural economists have agreed with this for the last century (in deed if not in word)
Ecological model for diets

Image source: Pelto, Dufour and Goodman. Nutritional Anthropology: Biocultural Perspectives on Food and Nutrition. Oxford University Press
Concept of food environment
• Constrains and signals consumers what to purchase
   – What foods are available; their nutritional quality and
     safety
   – What foods are most affordable, based on relative prices
   – What foods are most convenient to obtain and prepare
   – What foods consumers have information about
   – What foods are most strongly marketed, including
     advertising or strategic placement to encourage purchase

                                            Source: Herforth, forthcoming 2014
Low availability and high prices of diverse diets Source: Herforth 2010 (in Pinstrup-Andersen, Ed.), based on FAO data. Note: analysis redone with 2009 data, same results
Share of Energy Source & Food Budget
         in Rural Bangladesh
                   Fish and Meat
  Non-Staple
  plants

                Energy Source         Food Budget

 Staple foods

                                   Slide Source: Howdy Bouis; FNB Mar 2011
Photo: Anna Herforth
McDonald’s Outlets, 1987-2002

            8000
            7000
            6000
            5000
                                                                    1987
            4000
                                                                    1997
            3000
                                                                    2001
            2000                                                    2002
            1000
                0
                      Latin  Asia/Pacific   Europe   Global other
                     America                          (excludes
                                                         US)

Pingali, Food Policy 2006
Habits and norms change over time
Washington Post 11/9/2013Demand from individuals, or from
food industry?
• “In high-income and rapidly growing low-
income countries, the agricultural sector has
become or is rapidly becoming a supplier of
raw materials for the food processing industry,
rather than a provider of food for direct
consumption.”
-Pinstrup-Andersen 2013, Lancet series on maternal and
child undernutritionGiven the advances in the food security conversation and the nature of nutrition problems today… Does it make sense to measure “access to adequate food” with a 1960s-era calorie availability indicator?
Key Recommendations for Improving
    Nutrition through Agriculture

• Food and agriculture policies can have a better
  impact on nutrition if they:
   – Monitor dietary consumption and access to safe,
     diverse, and nutritious foods. The data could
     include food prices of diverse foods, and dietary
     consumption indicators for vulnerable groups.

http://unscn.org/files/Agriculture-Nutrition-CoP/Agriculture-Nutrition_Key_recommendations.pdf
FAO SOFI 2013 lists 30 indicators Still, few shed light on availability of and access to healthy diets.
Undernourishment and undernutrition
• Of the 21 countries
that have already
met the MDG1 target
of halving the
proportion of the
population below
the minimum level of
dietary energy
consumption, only
six are on track to
meet the
underweight target.
Source: World Bank 2013
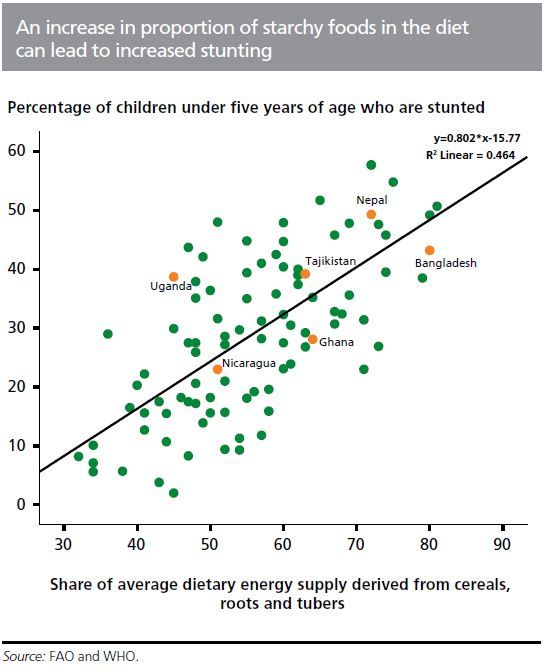
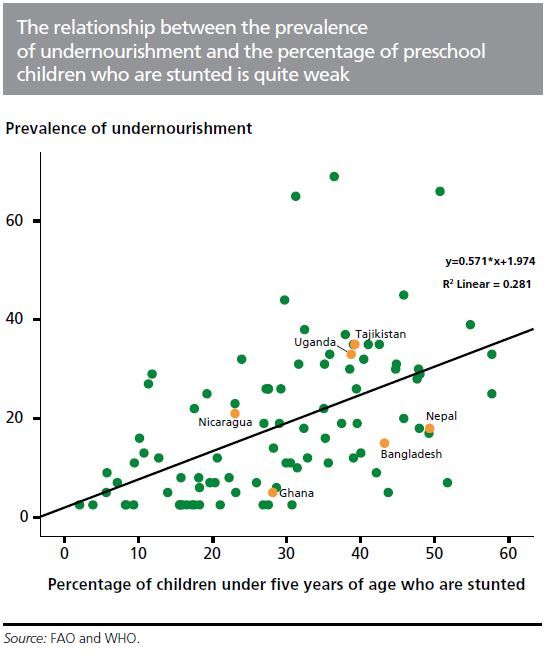
FAO SOFI 2013Share of energy supply from starches
has potential
• Diversity of national food
supply is a predictor of
child undernutrition
outcomes, independent of
national income, calories
available per capita and
other socio-economic
variables.
– Remans et al. 2013
(presented at IUNS ICN)
FAO SOFI 2013Is it sufficient?
• Maybe for correlations with stunting…
probably not for chronic disease.
– Not significantly correlated with obesity rates
(Remans et al., presented at IUNS ICN 2013)
• What is the appropriate policy response?
• It is not an indicator of diet quality; need
household survey data for thatExamples of food indicators
• National-level food availability: what does the picture of food availability look like?
– % non-starches
– Fruit and vegetable availability falls below need in most countries in the world (Siegel et al,
forthcoming)
– Sugar availability (sig. assoc. with diabetes prevalence – Basu et al. 2013)
– Others…possibly legume and nut availability, or Plant:Animal source protein supply ratio
• Local-level food environments:
– Percent households who cannot afford a balanced diet (e.g. Save UK Cost of Diet tool)
– Cost of healthy diets: on average, $21/week more than unhealthy alternatives (Rao et al. 2013)
– Relative prices of different food groups
– “Food deserts”-type indicators
– Community-level production diversity in Kenya associated with household dietary diversity (Remans
et al. 2011)
• Household-level food security:
– Household dietary diversity (HDDS) – access to diverse foods
– Food Insecurity Experience Scale (FAO Voices of the Hungry) – being piloted in Gallup World Poll
• Individual-level diet quality:
– Women’s dietary diversity (WDDS) – cut-off being developed for early 2014
– Fruit and vegetable dietary variety
– In Brazil, the proportion of ultra-processed foods in household food increased from 20% to 28%
from 2003-2008 (Monteiro 2010)Problem identification and advocacy
• “In addition to identifying the problems and measuring the
number of people affected, information from [food security
and nutrition monitoring] is also used for sensitizing the
public and the decision makers in the government and donor
community.”
Babu and Pinstrup-Andersen 1994Addressing Nutrition through Agriculture is now high on agendas • Agriculture’s main contribution to better nutrition is food. • But, how are planners to weigh potential policy options without any indicators of how the food environment looks, and what diets are like?
Conclusion
• Current global measurement of food access was made for a different
  world, 50 years ago.
    – Then “food shortage”
    – Now “healthy food shortage” (World Bank 2014)

• Available data make it possible to analyze core health and care causes of
  nutritional problems at national level, but not food causes

• Lesson from history: Core data collected and published can change.

• Post-MDGs: time to align understanding of “food” causes of
  malnutrition with globally-collected indicators

• Global institutions need to monitor “food for a healthy and active life”
  with data on healthy food access and dietary quality
    – FAO (SOFI)
    – DHS, UNICEF MICS, World Bank LSMS
Thank you
You can also read