Forecasting the production side of GDP - Gregor Bäurle, Elizabeth Steiner and Gabriel Züllig - Swiss National Bank
←
→
Page content transcription
If your browser does not render page correctly, please read the page content below
Forecasting the production side of GDP
Gregor Bäurle, Elizabeth Steiner and Gabriel Züllig

SNB Working Papers
16/2018
Legal Issues

                                                                                            Forecasting the production side of GDP∗

DISCLAIMER                                                                                   Gregor Bäurle†, Elizabeth Steiner‡and Gabriel Züllig§
The views expressed in this paper are those of the author(s) and
do not necessarily represent those of the Swiss National Bank.                                                    December 13, 2018
Working Papers describe research in progress. Their aim is to
elicit comments and to further debate.

                                                                                                                         Abstract
COPYRIGHT©                                                                       We evaluate the forecasting performance of time series models for the production side
                                                                                 of GDP, that is, for the sectoral real value added series summing up to aggregate
The Swiss National Bank (SNB) respects all third-party rights, in
particular rights relating to works protected by copyright (infor-
                                                                                 output. We focus on two strategies that are typically implemented to model a large
mation or data, wordings and depictions, to the extent that these                number of time series simultaneously: a Bayesian vector autoregressive model (BVAR)
are of an individual character).                                                 and a factor model structure; we then compare them to simple benchmarks. We look at
                                                                                 point and density forecasts for aggregate GDP, as well as forecasts of the cross-sectional
SNB publications containing a reference to a copyright (© Swiss
National Bank/SNB, Zurich/year, or similar) may, under copyright                 distribution of sectoral real value added growth in the euro area and Switzerland. We
law, only be used (reproduced, used via the internet, etc.) for                  find that the factor model structure outperforms the benchmarks in most tests, and
non-commercial purposes and provided that the source is menti-                   in many cases also the BVAR. An analysis of the covariance matrix of the sectoral
oned. Their use for commercial purposes is only permitted with
the prior express consent of the SNB.
                                                                                 forecast errors suggests that the superiority of the factor model can be traced back
                                                                                 to its ability to capture sectoral comovement more accurately, and the fact that this
General information and data published without reference to a                    gain is especially high in periods of large sectoral dispersion.
copyright may be used without mentioning the source. To the
extent that the information and data clearly derive from outside
sources, the users of such information and data are obliged to                   JEL classification: C11, C32, C38, E32, E37
respect any existing copyrights and to obtain the right of use from
the relevant outside source themselves.                                          Keywords: Forecasting, GDP, Sectoral heterogeneity, Bayesian vector autoregression,
                                                                                 Dynamic Factor Model

LIMITATION OF LIABILITY

The SNB accepts no responsibility for any information it provides.
Under no circumstances will it accept any liability for losses or
damage which may result from the use of such information.
This limitation of liability applies, in particular, to the topicality,
accuracy, validity and availability of the information.

ISSN 1660-7716 (printed version)
ISSN 1660-7724 (online version)

© 2018 by Swiss National Bank, Börsenstrasse 15,
P.O. Box, CH-8022 Zurich

                                                                             ∗
                                                                                We are grateful to Rasmus Bisgaard Larsen, Danilo Cascardi-Garcia, Ana Galvão, Gregor Kastner,
                                                                          Massimiliano Marcellino, James Mitchell, Ivan Petrella, Emiliano Santoro and Rolf Scheufele for helpful
                                                                          comments and discussions. We also thank seminar participants at the Vienna Workshop on Economic
                                                                          Forecasting 2018, Copenhagen University, the SNB Brown Bag seminar, and the Swiss Economists
                                                                          Abroad Annual Meeting 2017 for their feedback. The views, opinions, findings, and conclusions or
                                                                          recommendations expressed in this paper are strictly those of the authors. They do not necessarily
                                                                          reflect the views of the Swiss National Bank or Danmarks Nationalbanken. The Swiss National Bank
                                                                          and Danmarks Nationalbanken take no responsibility for any errors or omissions in, or for the correctness
                                                                          of, the information contained in this paper.
                                                                              †
                                                                                Swiss National Bank, Economic Analysis, e-mail: gregor.baeurle@snb.ch
                                                                              ‡
                                                                                Swiss National Bank, Economic Analysis, e-mail: elizabeth.steiner@snb.ch
                                                                              §
                                                                                Danmarks Nationalbank, Research, e-mail: gaz@nationalbanken.dk
1 Introduction the sector-specific component follows a univariate process. Our set of models is completed
with a number of simpler benchmark models.
There is an extensive literature that proposes and evaluates methods for forecasting real
In a second step, we evaluate the point and density forecast performance of these models
GDP. For a long time, researchers concentrated on analysing the most precise forecasts,
for aggregate GDP using data for the euro area and Switzerland. As sectoral real value
i.e. ‘point’ forecasts. More recently, they have turned to a second aspect of forecast
added sums up to aggregate GDP, all our sectoral models provide us directly with a
analysis, looking at ‘density’ forecasts, that is estimating the uncertainty contained in
prediction for aggregate GDP. The performance evaluation, based on standard evaluation
GDP forecasts. However, there is also a further aspect, which has been much neglected
criteria, is straightforward. In addition to the evaluation of standard measures such as
up to now. Not least the stark, long-lasting policy interventions during and after the
the RMSE, we analyse the decomposition of the aggregate forecast error variances into
financial crisis sparked an interest in the joint evolution of macro-economic variables and
the weighted sum of forecast error variance and the covariances between the sectors. If a
sectoral heterogeneity, i.e. in the cross-sectional distribution of the production sectors
model performs better owing to a reduction in the covariance terms, this indicates that
that together constitute the real economy.
the model captures the comovement between the series more accurately. We furthermore
In this paper, we evaluate the forecasting performance of time series models describing analyse the role of sectoral comovement by looking separately at episodes with high and
value added series for the many production sectors that sum up to aggregate output. A low comovement.
useful production-side model should arguably perform well in all three aspects mentioned
In a third step, we turn to the evaluation of the cross-sectional forecast distribution.
above. We therefore evaluate the model forecasting performance comprehensively by
For this evaluation, we rely on standard measures for multivariate forecasts such as the
assessing the point and density forecasts for aggregate GDP, as well as the cross-sectional
log determinant of (weighted) error covariance matrix and a multivariate mean squared
distribution of the production sectors. We focus on the forecast performance of different
error.1 But we also propose two new measures comparing specific aspects of the forecast
‘macro-econometric’, production-side models, i.e. models that are able to capture the joint
distribution. The first measure compares the weighted share of sectors that were correctly
dynamics of the sectoral series and important macroeconomic variables, relative to several
projected to grow above and below their long-term average respectively. This criterion
simpler benchmark models.
reflects the idea that a model is useful if it is able to forecast what stage in the business cycle
Our analysis proceeds in three steps. First, we present our set of models and describe a sector might be in. The second measure assesses how well models predict the dispersion of
how they can be estimated using Bayesian methods. We concentrate on models that are growth across the economy as measured by its cross-sectoral standard deviation. Looking
suited for the many sectoral time series jointly with important macroeconomic time series. at the second moment of the cross-sectional distribution allows us to tell whether a model
We therefore include a Bayesian vector autoregressive model (BVAR), which is probably is able to predict the future dispersion of the sectors, abstracting from its sectoral point
the most popular choice for modelling many macroeconomic time series simultaneously. forecast performance. In other words, a model can perform well if it correctly predicts
In addition, taking into account the literature on factor-augmented vector autoregressive how different the sectors are from each other, even if it is not able to tell precisely how
models, we propose an alternative approach relying on a dynamic factor model structure each sector will grow.
(DFM). In short, this approach assumes that each of the sectoral series can be decomposed
We find quite distinct evidence that the factor model performs very well, irrespective of
into a component driven by macro-economic factors and a sector-specific component that
the evaluation measure. Indeed, it outperforms the simple benchmarks in most tests, and
is orthogonal to these factors. The macroeconomic factors are modelled as a BVAR, while 1
In the literature, this criterion is also labelled ’weighted trace mean squared forecast error’.
2 3
2 3in many cases also the BVAR. This is true for both point and density forecasts. In the et al. (2003) propose an indicator model using a geographical disaggregation of GDP for the
latter case, the superiority tends to be even more pronounced. Our decomposition of euro area. Zellner and Tobias (2000) put forward a similar model for a set of 18 countries.
the forecast error variances into sector-specific variances and covariances between sectors Both of these early papers show the superiority of models using disaggregate data. There
supports the hypothesis that the factor model outperforms its competitors because it are, however, only a few studies that look at the production-side disaggregation of GDP.
is better able to understand the degree of sectoral comovement. Interestingly, this is Most of them focus predominantly on the point forecast performance of indicator-based
particularly the case if idiosyncratic factors are important, such that sectoral comovement models, and therefore concentrate mostly on short-term forecasts.
is low. Moreover, the factor model tends to outperform the other models also at forecasting
For the euro area, Hahn and Skudelny (2008) find that choosing the best-performing
sectoral heterogeneity. In particular, it more accurately forecasts the sectoral dispersion
bridge equations for each sector of production outperforms an AR model forecasting
as measured by the cross-sectional standard deviation of the sectors.
aggregate GDP directly. Barhoumi et al. (2012) perform a similar analysis for the French
Before turning to the description of the models and their evaluation, we present some economy and reach the same conclusion. Drechsel and Scheufele (2012) analyse the
remarks on the existing literature. We then show the results of the sectoral heterogeneity performance of a production-side disaggregation and a disaggregation into the expenditure
analysis. components of German GDP. They compare the resultant forecasts with those of aggregate
benchmarks. Overall, they find only limited evidence that bottom-up approaches lead
to better predictions. However, in certain cases the production-side approach produces
2 Related literature
statistically significantly smaller forecast errors than the direct GDP forecasts. More
Our paper contributes to the strand of literature that compares the forecasting performance recently, Martinsen et al. (2014) find that disaggregate survey data at a regional and
of models using aggregate data with those that incorporate disaggregate information. A sectoral level improve the performance of factor models in forecasting overall output
few papers derive analytical results. A key prediction from the theoretical literature is growth. Along with these analyses, a vast literature has emerged that tests the optimal
that an optimal model trades off potential model misspecification in aggregate models and number of indicators needed to forecast a specific aggregate target variable. Barhoumi
increased estimation uncertainty, due to the higher number of parameters in disaggregate et al. (2012) and Boivin and Ng (2006) provide evidence that a medium-sized number of
models (see e.g. Hendry and Hubrich (2011)). General theoretical results regarding the indicators often leads to better performance than a very large number. This is because
determinants of this trade-off are scarce. One exception is an early conjecture by Taylor idiosyncratic errors are often cross-correlated.
(1978). He argues, based on analytical considerations, that the trade-off depends on the A major caveat of most of these indicator models is, however, that they are not able
extent of comovement between the disaggregate series. Models using aggregate series or to capture sectoral linkages and comovement explicitly. Production networks play an
univariate models for disaggregate series are inefficient if the disaggregate series exhibit important role in the propagation of shocks throughout the economy, and can cause
heterogenous dynamics. At the same time, gains of multivariate disaggregate models are low-level shocks to lead to sizeable aggregate fluctuations, as argued by Horvath (1998)
predicted to be rather small if the series move homogeneously. We assess this hypothesis and more recently Carvalho et al. (2016). As sectoral linkages are important amplifiers
empirically in our setting in section 5.3. of aggregate movements, their inclusion in a model should presumably help to improve
Given that the relative forecast performance of disaggregate and aggregate models depends forecasts of aggregate variables.
on the specifics of the data, a number of papers provide empirical assessments. Marcellino A number of studies have measured the forecasting performance of models that take
4 5
4 5linkages into account, and have compared these to models with non-disaggregated data. 3 Models
The bulk of them is applied to forecasting inflation, with ambiguous results. Hubrich
(2005) simulates out-of-sample forecasts for euro area inflation and its five sub-components, For the forecasting of macroeconomic time series, a vector autoregressive model (VAR)
and finds that using disaggregate data does not necessarily help, although there are some is usually a good starting point. Each variable is modelled as a function of its own lags
improvements on medium-term forecast horizons. The reason is that in the models used, and the lags of all other variables included in the model. Such models can be used for
many shocks affect the sub-components of inflation in similar ways. This creates highly forecasting and also, albeit with some limitations, for more structural analysis. Because
correlated errors of the components, which are then added up rather than cancelled out. we use a large set of variables including macro and sectoral series, some shrinkage of the
Additionally, more disaggregation comes at the cost of a higher number of parameters parameter space is required, as the number of parameters increases quadratically with the
to estimate, with decreasing precision. As a consequence, Hendry and Hubrich (2011) number of observed variables in a VAR.
favour forecasting aggregate inflation directly using disaggregate information, rather than In the literature, there are two popular approaches for achieving a parsimonious, simultaneous
combining disaggregate forecasts. modelling of a large number of time series. The first is a BVAR approach, i.e. a Bayesian
These findings have, however, been refuted by Dées and Günther (2014)’s work. They use version of a standard VAR (Litterman, 1979, Doan et al., 1984). The shrinkage of the
a panel of sectoral price data from five geographical areas to forecast different measures of parameter space is achieved by means of informative priors on the coefficients of the
inflation, and find that the disaggregate approach improves forecast performance, especially model. The second strategy that has become increasingly popular for modelling a large
for medium-term horizons. Bermingham and D’Agostino (2011) emphasise that the benefits set of macroeconomic time series and for forecasting is a dynamic factor structure (Stock
of disaggregation increase with the number of disaggregate series, but only when one uses and Watson, 2002). It is assumed that the comovement between observed series can be
models that pick up common factors and feedback effects, such as factor-augmented or described appropriately with few common factors. Each observed series is then a linear
BVAR models. combination of these factors and their lags, and an idiosyncratic component. The factors
themselves are modelled as a dynamic process,2 giving it its characteristic name Dynamic
Based on this literature, we test whether modelling the production side of GDP using
Factor Model (DFM).3
models that allow for dynamic linkages is beneficial. To the best of our knowledge, we
are the first to do so. We move beyond the evaluation of point forecasts and also test A strong point of both types of model, the BVAR and the DFM, is that they are able
the quality of the density forecasts. The tests are carried out for the short run as well as to track down which macroeconomic shocks are driving the economy. Bäurle and Steiner
for the medium run (eight quarters ahead). Furthermore, we assess the accuracy of the (2015), for example, measure the response of macroeconomic shocks on sector-specific
sector-level forecasts. value added within a DFM framework. Such analyses enable us to quantify the impact of
aggregate shocks on the individual production sectors of an economy. As the transmission
of such shocks often takes a few quarters, in addition to the results for the short run we
also analyse the medium-run forecasts (eight quarters ahead). To evaluate how well both
2
The terms ‘dynamic’ vs ‘static’ factor models are not used uniformly in the literature. Bai and Ng
(2002) refer to a ‘dynamic’ factor model if the observed series load on the factors and also their lags. Note,
however, that such a model can be rewritten in a ‘static’ form by redefining the state vector.
3
Note that when the primary interest is not to model the large set of variables per se, but merely to
extract information from these variables that can be included in a standard VAR, then the model is usually
called a ‘factor augmented vector autoregression’ (FAVAR, see e.g. Bernanke et al. (2005)).
6 7
6 7model types are able to forecast the economy in different dimensions (point and density
δi
λ2
forecast, as well as sectoral dispersion), we simulate a horse race between them and a set j = i, k = 1 k2 j=i
E(φijk ) = , V (φijk ) =
λ2 σ 2
0 j = i ϑ k2 σi2 j = i
of simpler benchmark models. The latter cannot be used for structural analysis, but are j
known to perform relatively well for forecasting. Both of the two main models (which
The prior distribution implements the uncertain belief that the first own lag of each series i
operate on the full set of sectoral series) and the simpler benchmark models are described
is δi and the other coefficients are zero, where the uncertainty with respect to cross-variable
in the rest of this section.
coefficients (i.e. the coefficient relating the series i to a lag of series j, i = j) is proportional
We denote quarter-on-quarter value added growth of a single sector s at time t by xst and to the relative variance of the residuals for the respective variables. The tightness of the
the stacked vector of xst in all S sectors by XtS . The vector of macro variables is denoted by ‘own’ coefficients relative to the ‘cross-variable’ coefficients is scaled with an additional
XtM . The vector of XtS and XtM stacked into one vector is denoted by Xt . This contains factor ϑ. Importantly, the uncertainty decreases with the lag length k, making feasible
all data that is jointly used for the two baseline models. Growth in aggregate GDP yt the specification of models with large lag length. The overall tightness of the prior is
equals the weighted sum of sectoral value added growth, Ss=1 ωs,t−1 xst , where the weights controlled by the scale parameter λ.
ωs,t−1 are the nominal value added share of total value added of the previous time period,
as is commonly used to calculate growth contributions. 3.2 Dynamic factor Model (DFM)
The DFM framework relates a large panel of economic indicators to a limited number
3.1 Large Vector Autoregressive Model (VAR-L)
of observed and unobserved common factors. The premise behind this type of model
We set up a large Vector Autoregressive Model (VAR-L) using all macro variables XtM is that the economy can be characterised by a small number of factors that drive the
and sectoral value added series XtS , and estimate the model with Bayesian methods. The comovements of the indicators in the panel. Rather than summarising indicator data
stacked vector Xt is assumed to depend linearly on its lags and some disturbances εt : by means of factor analysis, we use it to extract information contained in sectoral value
p added series by including them in the dynamic system. Formally, the model consists of
Xt = c + Φk Xt−k + εt (1) two different equations: an observation equation and a state equation. The observation
k=1
equation relates sectoral value added growth XtS to the common factors ft that drive the
where the constant c and Φk , k = 1, . . . , p are coefficient matrices and εt is a vector of economy:
p
innovations, which are assumed to be Gaussian white noise, i.e. εt ∼ N (0, Σ). XtS = c + Λk ft−k + ut , (2)
k=1
With Xt reaching a large dimension, the number of parameters to be estimated is large,
where Λk , k = 1, . . . , p are the factor loadings and ut is a vector of item-specific components.
relative to the number of available observations. Thus some shrinking of the parameter
Thus, XtS is allowed to load on the factors both contemporaneously and on their lags.
space is needed. Following the vast majority of the literature, this is achieved by using a
Importantly, ft consists of both unobserved and observed factors.4 In our case, the
Minnesota type prior. Our implementation follows Banbura et al. (2010) and sets the first
observed factors are the macro variables XtM . Following Boivin and Giannoni (2006), we
and the second prior moments of the elements in the i-th row and the j-th column of Φk ,
4
In order to estimate the model, we rewrite the model in a static state space form. Observed factors
k = 1, .., p as follows: are treated as ’unobserved factors’ without noise in the observation equation.
8 9
8 9allow ut to be autocorrelated of order one by specifying ut = ψut−1 + ξt with ξt ∼ N (0, R). The first benchmark model is a combination of VARs, which include the baseline macro
The joint dynamics of the factor ft are described by the following state equation: variables, XtM , plus one sectoral value added series xst and the aggregate of the remaining
p sectors Xt−s . We first estimate this model for each sector separately and then aggregate the
ft = Φk ft−k + εt (3) sector forecasts to compute GDP, using nominal value added weights of the last available
k=1
time period, ωs,t−1 .
where Φk , k = 1, . . . , p are coefficient matrices, εt is a vector of white noise innovations, i.e.
xst xst−k
εt ∼ N (0, Σ). Moreover, εt and the idiosyncratic shocks ut are assumed to be uncorrelated. p
X −s =c+ Φ X −s + εt (4)
t k t−k
The model is estimated using Bayesian methods. Since it is not possible to derive analytical k=1
XtM M
Xt−k
results for high-dimensional estimation problems such as the one at hand, we have to rely
on numerical techniques to approximate the posterior. In particular, we use a Gibbs This model has been used e.g. by Fares and Srour (2001) for Canada and Ganley and
Sampler, iterating over conditional draws of the factors and parameters. A detailed Salmon (1997) for the UK to analyse the impact of monetary policy at the sectoral
account of the step-by-step estimation algorithm is provided in appendix 9.1. level. We label it VAR-S to highlight the sectoral component, as it takes into account
the heterogeneity of sectors responding to macroeconomic conditions and shocks.6
Our choices for the prior distributions are the following. The prior for the coefficients in
the observation equation, Λk , is proper. This mitigates the problem that the likelihood is The second benchmark model, called VAR-A, is the direct aggregate counterpart to
invariant to an invertible rotation of the factors. The problem of rotational indeterminacy VAR-S. This model differs only with respect to the target variable such that it includes
in this Bayesian context is discussed in detail in Bäurle (2013).5 We assume that, a GDP yt directly as a variable in the dynamic system.
priori, the variances of the parameters in Λk are decreasing with the squared lag number
p
k, in analogy to the idea implemented in the Minnesota prior that longer lags are less yt yt−k
=c+ Φk + εt (5)
XtM k=1 X M
t−k
important. The determination of the coefficients describing the factor dynamics reduces
to the estimation of a standard VAR. We assume a Minnesota-type prior for the parameters
Ultimately, we have included two univariate AR processes: The AR-S estimates an independent
in the state equation.
sectoral process and makes predictions which are then aggregated up, equivalent to VAR-S.
p
3.3 Benchmark models
xst =c+ φk,s xst−k + εt (6)
k=1
Four different benchmarks, two sectoral and two aggregate ones, complete our suite of
The AR-A is again the aggregate counterpart, which has a minimal number of parameters
models used in the horse race. All of them can be formulated as a special case of the VAR 6
This model shows similarities to a ”Global VAR” as proposed by Pesaran and Weiner (2010). It
actually corresponds to a Global VAR in which the weight in the aggregation is the sectoral share in
described in Section 3.1. The Bayesian estimation procedure can thus be directly applied,
aggregate GDP, as opposed to weights based on patterns of trade as is typical in Global VARs that model
different countries or regions. An alternative weighting scheme in the case of sectoral variables could be
and we get a distribution of forecasts for each of the models. This enables us to evaluate
based on input-output tables. Due to data limitations, we do not pursue this avenue.
the density forecasts.
5
Bayesian analysis is always possible in the context of non-identified models, as long as a proper prior
on all coefficients is specified, see e.g. Poirier (1998). Note that rotating the factors does not impact the
impulse response functions as long as no restrictions are set on the responses of the factors to shocks.
10 11
10 11and is a natural choice as a simple but competitive benchmark for forecasting GDP. convergence visually by looking at the posterior means based on an expanding number of
p draws, finding no evidence of changes after less than half of the draws.
yt = c + ϕk yt−k + εt (7)
k=1 Table 1 summarises the models and their specifications.
3.4 Specification Table 1: Evaluated models and their specifications: Overview
We set the number of lags to four for all models. The relative point forecast performance DFM VAR-L VAR-S
Description Dynamic factor Large BVAR w/ VAR w/ one
neither increases nor deteriorates systematically when using only one lag instead, but
model w/ all all sectoral and sectoral series at
density forecasts tend to worsen. sectoral and macro series a time and macro
macro series series
The prior means, δi , are set to zero in the specification for the autoregressive coefficients. Real variables SVA SVA SVA
# estimated models 1 1 S
Following Banbura et al. (2010), the factor ϑ, controlling the relative importance of other # total variables S+M S+M 1+M
Forecast WS WS WS
lags relative to own lags, is set to one. This allows us to implement the Minnesota prior
λ 0.2 0.1 0.2
with a (conjugate) normal inverted Wishart prior (see e.g. Karlsson (2013)). The overall Reference equation (2),(3) (1) (4)
scaling factor of the prior variance, λ, is chosen according to recommendations by Banbura
VAR-A AR-S AR-A
et al. (2010) based on an optimisation criterion for VARs of similar size, and summarised
Description Aggregate VAR Univariate AR w/ Univariate AR w/
in Table 1.7 We take 20,000 draws from the posterior distribution, whereas in the DFM w/ GDP and one sectoral series GDP
macro series at a time
case, we discard an additional 2,000 initial draws to alleviate the effect of the initial values
Real variables GDP SVA GDP
in the MCMC algorithm. # estimated models 1 S 1
# total variables 1+M 1 1
We assess properties of the estimation algorithm in the DFM case using a set of different Forecast D WS D
λ 0.2 large large
diagnostics. Geweke’s spectral-based measure of relative numerical efficiency (RNE, see Reference equation (5) (6) (7)
e.g. Geweke (2005)) suggests that efficiency loss of the algorithm due to the remaining Note: (SVA) Sector value added series, (S) The number of sectors, (M) The amount of macro variables.
Forecast describes how the aggregation of the forecasts to GDP is done: (WS) GDP is the weighted sum
autocorrelation in these evaluated draws is minimal.8 The efficiency loss is less than 50 of the sectoral growth forecasts, (D) GDP growth is directly forecast.
percent for almost all the parameters, i.e. vis-à-vis a hypothetical independence chain,
we need no more than half the amount of additional draws to achieve the same numerical
precision. Moreover, with a value between 7 and 9, depending on the sample, the maximum
inverse RNE is well below the critical threshold discussed in the literature (see e.g. Carriero 4 Data
et al. 2014, Baumeister and Benati 2013 or Primiceri 2005). Additionally, we investigate
7
Note that in principle, it is possible to estimate the weight based on marginal data densities (Giannone We fit the models to production-side national account data for Switzerland and the euro
and Primiceri, 2015). As we re-estimate our models many times in our forecasting evaluation, and the
calculation of the marginal data density is not available in an analytical form in the DFM case, we refrain area. Real value added time series on a quarterly frequency are provided by the Swiss
from this. A numerical approximation to the marginal data density is possible in principle, but the
accuracy of such estimators deteriorates with growing dimensionality of the parameter space. See e.g. Confederation’s State Secretariat for Economic Affairs (SECO, starting in 1990) and
Fuentes-Albero and Melosi (2013) for a Monte Carlo study and Bäurle (2013) for an application.
8
The spectrum at frequency zero is calculated using a quadratic spectral kernel (Neusser, 2009). Eurostat (starting in 1996) respectively. In contrast to the quarterly GDP series for
12 13
12 13the US, the estimation of GDP in Switzerland and in the euro area are both calculated as Figure 1: GDP growth and its dispersion: Time series
the sum of the individual production sectors. Switzerland publishes the production-side
at a slightly more disaggregate level than Eurostat. For instance, banking and insurance
services are reported as separate accounts in Switzerland (and together account for a tenth
of GDP) but are merged together in the euro area (where the equivalent share is less than
5 percent of GDP). Overall, the models include a diversified set of industry and services
sectors - 13 for the Swiss models and 10 for the European models - which together sum
up to GDP.9 A full descriptive summary of the sectoral series, their volatility, correlation
with GDP and autocorrelation is documented in Tables 2 and 3.
These two tables also report the descriptive statistics for total GDP growth rates. The
aggregate picture is very similar for Switzerland and the euro area: In the estimation
Note: Aggregate vs. disaggregate time series in Switzerland and the euro area. The cross-sectoral standard
sample, the mean of quarterly GDP growth was 0.38 and 0.39 percent, respectively. Euro deviation in a given quarter is displayed in blue; both the highest and lowest sectoral growth rates in the
respective time period are given as grey.
area GDP growth is only marginally more volatile. The persistence of aggregate growth
rates, measured as the first-degree autocorrelation, is higher in the euro area, but overall, Another measure of comovement can be obtained by computing each sector’s correlation
the aggregate characteristics of both GDP series display a high degree of similarity. Figure with aggregate value added, as in Christiano and Fitzgerald (1998), weighted by the
1 shows, however, that the downturn during the Great Recession was much more severe respective nominal shares. We repeat the computation in a rolling window of two years
in the euro area than in Switzerland. and get a time-varying estimate of sectoral comovement that is displayed in Figure 2.10
At the disaggregated sectoral level, the Swiss series are, without any exception, more While the level of comovement is on average higher in the euro area, it is also subject to
volatile than their euro area counterparts and less correlated with the aggregate dynamics, stronger fluctuations. In both economic areas, regimes of high and low comovement can
indicating that sector-specific features play a larger role in Switzerland. Manufacturing be identified. In general, recessions are associated with high comovement, indicating that
production, typically a sector that shows a high correlation with GDP, is the only series economic contractions often affect a large share of the production sectors, but booms can
with a contemporaneous correlation coefficient higher than 0.50. as well, as the economy expands on a broad base. These series allow us to assess whether
the forecasting performance varies with the degree of comovement in the target variables.
Besides the growth path of aggregate GDP, Figure 1 shows the time series of cross-sectoral
standard deviations of sectoral value added growth. Cross-sectoral dispersion is higher In addition to the value added series, a set of observable macro factors enters the system
in Switzerland throughout the entire estimation sample. It tends to be countercyclical; of equations. Key economic variables include inflation (CPI and HICP, in log differences)
dispersion typically peaks in recession episodes. Furthermore, the strongest and weakest and the nominal short-term interest rates (CHF Libor and Euribor). As Switzerland is a
growing sectors for every quarter are displayed in grey. While these tail sectors are closely small open economy, in the Swiss models we add a nominal effective exchange rate vis-à-vis
related to aggregate dynamics in the euro area, the divergence in Switzerland is striking. its most important trading partners as well as a measure of world GDP. Both series are
9
An advantage of using the production side to forecast GDP is that it is not necessary to produce a 10
The comovement time series is defined as ρct = S s s
s=1 ωs,t−1 ρt , where ρt is the correlation coefficient
forecast for the inventories, which are often not explicable and therefore hardly predictable. of GDP and the growth rates of each sector s over the 8 quarters subsequent to time period t.
14 15
14 15Figure 2: GDP growth and sectoral comovement: Time series Table 2: Sectoral value added growth Statistics for Switzerland
Variable Share Mean Std Corr Auto
GDP 100.00 0.38 0.57 1.00 0.50
Manufacturing (10-33) 19.44 0.48 1.66 0.73 0.23
Energy (35-39) 2.36 -0.08 2.72 0.11 0.10
Construction (41-43) 5.50 -0.01 1.42 0.14 0.21
Trade, repair (45-47) 14.16 0.47 1.07 0.49 0.66
Transportation, ICT (45-53, 58-63) 8.38 0.33 1.13 0.38 0.60
Tourism, gastronomy (55-56) 2.02 -0.08 2.06 0.33 0.31
Finance (64) 6.07 0.51 3.52 0.43 0.34
Insurance (65) 4.33 1.02 0.87 0.13 0.83
Professional services (68-75, 77-82) 15.31 0.29 0.57 0.36 0.56
Public administration (84) 10.39 0.26 0.42 0.19 -0.00
Health, social services (86-88) 6.46 0.70 0.83 0.16 0.20
Recreation, other (90-96) 2.10 -0.07 2.38 0.14 0.45
Taxes (+) and subsidies (-) 3.47 0.45 0.93 0.39 0.36
Note: Aggregate vs. disaggregate time series in Switzerland and the euro area. Sectoral comovement is
Note: NOGA codes in brackets. Share is the average of nominal sectoral value added as a share of
calculated as a weighted correlation coefficient of each sectoral value added with the aggregate, with a
GDP between 1990 and 2017. Mean and standard deviation of quarterly log differences, as well as their
rolling window of 8 quarters.
correlation with aggregate real GDP growth and first-degree autocorrelation.
weighted with respect to exports and are defined in log differences. Table 3: Sectoral value added growth statistics for the euro area
Our evaluation is based on pseudo out-of-sample forecasts because the availability of Variable Share Mean Std Corr Auto
real-time vintages is too limited. We use a dataset based on the first quarterly vintage GDP 100.00 0.39 0.59 1.00 0.66
Industry (C-E) 19.01 0.40 1.47 0.88 0.54
of 2018, which contains data between 1990-Q1 and 2017-Q4 for Switzerland and 1996-Q1 Construction (F) 5.16 -0.09 1.09 0.59 0.29
and 2017-Q4 for the euro area. The next sections describe the evaluation exercise and the Trade, transport, tourism (G-I) 17.46 0.42 0.76 0.92 0.54
ICT (J) 4.22 1.21 1.11 0.54 0.35
results in detail. Finance, insurance (K) 4.52 0.32 1.01 0.34 0.28
Real estate (L) 9.82 0.41 0.45 0.24 -0.03
Professional services (M-N) 9.37 0.54 0.96 0.82 0.40
Public administration (O-Q) 16.98 0.28 0.18 0.26 0.21
Recreation, other (R-U) 3.17 0.29 0.49 0.57 0.40
Taxes (+) and subsidies (-) 10.27 0.31 0.94 0.63 0.07
Note: NACE Rev.2 codes in brackets. Share is the average of nominal sectoral value added as a share of
GDP between 1996 and 2017. Mean and standard deviation of quarterly log differences, as well as their
correlation with aggregate real GDP growth and first-degree autocorrelation.
16 17
16 175 Evaluation of point forecasting performance benchmark, however, is produced almost a quarter later. As the SPF not only relies on
national accounts data but also on respondents’ judgement of a set of early indicators, this
We conduct an out-of-sample forecast evaluation exercise where we assess the models’ extra quarter gives the forecasters a sizeable informational advantage. As an illustrative
accuracy in terms of predicting growth in the aggregate. example, a sample of around 50 respondents to the survey submit their forecast in early
Out-of-sample forecasts are produced for the twelve years between 2005-Q1 and 2016-Q4. 2015-Q1, at which point national accounts data for the preceding quarter have not yet
The size of the training data sample (1990-Q1 to 2005-Q1 for Switzerland and 1996-Q1 been published, making 2015-Q3 the target period. The rolling forecast horizon for one
and 2005-Q1 for the euro area) is sufficient to produce stable estimation results. The last year ahead of the latest available observation therefore effectively implies a forecast horizon
year of the sample is cut off, because end-of-sample data is often subject to substantial of only 3 quarters, giving the SPF a considerable head start.
future revisions and should not be interpreted as the final vintage (Bernhard, 2016). For The following section presents and discusses the relative performance of the competing
this reason, 48 complete vintages are evaluated. models. The absolute performance, where every model’s capabilities in terms of bias and
As the models are geared toward capturing complex, dynamic interlinkages in the national efficiency of short-run forecasts are evaluated by means of Mincer-Zarnowitz regressions,
accounts, we do not focus on the predicted growth in any specific quarter h periods in is displayed in the appendix.
the future, but want to assess the models’ capability to forecast cumulative growth over a
range of quarters. For the short run, we produce iterated forecasts for the first four periods 5.1 Relative performance of aggregate forecasts
ahead; the cumulative sum commensurates to a year-on-year growth rate. The respective
The relevant metric by which we compare errors across models is the square root of the
evaluation for the second year to be forecasted, which consists of the projected growth from
mean squared error (RMSE):
5 to 8 quarters ahead, is denoted the medium run. This resembles the forecasts conducted
by the ECB Survey of Professional Forecasters (SPF), where survey respondents are asked
T
1
RM SEm,h =
e2
to provide forecasts over a rolling horizon, that is an annual growth rate for the quarter T t m,h,t
one (two) years ahead of the latest available observation.
The respective measures are displayed as part of Table 4 and summarised in Figure 3.
If yt is the log difference of the realised target variable from t = 1, ..., T , then the cumulative
To keep the representation of the results tractable, we do not report measures for all
growth over four quarterly periods is denoted as ỹt|t−h = h−1 i=h−4 yt−i . Accordingly, ŷt|t−h
forecast horizons separately, but restrict ourselves to two horizons: The short run (SR) is
is the cumulative sum of the four steps leading up to the h quarters ahead. Errors are then
the cumulative forecast error over the first two quarters and the medium run (MR) is the
defined as the difference from the cumulated quarterly growth rates, eh,t ≡ ŷt|t−h − ỹt,t−h .
cumulative forecast error over eight quarters. As the uncertainty to forecast a path over
For the euro area, forecasts from the Survey of Professional Forecasters (SPF), conducted several quarters increases in h, so does the expected forecast error.
and published by the European Central Bank, are used as an additional benchmark. Note
that all models under evaluation fight an uphill battle against the Survey of Professional
Furthermore, we use a test following Diebold and Mariano (1995) to assess whether the
Forecasters due to the frequency of real-time data releases. Given that all models described
difference of squared errors of a given model and that of a simple benchmark is statistically
rely on national accounts data only, forecasts for all quarters ahead can be updated
significant. As a benchmark we use the simplest of our models, the autoregressive process
approximately 30 days into the quarter, when the first estimate is released. The SPF
18 19
18 19Figure 3: Root mean squared errors compared For Switzerland, the different models produce short-run forecasts that are not significantly
different from each other.11 With a longer forecast horizon, a significant pattern emerges:
The DFM has the lowest errors over the medium run, with an improvement of 12 percent
relative to the aggregate AR. According to our test procedure, this difference is significant
at the 10 percent significance level. In contrast, the VAR-L, which relies on the same
variables but does not impose the factor structure, performs substantially worse than the
DFM. This indicates that shrinking the parameter space by using the factor model proves
to be crucial for medium-run forecast performance.
Among the simpler benchmarks, the RMSE show that in Switzerland, where sectoral
of the aggregate target variable, AR-A. comovement is relatively weak, using disaggregated series helps to improve the medium-run
forecast: Both the sectoral AR-S and VAR-S beat their aggregate counterparts.
e2m,h,t − e2AR-A,h,t = βDM + ut , H0 : βDM = 0
Errors for euro area GDP forecasts are generally higher, especially in the medium run.
This can partly be explained by a limited training sample for estimation and the fact that
Table 4 contains the results. If the regression coefficient is negative, the respective model
the downturn during the Great Recession was much more severe in the euro area than in
has beaten the benchmark on average over the evaluation period.
Switzerland and that such strong fluctuations are difficult for any model to capture. This
is especially true for the univariate models. Indeed, both in the short run as well as in the
Table 4: RMSE and Diebold-Mariano test coefficients
medium run, the AR-A and AR-S models perform badly for the euro area.
DFM VAR-L VAR-S VAR-A AR-S AR-A
In the presence of such a large economic shock, more sophisticated models provide superior
Switzerland
RMSE SR 1.81 1.88 1.85 1.89 1.83 1.83 results. The short-run forecasts of the DFM and of both VAR benchmarks have errors
MR 1.70 1.96 1.83 1.96 1.84 1.93
Diebold-Mariano: βDM SR -0.06 0.19 0.10 0.21 -0.00 - that are 24 percent lower than the aggregate AR. All models perform substantially worse
(0.46) (0.76) (0.86) (0.83) (0.22) - than the SPF in the short run. This is not surprising given that, as mentioned above, it is
MR -0.84 0.11 -0.38 0.10 -0.33 -
(0.43) (0.46) (0.44) (0.69) (0.10) - produced almost one quarter later, when it is possible to exploit evidence from a broader
Euro area set of (monthly) economic indicators that correlate with GDP growth. In the medium run,
RMSE SR 2.55 3.19 2.85 2.52 3.29 3.36
MR 2.60 4.32 3.15 2.47 5.39 4.18 the DFM and the VAR-A are competitive with the SPF. These models perform better than
Diebold-Mariano: βDM SR -4.77 -1.08 -3.12 -4.91 -0.43 - simple benchmarks, even if it is difficult to establish an improvement in terms of statistical
(3.90) (1.66) (1.21) (2.61) (0.57) -
MR -10.75 1.16 -7.49 -11.40 11.58 - significance.
(11.66) (2.32) (6.85) (10.26) (10.69) -
Note: Newey-West standard errors in brackets
Overall, these findings show that including sector information can lead to more accurate
point estimates. The best performance, however, comes from the DFM model, which
11
The RMSE for h = 1 are depicted in the appendix for reference. The results show that for one quarter
ahead, the DFM and the VAR-S produces the best results.
20 21
20 21simultaneously models the sectoral value added series and macroeconomic variables while Figure 4: Decomposition of error variances into a sectoral error
component (grey) and a comovement component (colourised)
shrinking the parameter space by imposing a factor structure.
5.2 Decomposition of the forecast error variance
One strength of the multivariate models is that they are, in principle, able to capture joint
dynamics between sectors. In the below section, we investigate whether the differences
in performance documented previously are indeed driven by differential capabilities to
capture the joint dynamics. In order to do so, we exploit the fact that in the case of the
sectoral models, the aggregate error is a weighted sum of the sectoral errors, and decompose
its variance into the sum of the sectoral forecast error variances and covariances:12
euro area data, the reduction in variance of the aggregate error due to lower covariance of
S
Var(ey ) = Var ωs e s sectoral errors is more distinct. The sectoral models produce substantially lower covariance
s=1
S terms. The differences between aggregate and disaggregate benchmark models can be
= ωs2 Var(es ) +2 s ς
ωs ως Cov(e , e ) (8)
attributed to the differences in the information set and also to the quite rudimentary
s=1 1≤sTable 5: Decomposition of the forecast error variance Table 6 show that the relative model ranking presented in section 5.1 is indeed driven by
DFM VAR-L VAR-S VAR-A AR-S AR-A low comovement periods to a large extent. The differences between the models is much
Switzerland less distinct in times of high comovement.
Variance of aggregate errors SR 0.34 0.36 0.35 0.35 0.36 0.36
Sectoral error variance SR 0.25 0.27 0.24 0.23 0.24 0.23 In low comovement regimes, estimating models at the sectoral improves the medium-term
as a share (0.74) (0.75) (0.67) (0.64) (0.66) (0.63)
Sectoral error covariance SR 0.09 0.09 0.12 0.13 0.12 0.13 forecasts. As with the results in section 5.1, the univariate AR models in the euro area
as a share (0.26) (0.25) (0.33) (0.36) (0.34) (0.37) are an exception. Here, the aggregate process performs better than the sectoral one.
Variance of aggregate errors MR 0.34 0.36 0.35 0.36 0.36 0.38
Sectoral error variance MR 0.25 0.25 0.24 0.23 0.24 0.23 Furthermore, the VAR-L performs poorly, while the DFM, which not only includes the
as a share (0.71) (0.69) (0.68) (0.64) (0.66) (0.61)
sectoral series jointly but also manages to filter relevant information at the disaggregate
Sectoral error covariance MR 0.10 0.11 0.11 0.13 0.12 0.15
as a share (0.29) (0.31) (0.32) (0.36) (0.34) (0.39) level, produces the most accurate forecasts.
Euro area
Variance of aggregate errors SR 0.49 0.81 0.66 0.55 0.82 0.85 In contrast, in times of high comovement, i.e. when the sectoral idiosyncratic factors are
Sectoral error variance SR 0.17 0.30 0.26 0.17 0.41 0.21
less important and the sectors develop more homogeneously, the gain of disaggregation
as a share (0.35) (0.38) (0.39) (0.31) (0.50) (0.25)
Sectoral error covariance SR 0.32 0.50 0.40 0.38 0.41 0.64 is much smaller. The sectoral approach does not lead to a systematic improvement in
as a share (0.65) (0.62) (0.61) (0.69) (0.50) (0.75)
Variance of aggregate errors MR 0.51 1.33 0.71 0.58 1.86 1.29 the RMSE. Interestingly, the relative forecasting performance of the VAR-L improves
Sectoral error variance MR 0.17 0.43 0.25 0.12 1.14 0.27 markedly in times of high comovement, while the DFM loses its comparative advantage.
as a share (0.32) (0.33) (0.36) (0.20) (0.61) (0.21)
Sectoral error covariance MR 0.35 0.89 0.46 0.40 0.72 1.02 By contrast, we find no systematic differences between times of high vs low growth rates
as a share (0.68) (0.67) (0.64) (0.69) (0.39) (0.79)
or high vs low volatility of quarterly GDP growth rates.14
of low comovement. In order to assess this hypothesis, we divided the evaluation period All in all, this exercise shows that when the heterogeneity across sectors is high, 15 models
into periods of high and low comovement.13 . We calculate the RMSE on the subsample including sectoral series perform better than their aggregated counterparts. During such
of errors from high and low comovement periods respectively. periods, the DFM produces the most accurate forecasts, in line with the original hypothesis
of Taylor (1978).
Table 6: RMSE in high/low sectoral comovement regimes
DFM VAR-L VAR-S VAR-A AR-S AR-A
Switzerland 6 Evaluation of density forecasting performance
Low comovement MR 1.31 1.95 1.79 2.01 1.60 1.73
High comovement MR 2.01 1.97 1.86 1.90 2.05 2.11
Point forecasts do not capture the uncertainty around which a central prediction is made.
Euro area
Low comovement MR 1.42 5.32 3.27 1.86 6.89 4.98 Density forecasts have, therefore, become an increasingly popular tool to communicate
High comovement MR 3.39 3.00 3.02 2.93 3.35 3.17
how likely it is that the predictions will fit the realisation. We devote this section to the
14
An analysis of the time variation in the forecasting performance along the lines of Rossi (2013) turned
Table 6 shows the results in high and low comovement regimes for the medium term. out not to deliver major insights due to the short sample; see Figure 7 in the Appendix. However, cumulated
errors (Figure 8) reveal that the DFM’s good performance is attributable to the period before the financial
Systematic differences in the short-term forecasts could not be found. The results in crisis, while it declines somewhat in the aftermath.
15
Regimes of high heterogeneity can, for example, include periods around turning points at the peaks of
13
This allocation into a ‘high’ or ‘low’ period is defined using the comovement measure as in Christiano a business cycle, as documented by (Chang and Hwang, 2015) for the US manufacturing industries.
and Fitzgerald (1998) (see Figure 2)
24 25
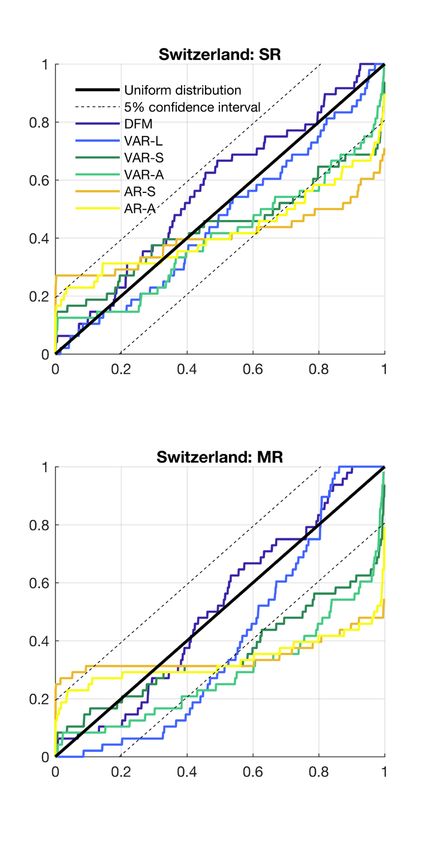
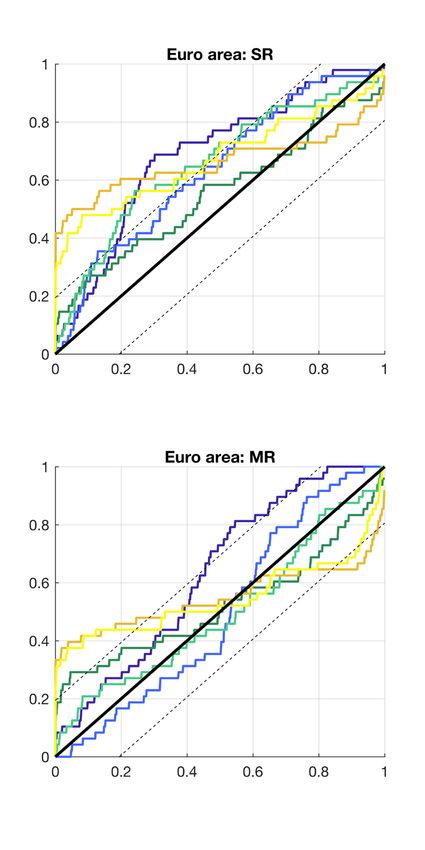
24 25evaluation of the predictive densities of our models. For each model m, we simulate from Figure 5: Empirical cumulative distribution of PIT vs uniform
the Bayesian posterior distribution of the forecasts in order to determine the density of
the cumulative forecast φ(ŷm,t|t−h ).
The fundamental problem of evaluating density forecasts in contrast to point forecasts
is that the actual density is unobserved, i.e. we observe just one realisation, not many
realisations of the same density. A number of methods have been developed to address
this. These include the probability integral transforms (PIT), evaluations based on the
log score and, related to this, the ranked probability score. We discuss the results based
on these measures in the following sections.
6.1 Predictive accuracy: Probability integral transform
To assess whether the predictive density is correctly specified, we compute probability
integral transforms (PIT), i.e. we evaluate the cumulative density of a given forecast up
to the realised value.
yt
P ITm,h,t = φt (ŷm,t|t−h )dŷm,t|t−h ≡ Φt (ŷm,t|t−h )
−∞
Note: PITs for ordered realised values are on the horizontal axis, the corresponding distribution of the
realised value (i.e. the fraction of draws that is lower than the corresponding realised value) on the vertical
A PIT of 0 indicates that, in advance, no probability was assigned to the possibility that axis.
growth could be lower than the realised value of the target variable. If the PIT has the
(2013). Based on a fine grid r ∈ [0, 1] we calculate
maximum value of 1, then all the predictive density underestimated the realisation. For
any well-behaved density forecast, the PIT should be uniformly distributed between 0 and
ξm,t|t−h (r) ≡ (1{Φt (ŷm,t|t−h ) ≤ r) − r})
1 (Diebold et al., 1998). On average over time, the probability that the realised value is
lower than the forecasted value should be the same no matter whether we consider high for every grid point.16 For low values of r, the indicator is typically zero and thus ξ(r) is
or low realisations. Figure 5 shows the empirical cumulative distribution of GDP PITs negative but small. For r in the region of a half, dispersion of the ξ(r) vector is highest as
against the theoretical uniform distribution and its confidence interval. some values are close to 0.5 and some close to -0.5. And for values close to 1, the indicator
function is usually 1, and thus ξ(r) positive and small. For every grid point, we calculate
If they followed a uniform distribution, their empirical cumulative distribution function
16
Conveniently, one can set the grid r so as to put a special emphasis on parts of the distribution which
(CDF) would follow the 45-degree line. To test this formally, we apply an augmented are of particular interest, such as lower and/or upper tails.
version of the Kolmogorov-Smirnov test for uniformity, which accounts for the fact that
model parameters are estimated on a finite sample, as proposed by Rossi and Sekhposyan
26 27
26 27the objective, whose absolute value we maximise 6.2 Relative performance: Ranked probability score
1
T
When comparing the predictive densities across models, scoring rules derived from the
κKS = sup √ ξm,t|t−h (r)
r T
t concept of PIT are helpful tools. Various scoring rules such as loss functions may help
The resulting κKS is evaluated against critical values obtained from a simulation: In a evaluate models against alternatives (Giacomini and White (2006), Kenny et al. (2012),
large number of Monte Carlo replications, we draw T random variables from the uniform Boero et al. (2011)). We separate the argument space of the probability density into
distribution, calculate κ and use the (1 − α)-th percentile of all simulations as the critical mutually exclusive events, which can be thought of as bins k = (1, 2, ..., K) in the predictive
value for the α significance level. If κKS > κα , then the test rejects that the empirical density of the forecast. We use K = 16 intervals set according to the Survey of Professional
distribution could be the result of a uniform data-generating process at the α percent Forecasters.17 Every bin is assigned a probability from the distribution, for example for the
v(k=1)
significance level. The corresponding p-values are reported in Table 7. first bin ψm,k,t = −∞ φ(ŷm,t|t−h )dŷm,t|t−h . Additionally, we define a vector of length
K with binary values: 1 if the realised value is within the respective bin and 0 otherwise
The two left-hand side panels of Figure 5 show the CDFs for Switzerland. The DFM
(dm,1,t , dm,2,t , ..., dm,K,t ). Then the inherently Bayesian predictive likelihood score (log
narrowly follows the pattern of the uniform distribution for most of the distribution, both
score) would be defined as follows:
for the short run and the medium run. The test of uniformity for the VAR-L cannot
be rejected, although there are some deviations at the lower end of the distribution 1
T K
Sm,h = Sm,h,t , Sm,h,t = dm,k,t log(ψm,k,t )
for the medium-run CDF. The rather convex CDF of the benchmark VARs (in green) T t
k
indicate the opposite: too often, the PITs are at the very high end, indicating that the
A problem with the log score arose as the specific bin of realisations was assigned a
models significantly underestimate the probability of high growth rates. The univariate
probability of zero such that the log of zero would be negative infinity for a substantial
models, both on the aggregate and sectoral level, have an inverted S-shape. This pattern
fraction of forecasts for the smaller benchmark models. A possible fix would imply reducing
is especially pronounced for the medium run and suggests that uncertainty has been
the number of bins to make sure every bin carries positive probability, but this would
underestimated with these models.
ultimately violate the purpose and spirit of the exercise.
For the euro area, the CDFs show that the PITs are overall less uniformly distributed than
We therefore use the ranked probability score (RPS, or Epstein score) as the alternative,
for Switzerland. By inspection, the VARs perform better than the DFM and, of all models
which is a measure of the cumulative probabilities and indicators.
under consideration, this is the one that most closely follows the uniform distribution.
The RPS is defined as follows:
However, for the VAR-S only, the null of a uniform distribution cannot be rejected at the
5% level. Using euro area data, the DFM tends to overestimate the realised values. Over k
k
Ψm,k,t = ψm,j,t , Dm,k,t = dm,j,t
the entire range, the realised probability is lower than the model implied. However, this j=1 j=1
misalignment is also visible for the univariate benchmarks. Overall, density forecasts for
T K
1
the euro area perform worse than for Switzerland. Again, this may be related to the fact RP Sm,h = RP Sm,h,t , RP Sm,h,t = (Ψm,k,t − Dm,k,t )2
T t
k
that the estimation sample is quite short in this case.
17
The partitioning of half a percentage point is used on a grid between annual growth rates from -3 to
4 percent.
28 29
28 29You can also read