FORECASTING URBAN POPULATION GROWTH IN THE PHILIPPINES USING AUTOREGRESSIVE INTEGRATED MOVING AVERAGE (ARIMA) MODEL
←
→
Page content transcription
If your browser does not render page correctly, please read the page content below
ISSN (Online): 2455-3662
         EPRA International Journal of Multidisciplinary Research (IJMR) - Peer Reviewed Journal
         Volume: 8| Issue: 7| July 2022|| Journal DOI: 10.36713/epra2013 || SJIF Impact Factor 2022: 8.205 || ISI Value: 1.188

         FORECASTING URBAN POPULATION GROWTH IN THE
         PHILIPPINES USING AUTOREGRESSIVE INTEGRATED
                MOVING AVERAGE (ARIMA) MODEL

         Liana Neil C. Estoque1, Leanna Marie D. Dela Fuente2, Romie C. Mabborang3,
                                     Marivic G. Molina4
               1,2,3,4
                         Pamantasan ng Lungsod ng Maynila, Muralla Street, Intramuros, Manila, Philippines,1002

                                                                                    Article DOI: https://doi.org/10.36713/epra10819
                                                                                                         DOI No: 10.36713/epra10819
                                                                 ABSTRACT
The Philippines is one of the fastest urbanizing countries in the East Asia and Pacific region (Baker & Watanabe, 2017). Despite having its
advantages, urbanization still has its challenges that require extensive urban management and development programs for it to be prevented and
minimized. In this paper, the researchers forecasted the urban population growth of the Philippines using the Autoregressive Integrated Moving
Average (ARIMA) Model. The historical data obtained from the World Bank Group was from 1960 to 2020. The R Programming Language was
used as the medium for the entire forecasting process. Autocorrelation Function (ACF) and Partial Autocorrelation Function (PACF) plots,
Augmented Dickey-Fuller (ADF) test, Phillips-Perron (PP) test, and Kwiatkowski, Phillips, Schmidt, and Shin (KPSS) test were used for testing
the stationarity of the time-series data. Moreover, Akaike Information Criteria (AIC), Corrected Akaike Information Criterion (AICc), and
Schwarz Information Criteria (SIC) were used as criteria for selecting the best ARIMA model. It was shown that the best ARIMA model for
forecasting the urban population growth of the country is ARIMA (20, 1, 10). This model has been formulated and chosen through the
mentioned statistical tests, and criteria for validation, and was further validated using error measures. The chosen ARIMA model was proven to
be accurate based on the Root Mean Square Error (RMSE) of 0.18877 and the Mean Absolute Percentage Error (MAPE) of 3.71%. The
researchers found an increase in the trend of 1.95% by 2022, 2.08% by 2024, 2.19% by 2026, and 2.36% by 2028. This potential rise in urban
population growth in the Philippines may improve the economy of the country for the next 6 years, but this could also imply that the underlying
issues of urbanization may get worse. The researchers conclude that the Philippine national government and local government units should have
better and strengthened urban management and development programs to aid these problems. Government officials and even private sectors may
use this paper as a reference to have an informed decision and policy-making.
KEYWORDS: Autoregressive Integrated Moving Average (ARIMA) Model, Box-Jenkins Method, Urbanization, Urban Population Growth,
Forecast, R Programming Language

1. INTRODUCTION
1.1 Background of the Study
          Urbanization is a process of forming cities wherein a population moves from rural areas to urban areas. The rate of increase
of this population is referred to as urban population growth. According to the World Bank (2020), 55%, or 4.2 billion people, of the
population of the world live in cities. This continuing growth of the urban population can contribute to sustainable growth since 80%
of global gross domestic product (Gis is generated in cities – where opportunities such as jobs, education, services, and innovation are
available for lifting people out of poverty. However, if not managed and planned well, urbanization may lead to numerous detrimental
effects such as congestion, slums, pollution, inequality, and crime.
          The Philippines is one of the most rapidly urbanizing nations in the East Asia and Pacific region (Baker & Watanabe, 2017).
The percentage of the population residing in urban areas in the country reached 51.2%, or 51.73 million people, in 2015 according to
the Philippine Statistics Authority (2019). Overall, the urban density is high, particularly in Metro Manila which is one of the fastest-
growing wing cities. Furthermore, even though urbanization in the Philippines had increased its productivity, economic growth, and
poverty reduction, it still has not benefited as much compared to other countries due to several underlying structural issues and
environmental issues affecting urbanization in the country (World Bank Organization, 2017). Decision-making and policy-making
play a crucial role in minimizing the negative effects of urbanization. Moreover, to properly utilize urbanization in the country, it is
important to understand urbanization. Forecasting the urban population in the Philippines will help in delivering a clearer picture of

                                             2022 EPRA IJMR |   www.eprajournals.com | Journal DOI URL: https://doi.org/10.36713/epra2013
                                                                                                                                            132
ISSN (Online): 2455-3662
EPRA International Journal of Multidisciplinary Research (IJMR) - Peer Reviewed Journal
Volume: 8| Issue: 7| July 2022|| Journal DOI: 10.36713/epra2013 || SJIF Impact Factor 2022: 8.205 || ISI Value: 1.188
the impacts of urbanization. The government and private sectors may use the formulated model to have informed decisions in
mitigating the risks of urbanization in the country.
With this, the researchers decided to forecast the urban population growth of the Philippines using the Box-Jenkins
Methodology for formulating the best Autoregressive Integrated Moving Average (ARIMA) model based on the gathered historical
data. This paper focuses on finding the best ARIMA model for forecasting the urban population growth of the country until the year
2028 to find an insightful idea of future trends of urbanization in terms of population growth and to lessen its negative impacts through
informed decision making.
1.2 Conceptual Framework
An illustration that depicts the conceptual framework of the study is shown in this part. It contains the main concepts of the
study for forecasting the urban population growth in the Philippines using the best ARIMA model, which is briefly explained below.
Figure 1.1
Conceptual Framework for Forecasting Urban Population Growth using ARIMA Model
Figure 1.1 shows the conceptual framework for this study. The annual urban population growth data of the Philippines from
1961 to 2020 was gathered from an online data source – World Bank (data.worldbank.org). This data was organized using Microsoft
Excel. Afterward, the researchers used statistical software – RStudio – for data analysis. This study used the Box-Jenkins
Methodology to come up with the best autoregressive integrated moving average (ARIMA) model for forecasting. Statistical tests,
selection criteria, and error measures were used for determining the best ARIMA model for forecasting the urban population growth in
the country. Finally, significant conclusions were drawn from the forecasted data.
1.3 Statement of the Problem
The objective of this study is to forecast the urban population growth of the Philippines using the ARIMA model.
Specifically, it aims to answer the following questions:
1. What is the best ARIMA model for forecasting urban population growth in the Philippines?
2. How accurate is the best ARIMA model in forecasting urban population growth in the Philippines?
3. What is the forecasted urban population growth in the Philippines for the years 2022, 2024, 2026, and 2028?
4. What are the probable implications of the forecasted urban population growth in the Philippines?
2. LITERATURE REVIEW
There is no universal definition for urban. In the Philippines, the National Statistical Coordination Board (2003) has released
a resolution regarding the adoption of the operational definition of urban areas. Urban areas in the country are defined as the
following:
if a barangay has a population size of 5,000 or more; or
if a barangay has at least one establishment with a minimum of 100 employees; or
if a barangay has 5 or more establishments with a minimum of 10 employees and 5 or more facilities within the two-
kilometer radius from the barangay hall.
The Philippine Statistics Authority (2019) reported that the level of urbanization in the Philippines has reached 51.2% based
on the results of their 2015 census of population. 51.73 million people reside in barangays that are classified as urban — 7,437
(17.7%) barangays are classified as urban and 34,599 (82.3%) as rural. For comparison, the level of urbanization in 2010 was 45.3%
only. In 2015, the level of urbanization in the Philippines was 51.2%. The National Capital Region (NCR) is classified as entirely
(100%) urban whereas Region IV-A was 66.4%, Region XI was 63.5%, Region III was 61.6%, and Region XII was 51.6% — which
all surpassed the national level of urbanization. Additionally, three component cities, namely, Cabuyao City and Santa Rosa City in
Laguna, and Antipolo City in Rizal, are classified as entirely urban, as well as five municipalities, namely, Jolo in Sulu, Kalayaan in
Laguna, Marilao in Bulacan, Talaingod in Davao del Norte, and Taytay in Rizal. In 2015, the mentioned cities and municipalities had
at least 50% of their population residing in urban barangays.
2022 EPRA IJMR | www.eprajournals.com | Journal DOI URL: https://doi.org/10.36713/epra2013
133ISSN (Online): 2455-3662
EPRA International Journal of Multidisciplinary Research (IJMR) - Peer Reviewed Journal
Volume: 8| Issue: 7| July 2022|| Journal DOI: 10.36713/epra2013 || SJIF Impact Factor 2022: 8.205 || ISI Value: 1.188
As per PSA Board Resolution No. 01, Series of 2017 - 99, urban barangays are classified into 3 categories: Category 1 has at
least 5,000 population size; Category 2 has at least one establishment with 100 or more employees, and Category 3 has at least 5
establishments with 10 to 99 employees and at least 5 facilities within a two-kilometer radius from the barangay hall. More than half
— 53% — of the urban barangays in areas outside NCR were classified under Category 1 in 2015. Meanwhile, 17.6% and 29.4% of
the urban barangays outside NCR were classified as Category 2 and Category 3 respectively.
The urbanization of the Philippines has a huge potential. According to Baker & Watanabe (2017), the Philippines is one of
the fastest urbanizing countries in East Asia and the Pacific which brings opportunities for growth and poverty reduction if well
managed. New jobs, educational opportunities, and better living conditions are some of the benefits of this rapid urbanization in the
country. However, its negative effects and challenges remain. For instance, the large sprawling metropolitan area of over 12 million
Metro Manila has congestion that is estimated to cost 3.5 billion pesos a day. Along with this, clogged or non-existent drains that
cause floods and the lack of affordable housing that causes people to live in slums are some of the issues that the municipalities in the
metropolitan area try to address.
Philippine Urbanization Review, Fostering a System of Competitive, Sustainable and Inclusive Cities — a report by World
Bank Organization (2017), has mentioned priorities for a bold reform agenda. First, to improve the delivery of necessary
infrastructure, services, and sustainable urban planning, the binding constraints of weak institutions have to be addressed. Next, to
open up land markets for city competitiveness, land administration management has to be improved. Furthermore, the report also calls
for investments in infrastructure, more affordable mass transport, simplification of licensing requirements for attracting more
investments, a focus on affordable housing and delivery of basic services, and encouraging less fortunate children to pursue education
for better job opportunities.
Baker & Watanabe (2017) argued that cities can become engines for competitive, sustainable, and inclusive growth that gives
residents long-term opportunities if the government, private sector, and civil society can address these challenges with a needed
urgency for action.
Paul et al. (2013) selected the best ARIMA model for forecasting the average daily share price index of pharmaceutical
companies in Bangladesh in a case study. The models were compared using the Akaike Information Criteria (AIC), Corrected Akaike
Information Criteria (AICc), Schwarz Information Criteria (SIC), Mean Absolute Percent Error (MAPE), Root Mean Square Error
(RMSE), and Absolute Mean Error (AME) as criteria in finding the best ARIMA model. The authors followed the characteristics of a
good ARIMA model, as listed below:
It is stationary – has an AR coefficient that satisfies some mathematical inequalities.
It is invertible – has an MA coefficient which satisfies some mathematical inequalities.
It is parsimonious – uses the small number of coefficients needed to explain the available data.
Has statistically independent residuals.
Has a high-equality estimated coefficient at the estimation stage.
Fits the available data sufficiently well at the estimation stage.
The RMSE is acceptable.
The MAPE is acceptable.
Has sufficiently small forecast errors – forecasts the future satisfactory.
Furthermore, the best ARIMA model that was selected has the maximum number of lowest values of all the selected criteria
— AIC, AICc, SIC, and AME, RMSE, MAPE — in the estimation period, validation period, and total period.
The Philippines is a fast-urbanizing country. While it brings new jobs, educational opportunities, better living conditions, and
city competitiveness, its challenges such as poverty, congestion, and environmental problems also exist. Additionally, Kuddus et al.
(2020) emphasized the public health problems that could harm people. Scholars have argued that these issues can be addressed if the
government, private sector, and civil society act with urgency and reform current policies related to urbanization.
Understanding urbanization can contribute to urban management to minimize its risks. Existing studies have shown that
forecasting can give an image of what to expect with urbanization in the Philippines. For instance, Beltran & David (2014) forecasted
the land change in Camiguin using the cellular automata model; Tanganco et al. (2019) forecasted the potential areas of urban
expansion in Laguna de Bay Basin using the land transformation model (LTM); and Quintal et al. (2018) used land transformation
model (LTM), geographical information systems (GIS), and artificial neural network (ANN) to forecast the urban expansion in the
seven lakes area in San Pablo City, Laguna. These studies gave the researchers an overview of the topic of urbanization in the
Philippines.
Furthermore, the ARIMA model is one of the most widely used univariate time series analysis for forecasting in different
fields. Abonazel & Abd-Elftah (2019) and Fattah et al. (2018) have used the ARIMA model to forecast GDP and food demand,
respectively. This model has also been used in the field of agriculture as studied by Badmus & Ariyo (2011), and wind speed as seen
in the work of Grigonytė & Butkevičiūtė (2016). These authors have all used the Box-Jenkins Methodology and formulated ARIMA
models, which aided the researchers in the methodology of this study.
2022 EPRA IJMR | www.eprajournals.com | Journal DOI URL: https://doi.org/10.36713/epra2013
134ISSN (Online): 2455-3662
EPRA International Journal of Multidisciplinary Research (IJMR) - Peer Reviewed Journal
Volume: 8| Issue: 7| July 2022|| Journal DOI: 10.36713/epra2013 || SJIF Impact Factor 2022: 8.205 || ISI Value: 1.188
However, urbanization in the Philippines has not been fully explored yet. The mentioned research papers only focused on
investigating the future trends of urban land expansion in some places in the Philippines. These papers also used different forecasting
models such as LTM, GIS, and ANN. Meanwhile, in this study, the researchers concentrated on studying urban population growth in
the country as it also contributes to understanding urbanization. To attain this goal, the researchers used the Box-Jenkins Methodology
to determine the best autoregressive integrated moving average (ARIMA) model for forecasting urban population growth in the
Philippines.
3. BOX-JENKINS METHODOLOGY
The Box-Jenkins methodology was utilized to identify the best ARIMA model suited to the time series data. The selected
ARIMA model was further used to forecast the urban population growth in the Philippines. Figure 3.1 depicts the entire process in
finding the best ARIMA model that best fits the data points.
Figure 3.1
Box-Jenkins Methodology
Figure 3.1 shows how the Box-Jenkins identify the best ARIMA model that was used for forecasting the urban population growth in
the Philippines.
2022 EPRA IJMR | www.eprajournals.com | Journal DOI URL: https://doi.org/10.36713/epra2013
135ISSN (Online): 2455-3662
EPRA International Journal of Multidisciplinary Research (IJMR) - Peer Reviewed Journal
Volume: 8| Issue: 7| July 2022|| Journal DOI: 10.36713/epra2013 || SJIF Impact Factor 2022: 8.205 || ISI Value: 1.188
To begin with, the time-series data is plotted to see whether the given data is stationary or not using the Autocorrelation
Function (ACF) and Partial autocorrelation function (PACF) plots. Additionally, Augmented Dickey-Fuller (ADF) test, Phillips-
Perron (PP) test, and Kwiatkowski, Phillips, Schmidt, and Shin (KPSS) test were used to validate the stationarity of the data. If the
data is non-stationary, it is necessary to undergo differencing – a transformation process for the data to become stationary. After
satisfying the tests for stationarity, the Akaike Information Criteria (AIC), Corrected Akaike Information Criteria (AICc) and Schwarz
Information Criteria (SIC) were used as criteria for finding the optimum ARIMA model. The Invertibility and Ljung Box Test were
then used for diagnostic testing – to check whether the errors are not serially correlated. Finally, after identifying the best ARIMA
model, error measures were used for forecasting evaluation and testing the validity of the final chosen model.
3.1 Data Collection and Procedure
The researchers gathered the data from the World Bank Group – an organization that offers a wide array of financial products
and technical assistance and helps countries in solving challenges through sharing and applying innovative knowledge and solutions.
The said organization has free and open access online secondary data source website – data.worldbank.org (World Bank Open Data).
In this study, the researchers retrieved the annual urban population growth data of the Philippines from 1961 to 2020.
Afterward, the researchers exported the data to computer software – RStudio using the R programming language. Finally, the
overall process of the Box-Jenkins Methodology and forecasting using the best ARIMA model was done, and conclusions were
further made.
4. RESULTS AND DISCUSSION
4.1 Stationarity Test
Figure 4.1
Time Series Data of Urban Population Growth in the Philippines (1961-2020)
The plotted annual time series data of the Urban Population Growth of the Philippines is presented in Figure 4.1. The
percentage growth of the urban population is shown, and the time series comprises 60 observable data points. It can be observed that
2022 EPRA IJMR | www.eprajournals.com | Journal DOI URL: https://doi.org/10.36713/epra2013
136ISSN (Online): 2455-3662
EPRA International Journal of Multidisciplinary Research (IJMR) - Peer Reviewed Journal
Volume: 8| Issue: 7| July 2022|| Journal DOI: 10.36713/epra2013 || SJIF Impact Factor 2022: 8.205 || ISI Value: 1.188
the urban population growth of the country has dramatically slowed during the 1990s. The highest urban population growth is 5.21%
for the year 1982 and starting from 1991, urban population growth significantly slowed until it reached the least urban population
growth of 1.46% during the year of 2009. Furthermore, based on the movement of the time series, which is visibly not linear, the
graph clearly indicates that the entire series is not stationary.
After plotting the time series data, it is necessary to test for the stationarity of the given time series through Partial
Autocorrelation Function (or PACF) and Autocorrelation Function (or ACF) Plots. Figures 4.2.a and 4.2.b presents the PACF and
ACF Plots, and Tables 4.1.a and 4.1.b presents the PACF and ACF values, respectively.
Figure 4.2.a
PACF Plot of Urban Population Growth Time Series
Table 4.1.a
PACF Values of Urban Population Growth Time Series
The test for stationarity is necessary for further investigation of the time series. Figure 4.2.a and Table 4.1.a exhibits
significant lag of order 1 outside of the confidence interval of 0.25. Hence, the PACF plot shows non stationarity for the level time
series.
2022 EPRA IJMR | www.eprajournals.com | Journal DOI URL: https://doi.org/10.36713/epra2013
137ISSN (Online): 2455-3662
EPRA International Journal of Multidisciplinary Research (IJMR) - Peer Reviewed Journal
Volume: 8| Issue: 7| July 2022|| Journal DOI: 10.36713/epra2013 || SJIF Impact Factor 2022: 8.205 || ISI Value: 1.188
Figure 4.2.b
ACF Plot of Urban Population Growth Time Series
Table 4.1.b
ACF Values of Urban Population Growth Time Series
The Autocorrelation Function (ACF) of the above time series is depicted in Figure 4.2.b, which shows large lags outside of
the confidence interval. The lags in ACF are geometric, indicating that the lags are not moving closer towards zero. Additionally, table
4.1.b shows the ACF lag values with many lags greater than the confidence interval of 0.25. Therefore, it is not stationary.
Augmented Dickey-Fuller Test, Philipps-Perron, & Kwiatkowski-Phillips-Shmidt-Shin Tests
To further test the time series’ stationarity, this study utilized three stationarity tests namely, Augmented Dickey-Fuller (or
ADF) Test, Phillips-Perron (or PP) Test and Kwiatkowski-Phillips-Shmidt-Shin (or KPSS) Test. Table 4.2 shows the ADF Test of the
given time series while Table 4.3 shows the PP Test for the same time series. Furthermore, Table 4.4 shows the KPSS test for the time
series.
2022 EPRA IJMR | www.eprajournals.com | Journal DOI URL: https://doi.org/10.36713/epra2013
138ISSN (Online): 2455-3662
EPRA International Journal of Multidisciplinary Research (IJMR) - Peer Reviewed Journal
Volume: 8| Issue: 7| July 2022|| Journal DOI: 10.36713/epra2013 || SJIF Impact Factor 2022: 8.205 || ISI Value: 1.188
Table 4.2
ADF Test for Urban Population Growth Time Series
To statistically test for the stationarity of time series, the Augmented Dickey-Fuller (ADF) Test is used. The test results in a
p-value of 0.1043, higher than the accepted p-value ofISSN (Online): 2455-3662
EPRA International Journal of Multidisciplinary Research (IJMR) - Peer Reviewed Journal
Volume: 8| Issue: 7| July 2022|| Journal DOI: 10.36713/epra2013 || SJIF Impact Factor 2022: 8.205 || ISI Value: 1.188
Table 4.4
KPSS Test for Urban Population Growth Time Series
The Kwiatkowski-Phillips-Schmidt-Shin (KPSS) Test is a statistical test that, unlike the previous two tests, examines the time
series for non-stationarity. The KPSS test resulted to a p-value of 0.01 which is falls on the accepted p-value ofISSN (Online): 2455-3662
EPRA International Journal of Multidisciplinary Research (IJMR) - Peer Reviewed Journal
Volume: 8| Issue: 7| July 2022|| Journal DOI: 10.36713/epra2013 || SJIF Impact Factor 2022: 8.205 || ISI Value: 1.188
Since the data was found to be non-stationary, the time series will be transformed using differencing, as seen in Figure 4.3. In
comparison to the level time series, the differenced time series appears to be more linear and smoothened. It is feasible that the
differenced time series have become stationary.
ACF and PACF Plots
After plotting the time series, it is essential to find the ACF and PACF Plots of the because aside from indicating the time
series’ stationarity, they also influence the (p) and (q) models in the ARIMA process with (p,d,q) as its the model. Figures 4.4.a and
4.4.b displays the PACF and ACF Plots of the differenced time series, respectively. Furthermore, Table 4.5.a and Table 4.5.b listed lag
values of PACF and ACF to support the aforementioned plots. Furthermore, Table 4.5.a and Table 4.5.b listed lag values of PACF and
ACF to support the aforementioned plots.
Figure 4.4.a
PACF Plot of Differenced Urban Population Growth Time Series
Table 4.5.a
PACF Values of Differenced Urban Population Growth Time Series
The PACF plot displays significant lags in orders 10 and 20. It can be observed from the graph that most lags fall within the
confidence interval. Table 4.5.a also specified the PACF values for lag order 10 and 20 which are -0.275 and -0.439, the only 2 lags
2022 EPRA IJMR | www.eprajournals.com | Journal DOI URL: https://doi.org/10.36713/epra2013
141ISSN (Online): 2455-3662
EPRA International Journal of Multidisciplinary Research (IJMR) - Peer Reviewed Journal
Volume: 8| Issue: 7| July 2022|| Journal DOI: 10.36713/epra2013 || SJIF Impact Factor 2022: 8.205 || ISI Value: 1.188
with values beyond the confidence interval of positive or negative 0.25. Hence, based on the PACF plot, the differenced time series is
stationary.
Figure 4.4.b
ACF Plot of Differenced Urban Population Growth Time Series
Table 4.5.b
ACF Values of Differenced Urban Population Growth Time Series
With significant lags in order 10 and order 20, the ACF plot from Figure 4.4.b is now within the confidence interval. The
ACF values of lag orders 10 and 20 are -0.258 and -0.369 according to table 4.5.b. The differenced time series is presumed to be
stationary because majority of the lags presented on the ACF and PACF graphs are within the confidence interval.
Test for Stationarity (Augmented Dickey-Fuller Test, Philipps-Perron, & Kwiatkowski-Phillips-Shmidt-Shin Tests)
To further test for the stationarity of the differenced time series, the 3 stationarity tests will be used. It is ideal to use different
tests for stationarity to cover areas of inconsistency of every stationarity test. Table 4.6 shows result of the ADF Test, Table 4.7 for
the PP Test and lastly, Table 4.8 for the KPSS Test.
2022 EPRA IJMR | www.eprajournals.com | Journal DOI URL: https://doi.org/10.36713/epra2013
142ISSN (Online): 2455-3662
EPRA International Journal of Multidisciplinary Research (IJMR) - Peer Reviewed Journal
Volume: 8| Issue: 7| July 2022|| Journal DOI: 10.36713/epra2013 || SJIF Impact Factor 2022: 8.205 || ISI Value: 1.188
Test for Stationarity (Augmented Dickey-Fuller Test)
Table 4.6
ADF Test for Differenced Urban Population Growth Time Series
The Augmented Dickey-Fuller (ADF) Test was used to further establish the stationarity of the differenced time series, and
the result of p-value=0.00007674 (ISSN (Online): 2455-3662
EPRA International Journal of Multidisciplinary Research (IJMR) - Peer Reviewed Journal
Volume: 8| Issue: 7| July 2022|| Journal DOI: 10.36713/epra2013 || SJIF Impact Factor 2022: 8.205 || ISI Value: 1.188
Test for Stationarity (Kwiatkowski-Phillips-Schmidt-Shin)
Table 4.8
KPSS Test for Differenced Urban Population Growth Time Series
Another useful technique for confirming the stationarity of differenced time series is the Kwiatkowski-Phillips-Schmidt-Shin
(KPSS) Test. It evaluates the alternative hypothesis of the presented non-stationarity of the time series. With the test yielding a p-value
of 0.1(>0.05), the null hypothesis of the test is accepted, implying that the time series is stationary.
4.3 Identifying Best Arima Model Using AIC, AICc, & BIC
During the ARIMA process, the ARIMA model consists of (p,d,q) models where p is the AR process, d is the differencing
process, and q as the MA process. With the PACF plots significant lag orders of 10 and 20 will be used for the AR process or (p)
model; and similarly, lag orders of 10 and 20 from the ACF plots for the MA process or (q) model. For the Integrated process or (d)
model, 1 will be used for the time series was differenced once.
From the PACF and ACF Plots, there will be the following ARIMA models: ARIMA (10,1,10), ARIMA (10,1,20), ARIMA
(20,1,10) and ARIMA (20,1,20). After undergoing the ARIMA process using the following (p, d, q) values, the next step is to identify
the best ARIMA model using three selection criteria (AIC, AICc, & BIC). Table 4.9 shows the summary of scores for each selection
criterion for every ARIMA model.
Table 4.9
Scores for Each Selection Criterion for Each ARIMA Model (AIC, AICc, & BIC)
CRITERIA ARIMA ARIMA ARIMA ARIMA
(10,1,10) (10,1,20) (20,1,10) (20,1,20)
SIGMA SQUARED 0.06867 0.03843 0.008806 0.003327*
LOG -11.25 -6.15 13.49 21.7*
LIKELIHOOD
AIC 64.5 74.3 35.02* 38.61
AICc 98.73* 191 151.72 530.61
BIC 104.2322 132.9439 93.66381* 116.1745
*smallest in each row
The selection criteria used by the researchers in identifying the best ARIMA model are Akaike Information Criterion (AIC),
Corrected Akaike Information Criterion (AICc), and Bayesian Information Criterion (BIC) or Schwarz Information Criteria (SIC).
Among the three selection criteria, the AIC criterion best indicates the closeness of fitting of the model with the given time series. The
other two criteria were likewise good indicators of the tentative closeness of the ARIMA models to the time series data. Table 4.9
displays data for the selected ARIMA models in the time series using the provided selection criteria. The model ARIMA (20,1,10)
has the lowest AIC and BIC selection criteria, with scores 35.02 and 93.66381, respectively. Hence, ARIMA (20,1,10) is the best
model to be validated on the next ARIMA processes.
4.3 Diagnostic Test (Invertibility - ARMA Structure)
It is significant to check for the invertibility of our best ARIMA model since a characteristic of a good ARIMA model is that
it is invertible. Invertibility is a stationary condition that must be enforced to have a unique model for any autocorrelation structure.
Another characteristic of a good ARIMA model is that it has independent residuals, that’s why the Ljung Box Test was used to check
2022 EPRA IJMR | www.eprajournals.com | Journal DOI URL: https://doi.org/10.36713/epra2013
144ISSN (Online): 2455-3662
EPRA International Journal of Multidisciplinary Research (IJMR) - Peer Reviewed Journal
Volume: 8| Issue: 7| July 2022|| Journal DOI: 10.36713/epra2013 || SJIF Impact Factor 2022: 8.205 || ISI Value: 1.188
for the independence of ARIMA (20,1,10)’s residuals and to check if there is no lack of fit. Figure 4.5 displays the invers ARMA
roots of ARIMA (20,1,10) while Table 4.10 provides the Ljung Box Test for the residuals of ARIMA (20,1,10).
Figure 4.5
Inverse Roots for ARMA Structure
One characteristic of a good ARIMA model is its invertibility. The researchers examine ARMA Structure of ARIMA
(20,1,10), and it can be deduced from the Figure 4.5 that the inverse AR and inverse MA roots are contained within the circle,
showing that ARIMA (20,1,10) is invertible.
Diagnostic Test (Independence of Residuals - Llung Box Test)
Table 4.10
Ljung Box Test for the Residuals of ARIMA (20, 1, 10)
To check if the residuals of ARIMA (20,1,10) are independent, the Llung Box Test was conducted on its residuals. It can be
accepted that there is no lack of fit for the residuals of ARIMA (20,1,10) and that they are independent from one another because its p-
value = 0.7975 shows significance beyond the p-value of 0.05.
4.4 Forecasting Evaluation (Test Forecasting Using Training and Test Data)
After diagnostic checking of our best ARIMA model which is ARIMA (20,1,10), a test forecast will be held by dividing the
original time series between the training data set and testing data set. 50 data observations will be used as training set and 10 data
observations as testing set. Table 4.11 and Figure 4.6 provides data for the test forecast of the urban population growth time series.
2022 EPRA IJMR | www.eprajournals.com | Journal DOI URL: https://doi.org/10.36713/epra2013
145ISSN (Online): 2455-3662
EPRA International Journal of Multidisciplinary Research (IJMR) - Peer Reviewed Journal
Volume: 8| Issue: 7| July 2022|| Journal DOI: 10.36713/epra2013 || SJIF Impact Factor 2022: 8.205 || ISI Value: 1.188
Table 4.11
Test Forecast of Urban Population Growth Time Series
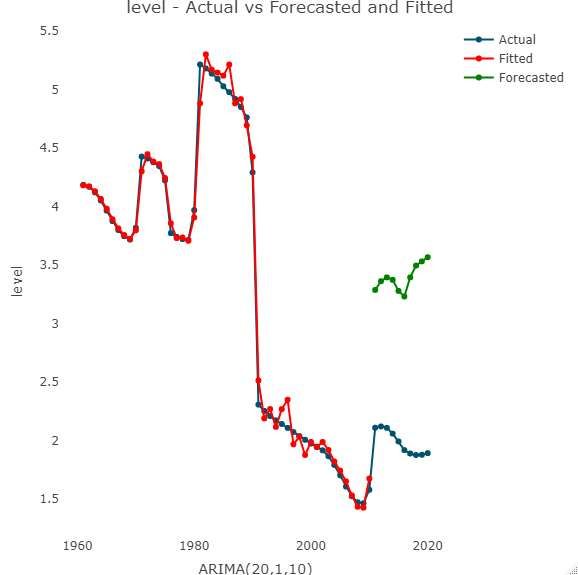
Figure 4.6
Test Forecast of Urban Population Growth Time Series
Figure 4.6 shows the test forecasted data from 2010 to 2020 in comparison to the actual data with the same time period, using
the model ARIMA (20,1,10). Starting in 2011, according to Table 4.11, the forecasted urban population growth is 3.29 percent, rising
to 3.57 percent by the end of the forecasting period in 2020.
Forecasting Evaluation (Error Measures)
Table 4.12 shows the error measures for test forecasting using ARIMA (20,1,10). Mean Absolute Percentage Error (MAPE)
and Root Mean Square Error (RMSE) were used as error measures to validate and check for the accuracy of the chosen best ARIMA
model.
2022 EPRA IJMR | www.eprajournals.com | Journal DOI URL: https://doi.org/10.36713/epra2013
146ISSN (Online): 2455-3662
EPRA International Journal of Multidisciplinary Research (IJMR) - Peer Reviewed Journal
Volume: 8| Issue: 7| July 2022|| Journal DOI: 10.36713/epra2013 || SJIF Impact Factor 2022: 8.205 || ISI Value: 1.188
Table 4.12
Error Measures for Test Forecast of Urban Population Growth Time Series
From the test forecast using the partitioned time series between training set and test set, the error measure considered for this
research is the Mean Absolute Percentage Error (MAPE). The MAPE of forecasted ARIMA (20,1,10) is 2.16% which is less than the
accepted confidence level for MAPE which is 15%.
Another Error Measure Considered in this study is the Root Mean Square Error (RMSE) of the test forecast using the model
ARIMA (20,1,10). The RMSE of ARIMA (20,1,10) is 0.09290073, a value which is close to zero, indicating a good fit of the ARIMA
model to the actual time series.
After checking with the two error measures of ARIMA (20,1,10), it is concluded that the model is valid and ARIMA
(20,1,10) is the optimum ARIMA model for forecasting urban population growth in the Philippines.
Sample Forecast
Utilizing the Box-Jenkins Methodology in this study was the best forecasting methodology for the time series data for the
given time series data is univariate, there is enough observable data necessitated by the methodology, and that the researchers aim to
forecast short term periods. Figures 4.7 to 4.10 and Tables 4.13 to 4.16 presents the sample forecast of urban population growth in the
Philippines from the year 2011 until the year 2028.
Figure 4.7
Sample Forecast of Urban Population Growth for 2 Years (2021-2022)
2022 EPRA IJMR | www.eprajournals.com | Journal DOI URL: https://doi.org/10.36713/epra2013
147ISSN (Online): 2455-3662
EPRA International Journal of Multidisciplinary Research (IJMR) - Peer Reviewed Journal
Volume: 8| Issue: 7| July 2022|| Journal DOI: 10.36713/epra2013 || SJIF Impact Factor 2022: 8.205 || ISI Value: 1.188
Table 4.13
Test Forecast of Urban Population Growth Time Series
Figures 4.7 and Table 4.13 show the sample forecast using ARIMA (20,1,10) for the year 2021 and 2022. The Philippine
urban population growth forecast for 2021 is 2% while it declined to 1.95% for 2022. Figure 4.7 and table 4.11 show that growth will
be modest in 2021 and 2022.
Figure 4.8
Sample Forecast of Urban Population Growth for 4 Years (2021-2024)
2022 EPRA IJMR | www.eprajournals.com | Journal DOI URL: https://doi.org/10.36713/epra2013
148ISSN (Online): 2455-3662
EPRA International Journal of Multidisciplinary Research (IJMR) - Peer Reviewed Journal
Volume: 8| Issue: 7| July 2022|| Journal DOI: 10.36713/epra2013 || SJIF Impact Factor 2022: 8.205 || ISI Value: 1.188
Table 4.14
Sample Forecast of Urban Population Growth for 4 Years (2021-2024)
Using the optimal ARIMA model ARIMA (20,1,10), Figure 4.8 and Table 4.14 present the out of sample forecast from 2021
up to 2024. From 2021 to 2022, the urban population growth of the Philippines is forecasted to decrease with 2% and 1.95%
respectively, before picking up again from 2023 to 2024 with forecasted values of 1.98% and 2.08% respectively.
Figure 4.9
Sample Forecast of Urban Population Growth for 6 Years (2021-2026)
2022 EPRA IJMR | www.eprajournals.com | Journal DOI URL: https://doi.org/10.36713/epra2013
149ISSN (Online): 2455-3662
EPRA International Journal of Multidisciplinary Research (IJMR) - Peer Reviewed Journal
Volume: 8| Issue: 7| July 2022|| Journal DOI: 10.36713/epra2013 || SJIF Impact Factor 2022: 8.205 || ISI Value: 1.188
Table 4.15
Sample Forecast of Urban Population Growth for 6 Years (2021-2026)
Figure 4.9 show the out-of-sample forecast for the years 2021 through 2026.It can be observed that there is an uptrend for the
forecasted urban population growth for years 2021-2026 Furthermore, Table 4.15 listed the forecasted urban population growth in the
Philippines which slowed from 2021 (2%) to 2022 (1.95%), but then sped up again from 2023 to 2026 (1.98% to 2.19%).
Figure 4.10
Sample Forecast of Urban Population Growth for 8 Years (2021-2028)
2022 EPRA IJMR | www.eprajournals.com | Journal DOI URL: https://doi.org/10.36713/epra2013
150ISSN (Online): 2455-3662
EPRA International Journal of Multidisciplinary Research (IJMR) - Peer Reviewed Journal
Volume: 8| Issue: 7| July 2022|| Journal DOI: 10.36713/epra2013 || SJIF Impact Factor 2022: 8.205 || ISI Value: 1.188
Table 4.16
Sample Forecast of Urban Population Growth for 8 Years (2021-2028)
The out-of-sample forecast presented by Figure 4.10 and Table 4.16 using ARIMA (20,1,10) as the best model suggests a
slight slowdown in urban population growth in the Philippines from 2021-2022, but it could rise to 2.36 percent by 2028. In general,
the out of sample forecast using the optimal model of ARIMA (20,1,10) yields to the potential increase in urban population growth in
the Philippines in the next few years.
Forecasting Evaluation (Error Measures)
Table 4.17 summarizes the error measures for all sample forecasts for 2 years, 4 years, 6 years, and 8 years. MAPE and
RMSE were the error measures used as well for the sample forecasts.
Table 4.17
Error Measures for Sample Forecast or Urban Population Growth Time Series
The error measures for every out-of-sample forecast using the same optimal ARIMA model are all similar. Table 4.17
enumerated the Mean Absolute Percentage Error (MAPE) for the out of sample forecast using ARIMA (20,1,10) which is 3.71
percent. Additionally, its Root Mean Square Error is 0.18877. Since the MAPE of ARIMA (20,1,10) is 3.71% which falls on the
accepted MAPE of 15% and its RMSE is 0.18877 which is near the value of zero, strongly supports the validity of the optimum
model, ARIMA (20,1,10).
CONCLUSION
The study has shown that the best ARIMA model for forecasting urban population growth in the Philippines is ARIMA (20,
1, 10). Using this model, the forecasted urban population growth in the Philippines would be 1.95 % by 2022, 2.08% by 2024, 2.19%
by 2026, and 2.36% by 2028. The chosen best ARIMA model has a Mean Absolute Percentage Error (MAPE) of 3.71% and a Root
Mean Square Error (RMSE) of 0.18877 – which validates the accuracy of the model.
Wealthier countries generally have higher urban populations; this could mean that the Philippines may expect an improved
economy in the next 6 years. However, this could also imply that the challenges of urbanization – health problems, environmental
problems, congestion, and poverty – may get worse in the next few years.
In conclusion, the potential rise of urban population growth in the Philippines calls for a better and strengthened urban
management and development programs. Along with this, the risks of urbanization may be prevented and minimized if the national
government and local government units provide livable opportunities and equal social services for all Filipinos living in both rural and
urban places. It follows that this would impede the urban population growth in the country since those who originally reside in rural
areas will not be forced to move in cities anymore to search for an improved quality of life.
BIBLIOGRAPHY
JOURNALS
1. Abonazel, M. R., & Abd-Elftah, A. I. (2019). Forecasting Egyptian GDP using ARIMA models. Reports on Economics and Finance, 5(1),
35–47.https://doi.org/10.12988/ref.2019.81023
2022 EPRA IJMR | www.eprajournals.com | Journal DOI URL: https://doi.org/10.36713/epra2013
151ISSN (Online): 2455-3662
EPRA International Journal of Multidisciplinary Research (IJMR) - Peer Reviewed Journal
Volume: 8| Issue: 7| July 2022|| Journal DOI: 10.36713/epra2013 || SJIF Impact Factor 2022: 8.205 || ISI Value: 1.188
2. Badmus, M., & Ariyo, O. (2011). Forecasting Cultivation Area and Production of Maize in Nigeria Using ARIMA model. Asia
JournalofAgriculturalScience,3(3).https://www.researchgate.net/profile/OludareAriyo/publication/263397641_Forecasting_Cultivation_A
rea_and_Production_of_Maize_in_Nigeria_Using_ARIMA_model/links/0a85e53abe3547415a000000/Forecasting-Cultivation-Area-and-
Production-of-Maize-in-Nigeria-Using-ARIMA-model.pdf
3. Beltran, M. I., & David, G. (2004). Cellular Automata Model of Urbanization in Camiguin, Philippines. Information and Communication
Technology-EurAsia Conference,29–35. https://link.springer.com/content/pdf/10.1007/978-3-642-55032-4_3.pdf
Cheung, Y.-W., & Lai, K. (n.d.). Lag Order and Critical Values of the Augmented Dickey-Fuller Test [Review of Lag Order and
Critical Values of the Augmented Dickey-Fuller Test]. Journal of Business & Economic Statistics, 13(3).
https://people.ucsc.edu/~cheung/pubs/with_Lai/LagOrderAugDickey_Fuller.pdf
4. Fattah, J., Ezzine, L., Aman, Z., el Moussami, H., & Lachhab, A. (2018). Forecasting of demand using ARIMA model. International
Journal of Engineering Business Management, 10. https://doi.org/10.1177/1847979018808673
5. Grigonytė, E., & Butkevičiūtė, E. (2016). Short-term wind speed forecasting using ARIMA model. Energetika, 62(1–2).
https://doi.org/10.6001/energetika.v62i1-2.3313
6. Jiban, C., Paul, Shahidul, H., Mohammad, M., Rahman, Hoque, S., Mohammad, & Rahman, M. (2013). Global Journal of
Management and Business Research Finance Selection of Best ARIMA Model for Forecasting Average Daily Share Price Index of
Pharmaceutical Companies in Bangladesh: A Case Study on Square Pharmaceutical Ltd. Selection of Best ARIMA Model for
Forecasting Average Daily Share Price Index of Pharmaceutical Companies in BangladeshA Case Study on Square Pharmaceutical
Ltd. Selection of Best ARIMA Model for Forecasting Average Daily Share Price Index of Pharmaceutical Companies in Bangladesh:
A Case Study on Square Pharmaceutical Ltd. https://globaljournals.org/GJMBR_Volume13/3-Selection-of-Best-ARIMA-Model.pdf
7. Kuddus, M. A., Tynan, E., & McBryde, E. (2020). Urbanization: a problem for the rich and the poor? Public Health Reviews, 41(1).
https://doi.org/10.1186/s40985-019-0116-0
8. Mojares, J. (2013). Urbanization and Its Effect in the CALABARZON area, Philippines.Journal of Global Intelligence and Policy, 6(10),
24–40.https://www.researchgate.net/publication/341055495_Urbanization_Its_Effect_in_CALABARZON
9. Quintal, A. L., Gotangco, C. K., & Guzman, M. A. L. (2018). Forecasting Urban Expansion in the Seven Lakes Area in San Pablo City,
Laguna, the Philippines Using the Land Transformation Model. Environment and Urbanization ASIA, 9(1), 69–85.
https://doi.org/10.1177/0975425317748531
10. Tanganco, L. J. U., Alberto, M. A. J., & Gotangco, C. K. Z. (2019). Forecast of Potential Areas of Urban Expansion in the Laguna de Bay
Basin and Its Implications to Water Supply Security. Philippine Journal of Science, 148(4), 715–724.
https://philjournalsci.dost.gov.ph/images/pdf/pjs_pdf/vol148no4/forecast_of_potential_areas_of_urban_expansion_in_laguna_de_bay_bas
in_.pdf
WEBSITES
1. 2U, Inc. (2021, May 13). What Is ARIMA Modeling? Master’s in Data Science.https://www.mastersindatascience.org/learning/what-is-
arima-modeling/Autocorrelation and Partial Autocorrelation in Time Series Data. (2021, May 17). Statistics by Jim.
https://statisticsbyjim.com/timeseries/autocorrelation-partial-autocorrelation/
2. Adeleye, N. (2018, June 29). Basics of ARMA and ARIMA Modeling [Video]. YouTube.https://www.youtube.com/watch?v=_T1zrUsiCss
3. Baker, J., & Watanabe, M. (2017, September 20). Unlocking the Philippines’urbanization potential. World Bank Blogs. Retrieved June 6,
2022, fromhttps://blogs.worldbank.org/eastasiapacific/unlocking-the-philippines-urbanization-potential
4. Boechler, E., Campbell, A., Hanania, J., Stenhouse, K., Suarez, L., & Donev, J. (2021).Urban population - Energy Education. Energy
Education. Retrieved June 6,2022, from https://energyeducation.ca/encyclopedia/Urban_populationBox-Jenkins Model Definition. (2021,
June 29). Investopedia. https://www.investopedia.com/terms/b/box-jenkins-model.asp
5. Drane, M. (n.d.). Forecasting – Introduction to Operations Management. Pressbooks. Retrieved June 6, 2022, from
https://pressbooks.senecacollege.ca/operationsmanagement/chapter/forecasting/
6. Hayes, A. (2021, April 24). Understanding Time Series. Investopedia.https://www.investopedia.com/terms/t/timeseries.asp
7. Hayes, A. (2021, October 12). Autoregressive Integrated Moving Average (ARIMA).Investopedia. Retrieved June 6, 2022, from
https://www.investopedia.com/terms/a/autoregressive-integrated-moving-average-arima.asp
8. Kukreja, R. (2020, June 15). Causes, Effects and Solutions to Urbanization Leading toUrban Growth. Conserve Energy Future. Retrieved
June 6, 2022, fromhttps://www.conserve-energy-future.com/causes-effects-solutions-urbanization.php
9. Philippine Statistics Authority. (2019, March). Urban Population in the Philippines (Results of the 2015 Census of Population) (No. 2019–
040). https://psa.gov.ph/content/urban-population-philippines-results-2015-census-population
10. Philippine Statistics Authority. (2003a). Adoption of the Operational Definition of Urban Areas in the Philippines (NSCB Resolution No.
9). https://psa.gov.ph/article/adoption-operational-definition-urban-areas-philippines
11. Ritchie, H., & Roser, M. (2018, June 13). Urbanization. Our World in Data. Retrieved June 6, 2022, from
https://ourworldindata.org/urbanization
12. Sangarshanan. (2019, April 7). Time series Forecasting — ARIMA models - Towards Data Science. Medium.
https://towardsdatascience.com/time-series-forecasting-arima-models-7f221e9eee06
13. Syczewska, E. (n.d.). Empirical power of the Kwiatkowski-Phillips-Schmidt-Shin test [Review of Empirical power of the
Kwiatkowski-Phillips-Schmidt-Shin test].
https://sslkolegia.sgh.waw.pl/pl/KAE/struktura/IE/struktura/ZES/Documents/Working_Papers/aewp03-10.pdf
2022 EPRA IJMR | www.eprajournals.com | Journal DOI URL: https://doi.org/10.36713/epra2013
152ISSN (Online): 2455-3662
EPRA International Journal of Multidisciplinary Research (IJMR) - Peer Reviewed Journal
Volume: 8| Issue: 7| July 2022|| Journal DOI: 10.36713/epra2013 || SJIF Impact Factor 2022: 8.205 || ISI Value: 1.188
14. United Nations. (2018). World Urbanization Prospects - Population Division - United Nations. United Nations Department of Economic
and Social Affairs. Retrieved June 6, 2022, from https://population.un.org/wup/
What is Urban Growth or Urbanization? | Characteristics & Examples. (2020, September 15). Planning Tank. Retrieved June 6, 2022,
from https://planningtank.com/urbanisation/urbanisation-urban-growth
15. World Bank Group. (2020, April 20). Urban Development Overview: Development news, research, data | World Bank. Retrieved June 6,
2022, from https://www.worldbank.org/en/topic/urbandevelopment/overview#1
16. World Bank Group. (2017). PHILIPPINES URBANIZATION REVIEW FOSTERING COMPETITIVE, SUSTAINABLE, AND INCLUSIVE
CITIES. https:// documents1.worldbank.org/curated/en/963061495807736752/pdf/114088-REVISED-PUBLIC-Philippines-Urbanization-
Review-Full-Report.pdf
2022 EPRA IJMR | www.eprajournals.com | Journal DOI URL: https://doi.org/10.36713/epra2013
153You can also read