FY21 Q4 Earnings Presentation - July 13, 2021 - Conagra Brands
←
→
Page content transcription
If your browser does not render page correctly, please read the page content below

FY21 Q4 Earnings Presentation
          July 13, 2021
                                1
Today’s Presenters

  Brian Kearney
  Investor Relations

  Sean Connolly
  President and Chief Executive Officer

  Dave Marberger
  Executive Vice President and Chief Financial Officer

                                                         2
Legal Disclosure

Note on Forward-looking Statements
This document contains forward-looking statements within the meaning of the federal securities laws. These forward-looking statements are based on
management's current expectations and are subject to uncertainty and changes in circumstances. Readers of this document should understand that
these statements are not guarantees of performance or results. Many factors could affect our actual financial results and cause them to vary materially
from the expectations contained in the forward-looking statements, including those set forth in this document. These risks, uncertainties, and factors
include, among other things: the risk that the cost savings and any other synergies from the acquisition of Pinnacle Foods Inc. (the Pinnacle acquisition)
may not be fully realized or may take longer to realize than expected; the risk that the Pinnacle acquisition may not be accretive within the expected
timeframe or to the extent anticipated; the risks that the Pinnacle acquisition and related integration will create disruption to the Company and its
management and impede the achievement of business plans; risks related to our ability to achieve the intended benefits of other recent acquisitions and
divestitures; risks associated with general economic and industry conditions; risks associated with our ability to successfully execute our long-term
value creation strategies; risks related to our ability to deleverage on currently anticipated timelines, and to continue to access capital on acceptable
terms or at all; risks related to our ability to execute operating and restructuring plans and achieve targeted operating efficiencies from cost-saving
initiatives, and to benefit from trade optimization programs; risks related to the effectiveness of our hedging activities and ability to respond to volatility in
commodities; risks related to the Company's competitive environment and related market conditions; risks related to our ability to respond to changing
consumer preferences and the success of our innovation and marketing investments; risks related to the ultimate impact of any product recalls and
litigation, including litigation related to the lead paint and pigment matters, as well as any securities litigation, including securities class action lawsuits;
risk associated with actions of governments and regulatory bodies that affect our businesses, including the ultimate impact of new or revised regulations
or interpretations; risks related to the impact of the coronavirus (COVID-19) pandemic on our business, suppliers, consumers, customers and
employees; risks related to our forecasts of consumer eat-at-home habits as the impacts of the COVID-19 pandemic abate; risks related to the
availability and prices of supply chain resources, including raw materials, packaging, and transportation, including any negative effects caused by
changes in inflation rates, weather conditions or health pandemics; disruptions or inefficiencies in our supply chain and/or operations, including from the
COVID-19 pandemic; risks associated with actions by our customers, including changes in distribution and purchasing terms; risks and uncertainties
associated with intangible assets, including any future goodwill or intangible assets impairment charges; risks related to a material failure in or breach of
our or our vendors’ information technology systems; the amount and timing of future dividends, which remain subject to Board approval and depend on
the market and other conditions; and other risks described in our reports filed from time to time with the Securities and Exchange Commission. We
caution readers not to place undue reliance on any forward-looking statements included in this document, which speak only as of the date of this
document. We undertake no responsibility to update these statements, except as required by law.

Note on Non-GAAP Financial Measures
This document includes certain non-GAAP financial measures, including adjusted EPS, organic net sales, adjusted gross profit, adjusted operating
profit, adjusted SG&A, adjusted corporate expenses, adjusted gross margin, adjusted operating margin, adjusted effective tax rate, adjusted net income
attributable to Conagra Brands, free cash flow, net debt, net leverage ratio, and adjusted EBITDA. Management considers GAAP financial measures as
well as such non-GAAP financial information in its evaluation of the Company’s financial statements and believes these non-GAAP measures provide
useful supplemental information to assess the Company’s operating performance and financial position. These measures should be viewed in addition
to, and not in lieu of, the Company’s diluted earnings per share, operating performance and financial measures as calculated in accordance with GAAP.                3

Sean Connolly
President and Chief Executive Officer
                                        4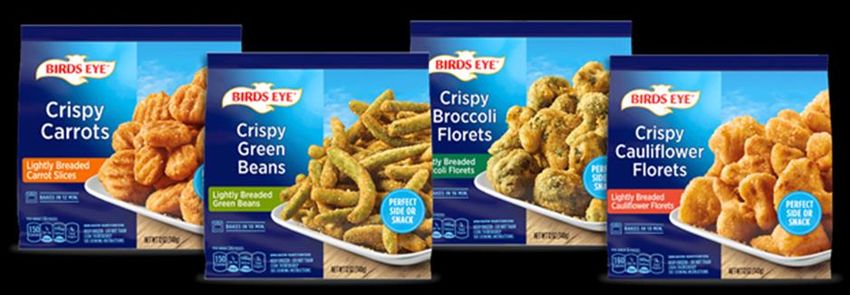
Key Messages

• The Conagra Way playbook and our people facilitated a successful fiscal 2021

• We experienced unprecedented levels of consumer acquisition and repeat purchases
  across the portfolio

• Our modernized and premiumized portfolio is well-positioned to navigate the current
  inflationary environment
     • Aggressive and comprehensive action plan to mitigate inflation fully underway
     • Maintaining investments for long-term brand health

• Revising FY22 adjusted EPS guidance to reflect inflation since Q3
     • Lag in the timing of P&L benefits from pricing and other actions versus timing of inflation
     • Lag effect expected to be the most acute in Q1
     • Expect H2 adjusted EPS to be in-line with what was assumed for H2 within our prior guidance

• We have increased our annual divided by 14%, reflecting confidence in our business
  strength

• We will host an investor meeting in Spring 2022                                                    5
Agenda

         Business Update

         Looking Ahead

                           6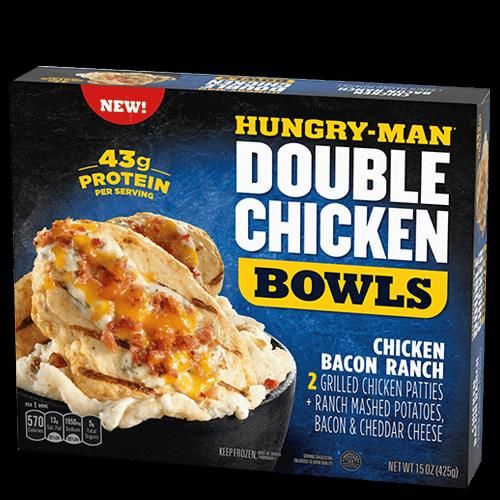
Ended Fiscal 2021 With a Strong Q4

                                                                                                                               Q4 2-Year
                                                                     Q4 Guidance                           Q4                                                FY21 vs YA
                                                                                                                                CAGR3

                Organic Net Sales1 Growth                            (10)% to (12)%                    (10.1)%                     +4.5%                           +5.1%

                Adj. Op. Margin2                                        14% to 15%                       14.0%                        n/a                        +101 bps

                Adj. EPS                                              $0.49 to $0.55                     $0.54                    +22.5%                          +15.8%

Note: “Adjusted” financial measures, and organic net sales are non-GAAP. See the end of this presentation for a reconciliation of these measures to the most directly comparable GAAP
measures.
1. Organic net sales excludes the impact of foreign exchange and divested businesses, as well as acquisitions (until the anniversary date of the acquisitions). Organic net sales growth excludes
    the impact of fiscal 2020’s 53rd week, which was calculated as one-sixth of our last month’s net sales (which included a total of six weeks).
2. Adjusted operating margin excludes equity method investment earnings and pension and postretirement non-service expense (income).
3. CAGR calculated as ([(1 + current year period’s growth rate) * (1 + prior year period’s growth rate)] ^ 0.5) - 1.                                                                                7
Continued to Execute Conagra Playbook in FY21

                    3                               Saliency
                  Mental                           Relevancy
                Availability

                    2                           Brick & Mortar
                                                  eCommerce
            Physical Availability

                    1                              Perpetual
           Superior Products                    Modernization

                                                                 8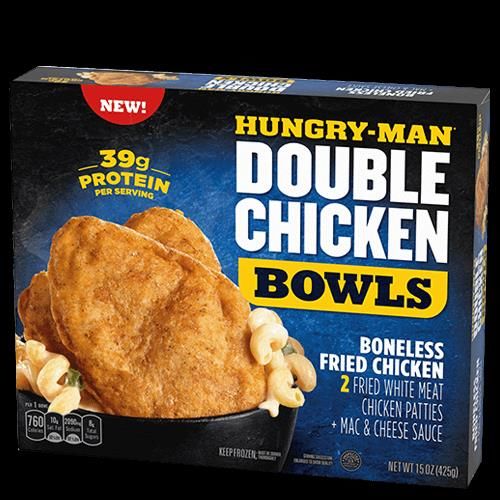
Executional Excellence Enabled our Exceptional Results

                                                         9
Significant Consumer Acquisition and Retention in
         Fiscal 2021

              FY21 Wtd. Household Penetration                                                                 FY21 Wtd. Repeat Rate
             (Pt Change vs. 52 Weeks Pre-COVID)                                                         (Pt Change vs. 52 Weeks Pre-COVID)

           Avg. of                                                                                         Avg. of
           Top 15                     +0.4 pts                                                             Top 15                            +1.2 pts
           Peers                                                                                           Peers

      Total CAG                                  +0.7 pts                                             Total CAG                                   +1.5 pts

           Frozen                        +0.5 pts                                                          Frozen                                   +1.6 pts

                                                      +0.6 pts
          Snacks                                                     +1.3 pts                             Snacks                                               +2.2 pts

          Staples                                                +1.2 pts                                 Staples                            +1.2 pts

               Total Conagra Weighted Share +20 bps in FY21 vs. FY20 and +50 bps vs. FY19
Source (Top Charts): IRI Household Panel, Total US All Outlets, Conagra Custom Categories, 52 Weeks Ended May 16, 2021 vs. 52 Weeks Ended February 23, 2020; Average of Top 15 Peers
Wtd. Penetration and Wtd. Repeat Rate                                                                                                                                                  10
Source (Bottom bar): IRI Custom Market Advantage, Total US MULO+C, FY2021 (52 Weeks Ended May 30, 2021)
We Delivered Another Year of Robust Innovation
Performance in FY21
Avg. Retail Sales per UPC Avg. TPDs per UPC
(FY21 vs. FY20) (FY21 vs. FY20)
+40%
+36%
+24%
+17%
Conagra Top 15 Peers Innovation Conagra Top 15 Peers Innovation
Within our Categories Within our Categories
Source (Conagra columns): IRI Custom Database. MULO+C. Conagra Fiscal Years, Custom Innovation Aggregates.
Top 15 Peers is an aggregate of top manufacturers, excluding Private Label. Innovation within categories we compete in only. Innovation = Dollar Sales Current>0, Dollar Sales Year Ago = 0. 11FY21 Innovation Resonated with Consumers
12New Birds Eye Breaded Vegetables Hit the Market
with Robust Advertising Support
13Conagra eCommerce Continued to Outpace the
Industry, Now Nearly 8% of Retail Sales
Conagra vs. Total Edible Conagra e-Commerce
eCommerce Retail Sales as a % of Total of Retail Sales
(% Change vs. 2YA) (Rolling 13 Weeks)
7.8%
+239%
+211% +207%
+189% 6.3%
+165% +165%
+159%
+136%
3.3%
Q1 FY21 Q2 FY21 Q3 FY21 Q4 FY21
CAG Q4 FY19 CAG Q4 FY20 CAG Q4 FY21
Conagra Total Edible
Note: only ~84% of Conagra eCommerce brand sales measured; Latest weeks subject to change due to data stability.
Source (Left): Source: IRI eMarket Insights, Total Conagra vs. Total Edible xBeverage xProducts Where Parent Company Is Unknown, Total eCommerce RMA; Data ended May 30, 2021.
Source (Right): IRI eMarket Insights data ended May 30, 2021. Total Edible X Beverage. Note: Latest weeks subject to change due to data stability; 14Strong, Broad-Based Two-Year Growth Rates in Q4
Q4 Retail Sales
(% Change vs. 2YA)
+21.0%
+13.5%
+11.7%
+5.2%
Conagra Frozen Snacks Staples
Source: IRI Syndicated Market Advantage, Total US MULO+C, 13 Weeks Ended May 30, 2021, Conagra Brands = Total Edible
15Frozen Growth Accelerated on a Two-Year Basis
Conagra Frozen Retail Sales
(% Change vs. YA) Conagra Frozen
Retail Sales
%Chg vs YA 2-Year Growth
(Q4, % Change vs. 2YA)
Desserts
+13.0% +12.2%
+26.4%
+13.2% +13.5%
+11.8%
+8.8%
Single Serve Meals
+8.3%
+19.3%
Multi-Serve Meals
+14.8%
Vegetables
+3.5%
(11.5)%
Q1 FY21 Q2 FY21 Q3 FY21 Q4 FY21
Source (Left Chart): IRI Syndicated Market Advantage, Total US MULO+C, Conagra Fiscal Quarters
Source (Right Chart): IRI Custom Market Advantage, Total US MULO+C, 13 Weeks Ended May 30, 2021
16Frozen Brands’ Compelling Repeat Rates Versus
Competition
Frozen Repeat Depth Index
(% of Buyers Who Repeat Purchased 2x+, Conagra vs. Competitive Brands Wtd. Avg.)
146
143
133
125
123
118
Source (Left): IRI CSIA Panel, Total US All Outlets, 52 w/e May 16, 2021, Wtd. Average of Peers in Category Weighted to Household Penetration.
Banquet / Marie / Healthy Choice are Single Serve Meals, Birds Eye is Multi-Serve Meals 17Snacks Two-Year Growth Remained Very Strong
Conagra Snacks Retail Sales
(% Change vs. YA) Conagra Snacks
Retail Sales
%Chg vs YA 2-Year Growth (Q4, % Change vs. 2YA)
+22.9%
+21.1% +21.0% Hot Cocoa
+35.6%
+16.9%
+15.7%
+14.9% Microwave Popcorn
+28.7%
+10.9%
Ready to Eat
Pudding/Gelatin
+26.4%
Meat Snacks
+25.5%
(0.5)%
Q1 FY21 Q2 FY21 Q3 FY21 Q4 FY21
Source (Left Chart): IRI Syndicated Market Advantage, Total US MULO+C, Conagra Fiscal Quarters
Source (Right Chart): IRI Custom Market Advantage, Total US MULO+C, 13 Weeks Ended May 30, 2021
18Snacks Repeat Rates Outperformed Competition
Snacks Repeat Depth Index
(% of Buyers Who Repeat Purchased 2x+, Conagra vs. Competitive Brands Wtd. Avg.)
152
136
126
110 107
Source (Left): IRI CSIA Panel, Total US All Outlets, 52 w/e May 16, 2021, Wtd. Average of Peers in Category Weighted to Household Penetration.
Orville is Microwave Popcorn, Duncan Hines is Cake Mix 19Solid Two-Year Growth In Staples
Conagra Staples Retail Sales
(% Change vs. YA) Conagra Staples
Retail Sales
%Chg vs YA 2-Year Growth
(Q4, % Change vs. 2YA)
Canned Meat
+14.2% +14.7% +20.9%
+12.1%
+7.3% +8.0% +9.5% Rfg Whipped
+5.2% Topping
+20.2%
Shelf-Stable Dinners
+10.7%
Canned Tomatoes
+8.2%
(29.0)%
Q1 FY21 Q2 FY21 Q3 FY21 Q4 FY21
Source (Left Chart): IRI Syndicated Market Advantage, Total US MULO+C, Conagra Fiscal Quarters, Staples = Grocery + Refrigerated
Source (Right Chart): IRI Custom Market Advantage, Total US MULO+C, 13 Weeks Ended May 30, 2021
20Consistent Two-Year Growth Rates From Many of
the Largest Staples Brands
Conagra Staples Dollar Sales
(FY21, %Change vs. 2YA)
+23.8% +23.8%
+20.5% +20.4%
+18.7%
+12.8%
+4.0%
Source: IRI Custom Market Advantage, Total US MULO+C, 52 Weeks Ended May 30, 2021, Libby’s & Armour are Canned Meat, Hunt’s is Canned Tomatoes
21Agenda
Business Update
Looking Ahead
22FY22 Priorities
• Continue investing in business to sustain strong performance and emerge from
this dynamic period as a stronger company
• Maintain momentum with consumers through robust FY22 innovation slate
• Aggressively pull margin levers to minimize inflation-related profit lag
• Continue executing on our long-term priorities:
• Frozen continues to grow
• Snacks continues to grow
• Staples remains a reliable contributor
23FY22 Frozen Innovation Packaging under development, subject to change. P.F. Chang’s and P.F. Chang’s Home Menu are registered trademarks of P.F. Chang’s China Bistro, Inc., used under license. 24
FY22 Snacks Innovation

Packaging under development, subject to change.
                                                  25
FY22 Staples Innovation Packaging under development, subject to change. P.F. Chang’s and P.F. Chang’s Home Menu are registered trademarks of P.F. Chang’s China Bistro, Inc., used under license. 26
We Are Pulling on All Levers to Manage Inflation

               List           Trade
Pricing
              Pricing      Optimization

              Channel         Brand       Segment       Product       Margin Accretive
 Mix
                Mix            Mix          Mix           Mix           Innovation

 Cost        Realized                     COVID-19    Discretionary     Customer
                            Synergies
Savings     Productivity                   Costs        Spending        Charges

              Optimize     Acquisitions
 Other       Fixed Cost         &
              Leverage     Divestitures

          Expect a Timing Lag of Benefits Relative to Inflation Headwinds

                                                                                     27
Updating Fiscal 2022 Outlook1,2
FY22 1
1
Prior Updated
Organic Net Sales Growth (vs. FY21) 3 n/a ~Flat
Organic Net Sales Growth (3yr CAGR) 3 +1 to 2% + ~3.5%
Adj. Operating Margin4 18% to 19% ~16%
Adj. EPS $2.63 to $2.73 ~$2.50
1. The inability to predict the amount and timing of the impacts of future items makes a detailed reconciliation of these forward-looking financial measures impracticable.
2. “Adjusted” financial measures, free cash flow, and organic net sales are non-GAAP financial measures.
3. Organic net sales excludes the impact of foreign exchange and divested businesses, acquisitions (until the anniversary date of the acquisitions), as well as the impact of any 53rd week.
4. Adjusted operating margin excludes equity method investment earnings and pension and postretirement non-service expense (income). 28Dave Marberger
Executive Vice President and Chief Financial Officer
29Performance Summary
Dollars in Millions, except per share data
Increase/(Decrease) Q4 vs. YA FY21 vs. YA
Reported Net Sales $2,740 (16.7)% $11,185 +1.2%
Organic Net Sales1 2,711 (10.1)% 11,103 +5.1%
Adj. Gross Profit 721 (22.4)% 3,201 +3.0%
Adj. Gross Margin 26.3% (194) bps 28.6% +50 bps
A&P 75 +27.1% 258 +11.8%
A&P as % of NS 2.7% +95 bps 2.3% +22 bps
Adj. SG&A 263 (14.7)% 988 (6.5)%
Adj. SG&A as % of NS 9.6% +22 bps 8.8% (73) bps
Adj. Op. Profit2 383 (31.8)% 1,955 +7.4%
Adj. Op. Margin2 14.0% (311) bps 17.5% +101 bps
Adj. Net Income 261 (29.1)% 1,289 +15.6%
Adj. EBITDA3 520 (24.6)% 2,446 +6.5%
Adj. EPS $0.54 (28.0)% $2.64 +15.8%
Note: “Adjusted” financial measures and organic net sales are non-GAAP. See the end of this presentation for a reconciliation of these measures to the most directly comparable GAAP measures.
1. Organic net sales excludes the impact of foreign exchange and divested businesses, as well as acquisitions (until the anniversary date of the acquisitions). Organic net sales growth excludes
the impact of fiscal 2020’s 53rd week, which was calculated as one-sixth of our last month’s net sales (which included a total of six weeks).
2. Adjusted operating profit and adjusted operating margin exclude equity method investment earnings and pension and postretirement non-service expense (income).
3. Adjusted EBITDA includes equity method investment earnings and pension and postretirement non-service income.
30Net Sales Bridge vs. Year Ago
Organic Net Sales1: (10.1)% Q4 Drivers of Net Sales Change
(% Change vs. YA)
+2.7%
+0.5%
(1.5)%
(5.6)%
(12.8)%
(16.7)%
Volume Price/Mix Divestitures Foreign 53rd Week Total
(incl. Retailer Exchange Conagra
Investments) Brands
Organic Net Sales1: +5.1% FY21 Drivers of Net Sales Change
(% Change vs. YA)
+3.1%
+2.0%
+1.2%
+0.0%
(2.0)% (1.9)%
Volume Price/Mix Divestitures Foreign 53rd Week Total
(incl. Retailer Exchange Conagra
Investments) Brands
Note: Organic net sales is non-GAAP. See the end of this presentation for a reconciliation of this measure to the most directly comparable GAAP measure. Numbers may not add
due to rounding. Percentage points may include rounding to bridge the change in reported net sales to the change in organic net sales.
1. Organic net sales excludes the impact of foreign exchange and divested businesses, as well as acquisitions (until the anniversary date of the acquisitions). Organic net sales
excludes the impact of fiscal 2020’s 53rd week, which was calculated as one-sixth of our last month’s net sales (which included a total of six weeks).
31Net Sales Summary by Segment
Dollars in Millions
Increase/(Decrease) Net Sales
Reported Organic 1 Reported 1
Organic
Q4 FY
vs. YA vs. YA1 vs. YA vs. YA1
Grocery & Snacks $1,085 (26.4)% (19.0)% $4,638 +0.4% +6.1%
Refrigerated & Frozen 1,193 (12.0)% (5.5)% 4,775 +4.7% +7.5%
International 229 (13.8)% (14.7)% 939 +1.4% +3.8%
Foodservice 233 +20.8% +31.0% 834 (12.4)% (9.7)%
Total Conagra Brands $2,740 (16.7)% (10.1)% $11,185 +1.2% +5.1%
Note: Organic net sales is non-GAAP. See the end of this presentation for a reconciliation of this measure to the most directly comparable GAAP measure. Numbers may not
add due to rounding.
1. Organic net sales excludes the impact of foreign exchange and divested businesses, as well as acquisitions (until the anniversary date of the acquisitions). Organic net sales
excludes the impact of fiscal 2020’s 53rd week, which was calculated as one-sixth of our last month’s net sales (which included a total of six weeks).
32Operating Margin Bridge
Q4 Adj. Operating Margin1
(% Change vs. YA)
Adj. Gross Margin: (194) bps vs. YA
Q4 Inflation:
8.6%
Note: “Adjusted” financial measures are non-GAAP. See the end of this presentation for a reconciliation of these measures to the most directly comparable GAAP measures;
Numbers may not add due to rounding.
1. Adjusted operating margin excludes equity method investment earnings and pension and postretirement non-service expense (income).
33Segment Adjusted Operating Profit & Margin
Summary
Dollars in Millions
Increase/(Decrease) Adj. Op. Profit1 Adj. Op. Margin1
1 1
Q4 vs. YA Q4 vs. YA
Grocery & Snacks $218 (38.1)% 20.1% (380) bps
Refrigerated & Frozen 198 (25.9)% 16.6% (310) bps
International 27 (24.3)% 11.8% (162) bps
Foodservice 19 +1,750% 8.2% +762 bps
Adjusted Corporate Expense (79) (16.1)% - -
Total Conagra Brands $383 (31.8)% 14.0% (311) bps
Note: “Adjusted” financial measures are non-GAAP. See the end of this presentation for a reconciliation of these measures to the most directly comparable GAAP measures.
Numbers may not add due to rounding.
1. Adjusted operating profit and adjusted operating margin exclude equity method investment earnings and pension and postretirement non-service expense (income).
34Adjusted EPS Bridge
Drivers of Q4 Adjusted EPS vs. YA
1
Note: “Adjusted” financial measures are non-GAAP. See the end of this presentation for a reconciliation of these measures to the most directly comparable GAAP measures;
Numbers may not add due to rounding.
1. Adjusted operating profit excludes equity method investment earnings and pension and postretirement non-service expense (income). 35Key Balance Sheet & Cash Flow Metrics
May May
(dollars in millions) 31, 2020 30, 2021
Debt1 $9,747 $9,006
Cash $553 $79
Ending Net Debt1 $9,194 $8,927
Net Leverage Ratio2 4.0x 3.6x
(dollars in millions) FY20 FY21
Net Cash Flow from Operating
$1,843 $1,468
Activities
Capital Expenditures $370 $506
Free Cash Flow $1,473 $962
Dividends Paid $414 $475
Share Repurchases $0 $298
Note: Net Debt, Net Leverage Ratio and Free Cash Flow are non-GAAP. See the end of this presentation for a reconciliation of these measures to the most directly comparable GAAP
measures.
1. Debt is the sum of notes payable, current installments of long-term debt, senior long-term debt, and subordinated debt. Net Debt is Debt less Cash.
2. Net Leverage Ratio is net debt divided by Adjusted EBITDA for the trailing four quarters
36Updating Fiscal 2022 Outlook1,2
FY22 1
1
Prior Updated
Organic Net Sales Growth (vs. FY21) 3 n/a ~Flat
Organic Net Sales Growth (3yr CAGR) 3 +1 to 2% + ~3.5%
Adj. Operating Margin4 18% to 19% ~16%
Adj. EPS $2.63 to $2.73 ~$2.50
1. The inability to predict the amount and timing of the impacts of future items makes a detailed reconciliation of these forward-looking financial measures impracticable.
2. “Adjusted” financial measures, free cash flow, and organic net sales are non-GAAP financial measures.
3. Organic net sales excludes the impact of foreign exchange and divested businesses, acquisitions (until the anniversary date of the acquisitions), as well as the impact of any 53rd week.
4. Adjusted operating margin excludes equity method investment earnings and pension and postretirement non-service expense (income). 37FY22 Inflation Expectation Has Increased
Expected FY22 Total COGS Inflation
(excluding hedging/sourcing benefits)
~9%
~$255M of
incremental
inflation
~6%
~3%
As of 2019 As of Q3 Call Current
Investor Day
38Aggressively Pulling on Levers to Manage Inflation
List Trade
Pricing
Pricing Optimization
Channel Brand Segment Product Margin Accretive
Mix
Mix Mix Mix Mix Innovation
Cost Realized COVID-19 Discretionary Customer
Synergies
Savings Productivity Costs Spending Charges
Optimize Acquisitions
Other Fixed Cost &
Leverage Divestitures
Expect a Timing Lag of Benefits Relative to Inflation Headwinds
39Drivers of Change in Adjusted EPS Guidance
Drivers of Change in FY22 Adj. EPS Guidance
$2.63 - $2.73 $(0.01) $(0.41)
Timing lag
effect
~ $2.50
Note: Size of bars in the chart are not necessarily proportionate to their respective dollar amounts 40FY22 Assumptions
• Organic net sales growth stronger in second half
• Retail demand remains above pre-COVID-19 levels, but to a lesser degree after Q1
• Benefits of pricing actions build through the year
• Second half operating margin higher than first half
• Q1 lowest margin quarter of the year
• Inflation rate decelerates throughout the year
• Maintain strong brand-building support throughout the year
41We Expect Strong Momentum Heading into FY23
• Performance expected to build during fiscal 2022; Expect H2 adjusted
EPS to be in-line with what was assumed for H2 within our prior guidance
• Retail demand is expected to remain above pre-COVID-19 levels in fiscal
2023, supported by fiscal 2022’s continued innovation and brand building
investments
• Fiscal 2022 pricing and productivity-related actions are expected to
benefit margins until lapped, and for the longer-term
• Expect further year-over-year reductions in fiscal 2023 COVID-19-related
costs
42Dividend Update
• Increasing dividend 14% reflecting confidence in outlook
• New dividend to be $0.3125 per quarter or $1.25 annualized
• Represents a 50% payout ratio based on FY22 guidance
43Tax Asset Update
• Original capital loss on Private Brands divestiture was ~$4 billion
• Successfully utilized ~$2 billion of the capital loss carryforward through
divestitures and restructuring activities over the last five years
• Engaged with IRS on potential ways to utilize remaining $2 billion capital
loss carryforward
44Q&A
45Appendix
46Reconciliation of Non-GAAP Financial Measures to
Reported Financial Measures (in millions)
47Reconciliation of Non-GAAP Financial Measures to
Reported Financial Measures (in millions)
48Reconciliation of Non-GAAP Financial Measures to
Reported Financial Measures (in millions)
Grocery & Refrigerated Total Conagra
Q4 FY20 Snacks & Frozen International Foodservice Brands
Net Sales $ 1,474.1 $ 1,355.4 $ 265.7 $ 192.7 $ 3,287.9
Impact of foreign exchange — — 18.8 — 18.8
Impact of 53rd week 2 (91.6 ) (91.0 ) (16.1 ) (13.1 ) (211.8)
Net sales from divested businesses 1 (0.3 ) — — — (0.3 )
Organic Net Sales $ 1,382.2 $ 1,264.4 $ 268.4 $ 179.6 $ 3,094.6
Year-over-year change - Net Sales 44.1 % 23.3 % 18.6 % (27.9 )% 25.8 %
Impact of foreign exchange (pp) — — 8.4 — 0.7
Impact of 53rd week (pp) (9.0 ) (8.3 ) (7.2 ) (4.9 ) (8.1 )
Net sales from divested businesses (pp) 3 5.3 2.6 — 1.3 3.1
Organic Net Sales 40.4 % 17.6 % 19.8 % (31.5 )% 21.5 %
Volume (Organic) 38.0 % 17.8 % 18.0 % (34.2 )% 21.0 %
Price/Mix 2.4 % (0.2 )% 1.8 % 2.7 % 0.5 %
Grocery & Refrigerated Total Conagra
Q4 FY19 Snacks & Frozen International Foodservice Brands
Net Sales $ 1,022.6 $ 1,099.2 $ 224.0 $ 267.4 $ 2,613.2
Net sales from divested businesses 1 (37.9 ) (23.4 ) — (5.1 ) (66.4 )
Organic Net Sales $ 984.7 $ 1,075.8 $ 224.0 $ 262.3 $ 2,546.8
1. A portion of our Net Sales from divested businesses relates to our private label peanut butter business, which we exited in Q3 FY20. This exit occurred in waves, and therefore
produced net sales through the end of fiscal 2020.
2. Organic net sales growth excludes the impact of fiscal 2020’s 53rd week, which was calculated as one-sixth of our last month’s net sales (which included a total of six weeks).
3. Percentage points may include rounding to bridge the change in reported net sales to the change in organic net sales.
49Reconciliation of Non-GAAP Financial Measures to
Reported Financial Measures (in millions)
Grocery & Refrigerated Total Conagra
FY20 Snacks & Frozen International Foodservice Brands
Net Sales $ 4,617.1 $ 4,559.6 $ 925.3 $ 952.4 $ 11,054.4
Impact of foreign exchange — — 18.2 — 18.2
Impact of 53rd week 2 (91.6 ) (91.0 ) (16.1 ) (13.1 ) (211.8 )
Net sales from acquired businesses (406.3 ) (567.6 ) (46.0 ) (57.7 ) (1,077.6 )
Net sales from divested businesses 1 (69.2 ) (23.2 ) — (11.2 ) (103.6 )
Organic Net Sales $ 4,050.0 $ 3,877.8 $ 881.4 $ 870.4 $ 9,679.6
Year-over-year change - Net Sales 17.7 % 22.1 % 7.0 % (6.2 )% 15.9 %
Impact of foreign exchange (pp) — — 2.1 — 0.2
Impact of 53rd week (pp) (2.3 ) (2.4 ) (1.9 ) (1.3 ) (2.2 )
Net sales from acquired businesses (pp) 3 (9.9 ) (15.1 ) (5.1 ) (6.1 ) (11.1 )
Net sales from divested businesses (pp) 3.7 1.5 2.4 3.7 2.8
Net sales from sold Trenton plant (pp) — — — 0.2 —
Organic Net Sales 9.2 % 6.1 % 4.5 % (9.7 )% 5.6 %
Volume (Organic) 9.8 % 5.0 % 3.9 % (12.6 )% 5.2 %
Price/Mix (0.6 )% 1.1 % 0.6 % 2.9 % 0.4 %
Grocery & Refrigerated Total Conagra
FY19 Snacks & Frozen International Foodservice Brands
Net Sales $ 3,923.6 $ 3,735.4 $ 864.4 $ 1,015.0 $ 9,538.4
Net sales from divested businesses 1 (215.0 ) (80.7 ) (21.2 ) (49.2 ) (366.1 )
Net sales from sold Trenton plant — — — (2.0 ) (2.0 )
Organic Net Sales $ 3,708.6 $ 3,654.7 $ 843.2 $ 963.8 $ 9,170.3
1. A portion of our Net Sales from divested businesses relates to our private label peanut butter business, which we exited in Q3 FY20. This exit occurred in waves, and therefore
produced net sales through the end of fiscal 2020.
2. Organic net sales growth excludes the impact of fiscal 2020’s 53rd week, which was calculated as one-sixth of our last month’s net sales (which included a total of six weeks).
3. Percentage points may include rounding to bridge the change in reported net sales to the change in organic net sales.
50Reconciliation of Non-GAAP Financial Measures to
Reported Financial Measures (in millions)
51Reconciliation of Non-GAAP Financial Measures to
Reported Financial Measures (in millions)
52Reconciliation of Non-GAAP Financial Measures to
Reported Financial Measures (in millions)
53Reconciliation of Non-GAAP Financial Measures to
Reported Financial Measures (in millions)
Diluted EPS from
Selling, Income before Net income income attributable
general and income taxes and attributable to to Conagra
administrative Operating equity method Income tax Income Conagra Brands, Inc common
Q4 FY19 Gross profit expenses profit 1 investment earnings expense tax rate Brands, Inc. stockholders
Reported $ 708.0 $ 394.7 $ 313.3 $ 187.8 $ 71.8 36.5 % $ 126.5 $ 0.26
% of Net Sales 27.1 % 15.1 % 12.0 %
Restructuring plans 1.3 29.6 30.9 30.9 7.7 23.2 0.05
Acquisitions and divestitures — 2.3 2.3 2.3 0.4 1.9 —
Intangible impairment charges 3 — 89.6 89.6 89.6 20.8 66.9 0.14
Corporate hedging derivative losses (gains) (2.0 ) — (2.0 ) (2.0 ) (0.5 ) (1.5 ) —
Advertising and promotion expenses 2 — 73.9 — — — — —
Inventory fair value mark-up rollout 1.7 — 1.7 1.7 0.4 1.3 —
Legal matters — (39.1 ) (39.1 ) (39.1 ) (10.0 ) (29.1 ) (0.06 )
Fair value adjustment of cash settleable equity
awards issued in connection with Pinnacle — 3.5 3.5 3.5 (1.8 ) 5.3 0.01
acquisition
Gain on divestiture of businesses — (56.2 ) (56.2 ) (56.2 ) (30.7 ) (25.5 ) (0.05 )
Pension valuation adjustment — — — 4.3 1.1 3.2 0.01
Capital loss valuation allowance adjustment — — — — 8.1 (8.1 ) (0.02 )
Unusual tax items — — — — (10.5 ) 10.5 0.02
Adjusted $ 709.0 $ 291.1 $ 344.0 $ 222.8 $ 56.8 24.5 % $ 174.6 $ 0.36
% of Net Sales 27.1 % 11.1 % 13.2 %
54Reconciliation of Non-GAAP Financial Measures to
Reported Financial Measures (in millions)
55Reconciliation of Non-GAAP Financial Measures to
Reported Financial Measures (in millions)
56Reconciliation of Non-GAAP Financial Measures to
Reported Financial Measures (in millions)
57Reconciliation of Non-GAAP Financial Measures to
Reported Financial Measures (in millions)
58Reconciliation of Non-GAAP Financial Measures to
Reported Financial Measures (in millions)
59Reconciliation of Non-GAAP Financial Measures to
Reported Financial Measures (in millions)
60Reconciliation of Non-GAAP Financial Measures to
Reported Financial Measures (in millions)
FY20
Net Debt $ 9,194.1
Net income attributable to Conagra Brands, Inc. $ 840.1
Add Back: Income tax expense 201.3
Income tax expense attributable to noncontrolling interests (0.9 )
Interest expense, net 487.1
Depreciation 329.1
Amortization 59.8
Earnings before interest, taxes, depreciation, and amortization (EBITDA) $ 1,916.5
Restructuring plans 1 106.5
Acquisitions and divestitures 5.3
Corporate hedging derivative losses 5.5
Pension settlement and valuation adjustment 42.9
Impairment of businesses held for sale 59.0
Loss on divestiture of businesses 1.7
Legal matters 3.5
Environmental matters 6.6
Contract settlement gain (11.9 )
Intangible impairment charges 165.5
Gain on Ardent JV asset sale (4.1 )
Adjusted EBITDA $ 2,297.0
Net Debt to Adjusted EBITDA 4.0
1. Excludes comparability items related to depreciation. 6162
You can also read