Gastrocnemius Medialis Architectural Properties at Rest and During Stretching in Female Athletes with Different Flexibility Training Background - MDPI
←
→
Page content transcription
If your browser does not render page correctly, please read the page content below
sports
Article
Gastrocnemius Medialis Architectural Properties at
Rest and During Stretching in Female Athletes with
Different Flexibility Training Background
Olyvia Donti *, Ioli Panidis, Gerasimos Terzis and Gregory C. Bogdanis *
 Sports Performance Laboratory, School of Physical Education & Sport Science, National and Kapodistrian
 University of Athens, Athens 17237, Greece; ipanidi@phed.uoa.gr (I.P.); gterzis@phed.uoa.gr (G.T.)
 * Correspondence: odonti@phed.uoa.gr (O.D.); gbogdanis@phed.uoa.gr (G.C.B.);
   Tel.: +30-210-727-6044 (O.D.); +30-210-727-6115 (G.C.B.)

 Received: 21 December 2018; Accepted: 10 February 2019; Published: 13 February 2019

 Abstract: Background: This study examined gastrocnemius medialis (GM) architectural properties
 and ankle joint range of motion (ROM) between female athletes with different flexibility training
 background. Methods: Elite rhythmic gymnasts (n = 10) were compared to national level volleyball
 athletes (n = 10). Fascicle length, pennation angle and muscle thickness at the medial and the distal
 part of GM, and ankle ROM were measured at rest and during 1 min of static stretching. Results:
 At rest, rhythmic gymnasts displayed longer fascicles compared to volleyball athletes, at the medial
 (5.93 ± 0.27 vs. 4.74 ± 0.33 mm, respectively, p = 0.001) and the distal part of GM (5.63 ± 0.52 vs.
 4.57 ± 0.51 mm, respectively, p = 0.001), smaller pennation angle at the medial part (22.4 ± 2.5 vs.
 25.8 ± 2.4◦ ; respectively, p = 0.001) and greater ankle angle (121.7 ± 4.1 vs. 113.2 ± 3.7◦ , respectively,
 p = 0.001). During the 1 min of static stretching, gymnasts displayed greater fascicle elongation at
 the distal part (p = 0.026), greater maximal ankle dorsiflexion (p < 0.001) and muscle tendon junction
 displacement (p < 0.001) with no difference between groups in pennation angles (p > 0.145), muscle
 thickness (p > 0.105), and fascicle elongation at mid-belly (p = 0.063). Conclusions: Longer muscle
 fascicles at rest and greater fascicle elongation at the distal part of GM may contribute to the greater
 ankle ROM observed in rhythmic gymnasts.

 Keywords: muscle architecture; fascicle length; stretching; skeletal muscle ultrasonoraphy

1. Introduction
      Flexibility is considered an important fitness component in several sports and especially those
requiring an athlete to move powerfully through a wide range of motion (ROM) [1,2]. Static stretching
is commonly used to increase ROM [3], enhance athletic performance [4], and reduce the risk of muscle
strain related injury [5]. Transient increases in ROM after static stretching are mainly due to increased
stretch tolerance [6], and changes in passive stiffness of the muscle and tendon unit [7]. Chronic
static stretching interventions in animals may induce an increase in muscle size and fascicle length
through the addition of sarcomeres in series, and in particular at the muscle tendon junction (MTJ) [8,9].
However, long-term joint ROM increases following static stretching in humans are not adequately
documented. Simpson et al. [10] found that 6 weeks of overloaded static stretching (stretching in
a leg press machine loaded to 20% of the subjects’ maximal voluntary contraction) increased ankle
ROM (77 ± 5.4◦ to 65.5 ± 5.8◦ , p < 0.001) and medial and lateral gastrocnemii fascicle length and
thickness. In contrast, Blazevich et al. [11] did not detect any changes in plantar flexors fascicle
length, and tendon elongation, following 3 weeks of static stretching training, although stretch training
increased by 19.9 ± 10.8% maximum dorsiflexion ROM (p = 0.001). Collectively, long-term changes in

Sports 2019, 7, 39; doi:10.3390/sports7020039                                   www.mdpi.com/journal/sports
Sports 2019, 7, 39                                                                                          2 of 10

muscle architectural characteristics and joint ROM, following static stretching remain under question.
One reason might be that a parallel change in ROM and muscle architectural characteristics may be
a long-term training adaptation. Although genetic predisposition and sport-specific selection may
affect muscle architecture and joint ROM [12] examining populations with a chronic flexibility training
background may provide additional information on muscle structural adaptations. Along this line,
a long-term stretching intervention (15 weeks) in flexibility trained individuals (female gymnasts)
resulted in significant hip joint ROM increases after the first 6 weeks of training [13].
     However, evidence is limited on the effects of long-term flexibility training on muscle architectural
characteristics. Thus, the purpose of this study was to examine possible differences in GM architectural
characteristics at rest and during 1 min of static stretching, between athletes who have undergone
long-term intensive flexibility training and athletes who typically perform significantly less stretching
in their everyday training. To this end, we compared female athletes with at least 10 years training
background from two different sports: rhythmic gymnastics and volleyball. Elite rhythmic gymnasts
typically perform extensive flexibility training [14], while volleyball training does not include the
amount of stretching training that is performed in rhythmic gymnastics [15]. The medial gastrocnemius
muscle was used, since ankle plantar flexors are both important power generators during jumping [16]
and their extensibility is closely linked with ankle joint ROM. Muscle architectural parameters were
determined not only at mid-belly, but also at the distal part of the muscle, since the mid-belly might
not accurately reflect muscle architecture across the entire gastrocnemius muscle [17].

2. Materials and Methods

2.1. Participants
     Ten elite level, rhythmic gymnasts, were compared to 10 female, national level volleyball players.
While both sports involve jumping and landing activities, rhythmic gymnastics training includes
extensive daily flexibility training (≈60 min), while volleyball (and most team sports) training includes
Sports 2019, 7, 39 3 of 10
the testing procedures and obtain anthropometric characteristics. The main testing session included
Sports 2019, 7 FOR PEER
measurements REVIEW
of resting fascicle length, pennation angle, muscular thickness, and ankle joint ROM3
with the participants lying in prone position. Following 2 min of standing, the same variables were
with the participants lying in prone position. Following 2 min of standing, the same variables were
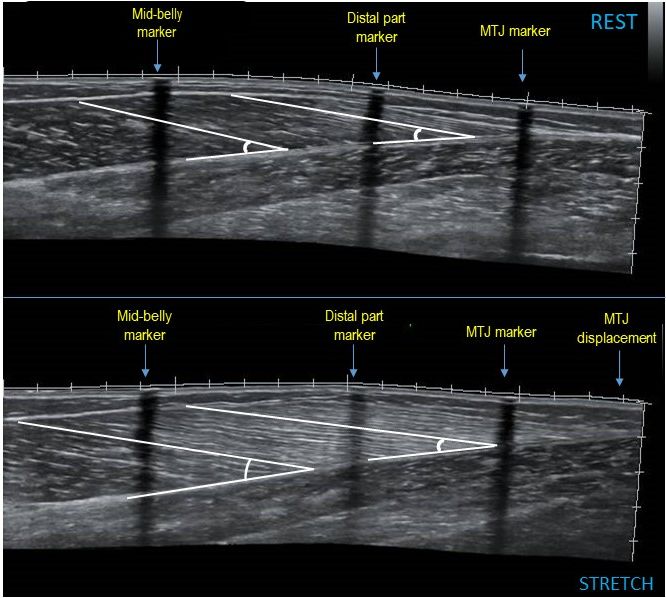
assessed during the 1 min standing calf stretching (Figure 1).
assessed during the 1 min standing calf stretching (Figure 1).
Figure 1. Schematic representation of the study protocol. Measurements of panoramic ultrasound
Figure 1. Schematic representation of the study protocol. Measurements of panoramic ultrasound
images and ankle joint angles are indicated by arrows.
images and ankle joint angles are indicated by arrows.
2.3. Anthropometry
2.3. Anthropometry
Height, was measured to the nearest 0.1 cm with the use of a stadiometer (Seca 208, Hamburg,
Height,
Germany) and was measured
body mass was to measured
the nearestto0.1thecm with the
nearest usewith
0.1 kg of a astadiometer (Seca 208,
calibrated digital scaleHamburg,
(Seca 710,
Germany) and
Hamburg, body mass
Germany). Leg was measured
length to the nearest
was measured 0.1 kg with
as the distance a calibrated
between the mostdigital scale (Seca
prominent point 710,
of
Hamburg, Germany). Leg length was measured as the distance between the most
the trochanter major to the floor with the athletes standing upright. Calf length was measured from prominent point of
the tibiofemoral
the trochanter major
cleft to
to the
the floor
most with the athletes
prominent spot ofstanding
the medial upright. Calf length was measured from
malleolus.
the tibiofemoral cleft to the most prominent spot of the medial malleolus.
2.4. Resting Muscle Architecture and Ankle Joint Angle
2.4. Resting Muscle Architecture and Ankle Joint Angle
All ultrasound measurements were performed between 9:00 and 12:00, after participants remained
All ultrasound
in a prone position for measurements
20 min, with the were performed
foot hanging freelybetween 9:00examination
off the and 12:00, bed, aftertoparticipants
allow fluid
remained in a prone position for 20 min, with the foot hanging freely off
redistribution [20]. This ankle position was considered as resting prone position. Architectural the examination bed, to
allow fluid redistribution
characteristics (fascicle length,[20].pennation
This ankle position
angle was considered
and muscle thickness) ofasGM resting
of theprone position.
right leg, were
Architectural
measured characteristics
at the middle and(fascicle
the distal length,
part ofpennation
the GM muscleangle and muscle
belly: 30% andthickness)
50% ofofthe GM of the
distance
right leg,
from the were measured
popliteal creaseattothethemiddle
centre and themedial
of the distal part of the GM
malleolus muscle belly:
respectively, marked 30% on
andthe 50% of
skin
the distance
through from the
placement ofpopliteal crease to themarker
an echo-absorptive centre [21].
of theThemedial malleolus
location of the respectively, marked on
GM musculotendinous
the skin(MTJ)
junction through placement
was identified by of an echo-absorptive
ultrasonography and marked marker
on the[21].
skinThe location
surface through of placement
the GM
musculotendinous
of an echo-absorptive junction
marker.(MTJ) was identified
Panoramic B-mode byultrasound
ultrasonography
imagesand from marked
GM were on the skin surface
obtained with
through
a 38-mmplacement
linear probe of an echo-absorptive
using the “i-scape”marker.
software Panoramic B-mode ultrasound
of the ultrasound images from
device (10.0-MHz, GM
Product
were obtained with a 38-mm linear probe using the “i-scape” software of the
model Z5, Shenzen, Mindray Bio-Medical Electronics Co., Ltd., Shenzen, China). Aquasonic clear ultrasound device (10.0-
MHz, Product
ultrasound model Z5,gel
transmission Shenzen,
(Parker Mindray Bio-Medical
laboratories, Inc., NewElectronics
Fairfield, NewCo., Ltd.,
Jersey,Shenzen, China).
USA) provided
Aquasonic
acoustic clear between
contact ultrasound thetransmission
probe and the gel (Parker
skin. laboratories,was
The transducer Inc., New 38
placed Fairfield,
mm beforeNewthe Jersey,
skin
USA) provided
marker acoustic
identifying contact
the 30% of thebetween
distancethe probe and
between the skin. crease
the popliteal The transducer was placed
and the center 38 mm
of the medial
before the skin
malleolus. The marker
transduceridentifying
was placedthe 30% of the distance
longitudinal at tibia,between
orientedthein popliteal
parallel tocrease and the
the muscle center
fascicles
of the
and medial malleolus.
perpendicular to the The
skin.transducer was placed
The transducer’s longitudinal
alignment at tibia, oriented
was considered satisfactory in parallel to the
when several
muscle fascicles
fascicles and perpendicular
could be outlined to the
across the image skin. interruption.
without The transducer’sThe probealignment
path was wasdrawn
considered
on the
satisfactory when several fascicles could be outlined across the image without interruption. The
probe path was drawn on the skin with a pen according to the fascicle path seen from the real-time
ultrasound image [22]. Panoramic images were obtained by moving the probe slowly along the
marked line, as a continuous single view. Muscle fascicle length was measured as a linear trace fromSports 2019, 7, 39 4 of 10
Sports 2019, 7 FOR PEER REVIEW 4
skin with a pen according to the fascicle path seen from the real-time ultrasound image [22]. Panoramic
images were obtained by moving the probe slowly along the marked line, as a continuous single
the lower aponeurosis to the upper aponeurosis (Motic Images Plus 2.0, Motic, Hong Kong, China).
view. Muscle fascicle length was measured as a linear trace from the lower aponeurosis to the upper
The lengths of three muscle fascicles crossing the shadow of the echo-absorptive marker at the middle
aponeurosis (Motic Images Plus 2.0, Motic, Hong Kong, China). The lengths of three muscle fascicles
andcrossing
at the distal part ofof
the shadow the GM,
the were averaged
echo-absorptive and subsequently
marker at the middleused
and atforthe
analysis. Pennation
distal part angle
of the GM,
was taken
were as theand
averaged average angle ofused
subsequently theseforthree fascicles,
analysis. measured
Pennation at the
angle was takenpoint where
as the they
average metofthe
angle
lower
these three fascicles, measured at the point where they met the lower aponeurosis at the middle andthe
aponeurosis at the middle and the distal part of the GM. Muscle thickness was
perpendicular
the distal partdistance
of the GM.between
Muscle the superficial
thickness was theand deep aponeuroses.
perpendicular Musclethe
distance between thickness was
superficial
measured
and deep aponeuroses. Muscle thickness was measured at the middle and the distal part of the GMthe
at the middle and the distal part of the GM over two consecutive measurements and
average value
over two was usedmeasurements
consecutive for further analysis.
and the(Figure
average2).
value was used for further analysis. (Figure 2).
Figure
Figure 2. 2. Panoramic
Panoramic sonographicimage
sonographic imageofofaa rhythmic
rhythmic gymnast
gymnast gastrocnemius
gastrocnemiusmedialis
medialisatatrest and
rest and
during stretching, showing fascicle length and pennation angle at mid-belly and at the distal part of
during stretching, showing fascicle length and pennation angle at mid-belly and at the distal part of
the muscle. MTJ: muscle-tendon junction.
the muscle. MTJ: muscle-tendon junction.
Following measurement of muscle architecture, resting ankle joint angle, was determined with the
Following
subjects at themeasurement
same position. of muscle motion
Reflective architecture, resting
analysis ankle
markers werejoint angle,
placed wasknee
on the determined
(femur-tibiawith
thejoint
subjects
line),at the same
ankle (lateralposition. Reflective
malleolus), and themotion analysis to
fifth metatarsal markers
determinewere placed
ankle onangle
joint the knee (femur-
at rest and
tibia joint stretching.
during line), ankleThe (lateral malleolus),
position and thewas
of the markers fifth metatarsal
recorded usingtoadetermine ankle
digital camera joint Exilim
(Casio angle at rest
Pro
andEX-F1)
during stretching. The position of the markers was recorded using a digital camera
placed perpendicular to the plane of motion of the leg, and ankle angle was calculated using (Casio Exilim
Profree
EX-F1) placed
software perpendicular
(Tracker 4.91 © 2016 to the plane
Douglas Brown, of California,
motion of USA).
the leg, and ankle
Resting anglewas
ankle angle wasdefined
calculated
as
using free software (Tracker 4.91 © 2016 Douglas Brown, California, USA). Resting
the angle between the lines crossing the femur-tibia joint and lateral malleolus and the line defined by ankle angle was
defined
the downas the angle
part between
of the heel andthe
thelines
end crossing
of the fifththe femur-tibia
metatarsal bone.joint
Theand lateral correlation
intra-class malleolus and the line
coefficient
defined
(ICC) forby resting
the down anklepart
angleofwas
the0.96
heel(95%andconfidence
the end intervals
of the fifth
(CI):metatarsal
0.779–0.993,bone. The intra-class
p = 0.000).
Intersession
correlation coefficientreliability of ultrasound
(ICC) for resting ankle images
angle was determined
was 0.96 (95%by comparingintervals
confidence the analysis
(CI):of0.779–
the
images
0.993, obtained by 6 participants over two measurements on two separate days. The ICC for muscle
p = 0.000).
fascicle length was
Intersession 0.93 (95%
reliability CI: 0.670–0.988,
of ultrasound imagesp = was
0.000), for muscular
determined by thickness
comparing it was 0.89 (95%ofCI:
the analysis the
0.500–0.981,
images obtained p =by0.001), and for pennation
6 participants over twoangle, 0.81 (95% CI:
measurements on0.265–0.986,
two separate p =days.
0.013).
The ICC for muscle
fascicle length was 0.93 (95% CI: 0.670–0.988, p = 0.000), for muscular thickness it was 0.89 (95% CI:
0.500–0.981, p = 0.001), and for pennation angle, 0.81 (95% CI: 0.265–0.986, p = 0.013).
2.5. Muscle Architecture and Ankle Dorsiflexion Angle during Stretching
Following the method described above, ultrasound images were obtained from the middle and
the distal part of the GM muscle belly. Subsequently, athletes remained at a standing position for 2Sports 2019, 7, 39 5 of 10
2.5. Muscle Architecture and Ankle Dorsiflexion Angle during Stretching
Following the method described above, ultrasound images were obtained from the middle and
the distal part of the GM muscle belly. Subsequently, athletes remained at a standing position for
2 min. After standing for 2 min, athletes performed a slow, passive standing gastrocnemius stretch
(dorsiflexion), for 1 min, to the point of discomfort. A schematic representation of the study protocol is
shown in Figure 1. Ultrasound panoramic views were obtained from the right GM during the 1 min
passive standing gastrocnemius stretching intervention. Fascicle length, pennation angle and muscle
thickness of GM of the right leg, were measured at the middle and the distal part of the GM muscle
belly: 30% and 50% of the distance from the popliteal crease to the center of the medial malleolus
respectively, marked on the skin [23]. Ultrasound probe was placed 38-mm above the skin marker
identifying the middle part of the muscle belly. The probe path was drawn on the skin with a pen
according to the fascicle path seen from the real-time ultrasound image [22]. The distance between the
MTJ of the GM at rest and during stretching was defined as “MTJ displacement” [24]. Standing, ankle
dorsiflexion stretching was performed with the participants barefoot, in a slow, continuous manner for
1 min. This stretch modality was chosen because it is commonly performed in sport environments [25].
Subjects were instructed to relax and to offer no active resistance to the movement. A 5 s pause was
imposed before the end point of the static stretching, to allow still images to be acquired. To stretch the
GM, the right foot was placed on the midline of a predetermined floor area with the heel at the edge
of the area. The left foot was placed forward at a distance equal to the subject’s step length, which
was measured in the familiarization session during gait. The subjects were asked to lean forward
until the ankle attained dorsiflexion at the point of discomfort (80–90% of the maximum tolerate
stretch) without heel lift or pelvic rotation. The hip and knee joints were maintained at an extended
position during stretching. The subjects were asked to place their hands against the wall and to slowly
bear their body weight on the foot to be tested [25]. Stretch intensity was determined based on the
feedback from the subjects to ensure that stretch achieved the point of discomfort (rating 80 to 90,
indicated by the athletes on a visual analogue scale of 0–100). Based on the same procedure used in
prior investigations [26] the athletes were informed that 0 represented “no stretch discomfort at all”
and 100 represented “maximal stretch discomfort”.
Following the method described above, maximal ankle dorsiflexion angle was measured using
reflective motion analysis markers placed on the knee, ankle and fifth metatarsal. The angle between
the horizontal and the line joining the knee and ankle markers was defined as the dorsiflexion angle.
2.6. Statistical Analysis
Data are presented as means and standard deviations. The normality of data distribution was
checked with the Shapiro–Wilks test. Between-groups differences, in anthropometric characteristics
and architectural characteristics of GM at rest, were analyzed using unpaired T-test. A two-way analysis
of variance (ANOVA) (time x group) with repeated measures for time (pre- and post-stretching) and
group (rhythmic gymnasts or volley ball athletes) was conducted to examine the effect of stretching
on all the examined variables (SPSS Statistics Version 22.0, IBM Corporation, Armonk, NY, USA).
When a significant main effect or interaction was observed (p < 0.05) a Tukey’s post–hoc test was
performed to examine significant differences between pairs of means. Effect sizes (ES) for the ANOVA
were determined by partial eta squared (η2 ) (small: 0.01 to 0.059, moderate: 0.06 to 0.137, large >
0.138). For pairwise comparisons, ES was determined by Cohen’s d (trivial: 0–0.19, small: 0.20–0.49,
moderate: 0.50–0.79 and large: 0.80 and greater) [27]. Test-retest reliability was assessed by calculating
the intra-class correlation coefficients (ICCs). ICC values less 0.90
were considered indicative of poor, moderate, good, and excellent reliability, respectively. Statistical
significance was set at p < 0.05.Sports 2019, 7, 39 6 of 10
3. Results
3.1. Resting Muscle Architecture and Ankle Joint Angle
Rhythmic gymnasts displayed longer fascicles compared to the volleyball athletes, at mid-belly
(t18 = 8.750, p = 0.000) and at the distal part of the GM (t18 = 4.646, p = 0.000) (by 20 and 18%, respectively)
and greater resting ankle joint angle by 7% (t18 = 4.662, p = 0.000). The two groups had similar GM
muscle thickness both at mid-belly (t18 = 1.411, p = 0.175) and distally (t18 = 1.248, p = 0.228) as well as
distal pennation angle (t18 = −1.329, p = 0.201). Volleyball athletes demonstrated greater pennation
angle compared to rhythmic gymnasts at mid-belly, by 10% (t18 = −3.185, p = 0.005).
3.2. Muscle Architecture and Ankle Dorsiflexion Angle during Stretching
Rhythmic gymnasts displayed similar changes to volleyball athletes in pennation angles at
mid-belly (24 vs. 28%, respectively) and at the distal part of GM (17 vs. 12%, respectively) (p > 0.145),
and similar muscle thickness at mid-belly (9 vs. 5%, respectively) and at the distal part (51 vs. 64%,
respectively) (p > 0.105) (Table 2). No difference was found between rhythmic gymnasts and volleyball
athletes, in fascicle elongation at mid-belly (41 vs. 40%, respectively) (p = 0.063). However, gymnasts
displayed greater fascicle elongation at the distal part of the GM (45 vs. 39%, respectively) (p = 0.026)
greater maximal ankle dorsiflexion angle (51 vs. 43%, respectively) (p < 0.035) and MTJ displacement
(p = 0.001) (Table 2).
Table 2. Changes in muscle architecture characteristics and ankle range of motion (ROM) following
stretching for the rhythmic gymnasts (n = 10) and the volleyball athletes (n = 10).
Cohens’ d ∆ Values Cohens’ d
Pre-Stretching Stretching
Parameter Group p (pre vs. (pre vs. of ∆ Values
Measurements Measurements
Stretching) Stretching) between Groups
Fascicle Length Rhythmic 5.93 ± 0.27 8.37 ± 0.68 0.063 4.97 2.44 ± 0.59
0.94
Mid-belly (cm) Volleyball 4.74 ± 0.33 † 6.62 ± 0.81 † 3.20 1.88 ± 0.67
Fascicle Length Rhythmic 5.63 ± 0.52 8.14 ± 0.74 0.026 4.14 2.51 ± 0.54
1.15
Distal part (cm) Volleyball 4.57 ± 0.51 † 6.31 ± 0.91 † 2.49 1.74 ± 0.84
Thickness Rhythmic 2.36 ± 0.66 2.56 ± 0.62 0.105 0.33 0.20 ± 0.15
0.79
Mid-belly (cm) Volleyball 2.04 ± 0.21 2.16 ± 0.22 0.59 0.11 ± 0.08
Thickness Rhythmic 1.04 ± 0.27 1.51 ± 0.24 0.868 1.94 0.47 ± 0.16
0.06
Distal part (cm) Volleyball 0.86 ± 0.36 1.34 ± 0.44 1.26 0.48 ± 0.18
Pennation angle Rhythmic 22.4 ± 2.5 16.9 ± 1.7 0.145 2.66 5.4 ± 2.2
0.72
Mid-belly (◦ ) Volleyball 25.8 ± 2.4 † 18.7 ± 3.1 2.71 7.2 ± 2.9
Pennation angle Rhythmic 19.0 ± 2.5 15.8 ± 2.4 0.478 1.42 3.2 ± 2.0
0.32
Distal part (◦ ) Volleyball 20.5 ± 2.6 18.0 ± 3.7 0.81 2.5 ± 2.8
Ankle ROM Rhythmic 121.7 ± 4.1 59.1 ± 4.6 0.001 15.24 62.6 ± 2.7
4.60
(◦ ) Volleyball 113.2 ± 3.7 † 65.0 ± 4.7 † 12.00 48.2 ± 3.8
MTJ Displacement Rhythmic 3.15 ± 0.56
1.43
(cm) Volleyball 2.31 ± 0.67 †
†: p < 0.001 from the corresponding value in Rhythmic gymnasts. Ankle ROM: from resting ankle joint angle
(pre-stretching measurements) to maximal ankle dorsiflexion angle (stretching measurements).
4. Discussion
The aim of this study was to examine whether elite rhythmic gymnasts display different
architectural characteristics of GM at the middle and the distal part of the muscle belly and different
ankle joint angles, at rest and during stretching, compared to volleyball athletes that do not engage
in extensive flexibility training. The main findings of this study were that, compared with volleyball
athletes, rhythmic gymnasts displayed greater resting fascicle length at the middle and at the distal
part of the GM, greater fascicle elongation at the distal part of GM during stretching, greater MTJ
displacement and greater ankle joint angles both, at rest and during dorsiflexion.
The greater fascicle length of the GM muscle in rhythmic gymnasts at mid-belly and at the distal
part (by 20 and 18%, respectively) compared with volleyball players is an interesting finding of theSports 2019, 7, 39 7 of 10
present study. A number of cross-sectional studies indicated sport-specific profiles of fascicle length in
athletes [28,29]. For example, elite track-and-field sprinters had greater vastus lateralis and GM fascicle
lengths compared to control subjects [28], and the same was found in sprinters’ fascicle length of the
lateral gastrocnemius compared to controls [29]. Although cross-sectional studies cannot exclude the
possibility of inherited profiles in athletes, long-term, systematic sport-specific training may have a
substantial impact on muscle architecture. Recently, Moltubakk et al. [30] compared ballet dancers
to controls. The authors found longer GM fascicles in resting prone position in ballet dancers and
suggested that long-term flexibility training may induce adaptations at the sarcomere level [30].
However, stretching interventions reported equivocal results. In a recent meta-analysis,
Freitas et al. [31] reported that short-term stretching interventions (3–8 weeks) in adults do not change
muscle and tendon architectural properties although they increase muscle extensibility and tolerance to
a greater tensile force. In contrast, Simpson et al. [10] found increased medial and lateral gastrocnemii
fascicle length and greater pennation angles following 6-weeks of loaded static stretching training.
Nevertheless, an increase in fascicle length following stretching has not yet been clearly demonstrated
in humans and longitudinal studies are needed to examine long-term adaptations to stretching training
and distinguish them from factors such as genetic predisposition and sport selection [30].
Fascicle elongation was measured at mid-belly and at the distal part of GM during maximal
ankle dorsiflexion. Previous studies found greater elongation in flexible compared to inflexible
subjects [30,32] and stretching interventions studies also reported an increased muscle extensibility
after 3 or 4 weeks of static stretching training [11,24]. In the present study, rhythmic gymnasts
demonstrated similar fascicle elongation to volleyball players at mid-belly (41 vs. 40%, respectively)
and, although the effect size was large (d = 0.94), the difference did not reach statistical significance
(p = 0.063, Table 2). A possible explanation of this result may be participants training history. Although
volleyball players were not submitted to extensive flexibility training, they were high-level athletes
who also performed other types of training, such as plyometric exercises, and eccentric training that
may have increased muscle extensibility, while in previous studies, flexible subjects were compared to
active controls [30].
Interestingly, significantly greater elongation was observed in rhythmic gymnasts at the distal
part of the GM (45 vs. 39%, respectively) (p = 0.026, d = 1.15, Table 2) and significantly greater MTJ
displacement. It is reported that architectural adaptations may be specific to certain regions of the
muscle [33]. Longitudinal variations in fibre length [34] and orientation have been shown to occur
along a given muscle [33]. The commonly used location for longitudinal measures of the GM is at
30% of the straight-line distance from the popliteal crease to the centre of the medial malleolus [21].
However, fascicle length at mid-belly may not reflect muscle architecture accurately across the entire
muscle [17] therefore in the present study, the 50% of the same distance (distal) was also assessed.
Zhang et al. [17] reported that passive fascicle lengths were longer distally compared to proximally
during ankle dorsiflexion. Also, a recent stretching intervention in adults found that lateral and medial
gastrocnemii muscle fascicles in the musculotendinous junction lengthened more than those in the
muscle belly (by 25 and 5% respectively) after 6 weeks of stretching training [10]. De Monte et al. [35]
examined GM fascicle elongation during ankle dorsiflexion and reported that the displacement of the
point located on the MTJ was significantly greater than that of the point located on the aponeurosis.
Collectively, it is possible that architectural adaptations of the GM may occur non-homogeneously
along the length of the muscle. In animal studies it has been shown that sarcomere number is adjusted
so as to achieve an optimum sarcomere length where a muscle experiences its highest levels of
tension [36] and Jakobsen et al. [37] reported that a great proportion of the muscle fibres near the MTJ
seem to undergo remodelling.
In the present study, rhythmic gymnasts had greater ankle angle at rest, in prone position by 7%,
compared to volleyball players (Table 2). Resting angle joint angle is influenced by the sum of all the
torques acting around the joint [30]. In a recent study comparing triceps surae architectural properties
in ballet dancers and controls, Moltubakk et al. [30] found similar resting ankle joint angle betweenSports 2019, 7, 39 8 of 10
the two groups and the authors assumed that the different operating length of the dancers, depended
on tissue material properties and did not imply different slack length of the tissues surrounding the
joint. Blazevich et al. [32] also reported no differences in the ankle joint angle anatomical position
between flexible and inflexible subjects, however, the authors did not examine the flexibility training
background of the participants. The mechanisms underpinning the different resting ankle joint angle
between rhythmic gymnasts and volleyball athletes cannot be explained by the present study design.
Albeit speculative, the greater resting ankle angle may imply a different slack length, due to long-term,
extensive flexibility training. However, further research is needed to examine if long-term systematic
flexibility training and/or other training regimes may alter the ‘neutral’, resting ankle joint angle.
Moltubakk et al. [30] pointed out that ‘neutral’ ankle joint angle may not be a valid starting point for
all populations for measuring elongation or the different components of the muscle tendon unit.
Maximal ankle dorsiflexion range of motion was significantly greater in rhythmic gymnasts
compared to the volleyball athletes (51 vs. 43%, respectively) (Table 2). Maximal ankle dorsiflexion
angle was defined by the end point of the motion that all athletes could achieve. Greater joint ROM has
also been reported in previous studies in flexible vs. inflexible subjects [30,32]. Moltubakk et al. [30]
also reported greater ankle dorsiflexion ROM in ballet dancers compared to controls, a fact consistent
with the higher volume of stretching performed during their training practices. The longer GM
fascicles and a greater maximal fascicle elongation during stretch may facilitate the greater maximal
ankle dorsiflexion angle observed in rhythmic gymnasts [30].
5. Conclusions
In conclusion, greater ankle angles at rest and during dorsiflexion were observed in elite rhythmic
gymnasts compared to volleyball players, longer GM fascicles at the middle and at the distal part of
the GM and greater muscle elongation at the distal part of GM during static stretching. These findings
highlight that muscle architectural properties differ between athletes with different flexibility and that
there may be non-uniform adaptations along GM length depending on training history. However,
this study design limits interpretation of these findings. Chronic flexibility training may be part of the
stimulus inducing muscle architectural adaptations however, other factors, such as heredity may also
influence muscle architecture.
Author Contributions: Conceptualization, O.D., I.P. and G.C.B.; Data curation, O.D., and I.P.; Methodology, O.D.,
G.T. and G.C.B.; Writing—original draft, O.D. and I.P.; Writing—review and editing, G.T. and G.C.B.
Funding: This research received no external funding.
Acknowledgments: The authors would like to thank the athletes for their dedicated time and collaboration.
Conflicts of Interest: The authors have no conflict of interest to declare.
References
1. Magnusson, P.; Renström, P. The European College of Sports Sciences Position statement: The role of
stretching exercises in sports. Eur. J. Sport. Sci. 2006, 6, 87–91. [CrossRef]
2. Sands, W.A.; McNeal, J.R.; Stone, M.H.; Russell, E.M.; Jemni, M. Flexibility enhancement with vibration:
Acute and Long-Term. Med. Sci. Sports Exerc. 2006, 38, 720–725. [CrossRef] [PubMed]
3. Jamtvedt, G.; Herbert, R.D.; Flottorp, S.; Odgaard-Jensen, J.; Håvelsrud, K.; Barratt, A.; Mathieu, E.; Burls, A.;
Oxman, A.D. A pragmatic randomised trial of stretching before and after physical activity to prevent injury
and soreness. Br. J. Sports Med. 2010, 44, 1002–1009. [CrossRef] [PubMed]
4. Young, W.B.; Behm, D.G. Should Static Stretching Be Used During a Warm-Up for Strength and Power
Activities? Strength Cond. J. 2002, 24, 33–37. [CrossRef]
5. Gabbe, B.J.; Finch, C.F.; Bennell, K.L.; Wajswelner, H. Risk factors for hamstring injuries in community level
Australian football. Br. J. Sports Med. 2005, 39, 106–110. [CrossRef]
6. Magnusson, S.P. Passive properties of human skeletal muscle during stretch maneuvers. Scand. J. Med. Sci.
Sports 1998, 8, 65–77. [CrossRef]Sports 2019, 7, 39 9 of 10
7. Morse, C.I.; Degens, H.; Seynnes, O.R.; Maganaris, C.N.; Jones, D.A. The acute effect of stretching on the
passive stiffness of the human gastrocnemius muscle tendon unit. J. Physiol. 2008, 586, 97–106. [CrossRef]
8. Dix, D.J.; Eisenburg, B.R. Myosin mRNA accumulation and myofibrillar genesis at the myotendinous
junction of stretched muscle fibres. J. Cell Biol. 1990, 111, 1885–1894. [CrossRef]
9. Williams, P.E.; Goldspink, G. Longitudinal growth of striated muscle fibres. J. Cell Sci. 1971, 9, 751–767.
10. Simpson, C.L.; Kim, B.D.H.; Bourcet, M.R.; Jones, G.R.; Jakobi, J.M. Stretch training induces unequal
adaptation in muscle fascicles and thickness in medial and lateral gastrocnemii. Scand. J. Med. Sci. Sports
2017, 27, 1597–1604. [CrossRef]
11. Blazevich, A.J.; Cannavan, D.; Waugh, C.M.; Miller, S.C.; Thorlund, J.B.; Aagard, P.; Kay, A.D. Range of
motion, neuromechanical, and architectural adaptations to plantar flexor stretch training in humans. J. Appl.
Physiol. 2014, 117, 452–462. [CrossRef] [PubMed]
12. Silva, C.C.; Silva, L.F.; Santos, C.R.; Goldberg, T.B.; Ramos, S.P.; Venancio, E.J. Genetic polymorphism on the
flexibility of elite rhythmic gymnasts: State of art. Apunts. Med. L’esport 2018. [CrossRef]
13. Donti, O.; Papia, K.; Toubekis, A.; Donti, A.; Sands, W.A.; Bogdanis, G.C. Flexibility training in preadolescent
female athletes: Acute and long-term effects of intermittent and continuous static stretching. J. Sports Sci.
2018, 36, 1453–1460. [CrossRef]
14. Douda, H.T.; Toubekis, A.G.; Avloniti, A.A.; Tokmakidis, S.P. Physiological and anthropometric determinants
of rhythmic gymnastics performance. Int. J. Sports Physiol. Perform. 2008, 3, 41–54. [CrossRef] [PubMed]
15. Malliaras, P.; Cook, J.L.; Kent, P. Reduced ankle dorsiflexion range may increase the risk of patellar tendon
injury among volleyball players. J. Sci. Med. Sports 2006, 9, 304–309. [CrossRef] [PubMed]
16. Bobbert, M.F.; Mackay, M.; Schinkelshoek, D.; Huijing, P.A.; van Ingen Schenau, G.J. Biomechanical analysis
of drop and countermovement jumps. Eur. J. Appl. Physiol. Occup. Physiol. 1986, 54, 566–573. [CrossRef]
[PubMed]
17. Zhang, T.K.; Fortuna, R.; Herzog, W. Distal and proximal fascicle length changes in active and passive
human gastrocnemius muscle. J. Undergrad. Res. Alberta 2015, 5, 30305.
18. Simenz, C.J.; Dugan, C.A.; Ebben, W.P. Strength and conditioning practices of National Basketball Association
strength and conditioning coaches. J. Strength. Cond. Res. 2005, 19, 495–504.
19. Gabbett, T.; Georgieff, B. Physiological and anthropometric characteristics of Australian junior national, state
and novice volleyball players. J. Strength Cond. Res. 2007, 21, 902–908. [CrossRef]
20. Reeves, N.; Maganaris, C.; Narici, M. Ultrasonographic assessment of human skeletal muscle size. Eur. J.
Appl. Physiol. 2004, 91, 116–118. [CrossRef]
21. Kawakami, Y.; Kanehisa, H.; Fukunaga, T. The relationship between passive ankle plantar flexion joint
torque and gastrocnemius muscle and achilles tendon stiffness: Implications for flexibility. J. Orthop. Sports
Phys. Ther. 2008, 38, 269–276. [CrossRef] [PubMed]
22. Noorkoiv, M.; Stavnsbo, A.; Aagaard, P.; Blazevich, A. In vivo assessment of muscle fascicle length by
extended field-of-view ultrasonography. J. Appl. Physiol. 2010, 109, 1974–1979. [CrossRef] [PubMed]
23. Kawakami, Y.; Ichinose, Y.; Fukunaga, T. Architectural and functional features of human triceps surae
muscles during contraction. J. Appl Physiol 1998, 85, 398–404. [CrossRef] [PubMed]
24. Nakamura, M.; Ikezoe, T.; Takeno, Y.; Ichihashi, N. Effects of a 4-week static stretch training program on
passive stiffness of human gastrocnemius muscle-tendon unit in vivo. Eur. J. Appl. Physiol. 2012, 112,
2749–2755. [CrossRef] [PubMed]
25. Jung, D.Y.; Koh, E.K.; Kwon, O.Y.; Yi, C.H.; Oh, J.S.; Weon, J.H. Effect of medial arch support on displacement
of the myotendinous junction of the gastrocnemius during standing wall stretching. J. Orthop. Sports Phys.
Ther. 2009, 39, 867–874. [CrossRef] [PubMed]
26. Behm, D.G.; Kibele, A. Effects of differing intensities of static stretching on jump performance. Eur. J. Appl.
Physiol. 2007, 101, 587–594. [CrossRef] [PubMed]
27. Cohen, J. A power primer. Psychol. Bull. 1992, 112, 155–159. [CrossRef] [PubMed]
28. Abe, T.; Kumagai, K.; Brechue, W.F. Fascicle length of leg muscles is greater in sprinters than distance runners.
Med. Sci. Sports Exerc. 2000, 32, 1125–1129. [CrossRef] [PubMed]
29. Lee, S.S.; Piazza, S.J. Built for speed: Musculoskeletal structure and sprinting ability. J. Exp. Biol. 2009, 212,
3700–3707. [CrossRef] [PubMed]Sports 2019, 7, 39 10 of 10
30. Moltubakk, M.M.; Magulas, M.M.; Villars, F.O.; Seynnes, O.R.; Bojsen-Møller, J. Specialized properties of the
triceps surae muscle-tendon unit in professional ballet dancers. Scand. J. Med. Sci. Sports 2018, 28, 2023–2034.
[CrossRef]
31. Freitas, S.R.; Mendes, B.; Le Sant, G.; Andrade, R.J.; Nordez, A.; Milanovic, Z. Can chronic stretching change
the muscle-tendon mechanical properties? A review. Scand. J. Med. Sci. Sports 2018, 28, 794–806. [CrossRef]
[PubMed]
32. Blazevich, A.J.; Cannavan, D.; Waugh, C.M.; Fath, F.; Miller, S.C.; Kay, A.D. Neuromuscular factors
influencing the maximum stretch limit of the human plantar flexors. J. Appl. Physiol. 2012, 113, 1446–1455.
[CrossRef] [PubMed]
33. Ema, R.; Wakahara, T.; Miyamoto, N.; Kanehisa, H.; Kawakami, Y. Inhomogeneous architectural changes of
the quadriceps femoris induced by resistance training. Eur. J. Appl. Physiol. 2013, 113, 2691–2703. [CrossRef]
[PubMed]
34. Lieber, R.L.; Friden, J. Functional and clinical significance of skeletal muscle architecture. Muscle Nerve 2000,
23, 1647–1666. [CrossRef]
35. De Monte, G.; Arampatzis, A.; Stogiannari, C.; Karamanidis, K. In vivo motion transmission in the inactive
gastrocnemius medialis muscle–tendon unit during ankle and knee joint rotation. J. Electromyogr. Kinesiol.
2006, 16, 413–422. [CrossRef]
36. Butterfield, T.A.; Best, T.M. Stretch-activated ion channel blockade attenuates adaptations to eccentric
exercise. Med. Sci. Sports Exerc. 2009, 41, 351–356. [CrossRef]
37. Jakobsen, J.R.; Jakobsen, N.R.; Mackey, A.L.; Koch, M.; Kjaer, M.; Krogsgaard, M.R. Remodeling of muscle
fibers approaching the human myotendinous junction. Scand. J. Med. Sci. Sports 2018, 28, 1859–1865.
[CrossRef]
© 2019 by the authors. Licensee MDPI, Basel, Switzerland. This article is an open access
article distributed under the terms and conditions of the Creative Commons Attribution
(CC BY) license (http://creativecommons.org/licenses/by/4.0/).You can also read