Genetic variation in early fitness traits across European populations of silver birch (Betula pendula) - Lib4RI
←
→
Page content transcription
If your browser does not render page correctly, please read the page content below
AoB PLANTS 2020, 1–13

                                                                                  doi:10.1093/aobpla/plaa019
                                                                                  Advance Access Publication May 25, 2020
                                                                                  Studies

Studies

                                                                                                                                                          Downloaded from https://academic.oup.com/aobpla/article/12/3/plaa019/5843671 by Lib4RI Empa user on 02 November 2020
Special Issue: The Ecology and Genetics of Population
Differentiation in Plants
Genetic variation in early fitness traits across European
populations of silver birch (Betula pendula)
Aida Solé-Medina1,2,*, Katrin Heer3, Lars Opgenoorth4,5, Phillip Kaldewey3,
Darius Danusevicius6, Eduardo Notivol7, Juan J. Robledo-Arnuncio1,† and
José A. Ramírez-Valiente1,†
1
 Department of Forest Ecology & Genetics, INIA-CIFOR, Ctra. de la Coruña km 7.5, 28040 Madrid, Spain, 2Escuela Internacional de
Doctorado, Universidad Rey Juan Carlos, C/ Tulipán s/n, 28933 Móstoles, Spain, 3Conservation Biology, Philipps Universität Marburg,
Karl‐von‐Frisch Strasse 8, 35043 Marburg, Germany, 4Department of Ecology, Philipps Universität Marburg, Karl-von-Frisch Strasse
8, 35043 Marburg, Germany, 5Biodiversity and Conservation Biology, Swiss Federal Research Institute WSL, Zürcherstrasse 111,
8903 Birmensdorf, Switzerland, 6Faculty of Forest Science and Ecology, Vytautas Magnus University, Studentų str. 11, LT-53361
Akademija, Kaunas, Lithuania, 7Unidad de Recursos Forestales, CITA, Avda. Montañana 930, 50059 Zaragoza, Spain
*Corresponding author’s e-mail address: aidasome@gmail.com
†
    Joint last authors.

Associate Editor: Xavier Picó

Citation: Solé-Medina A, Heer K, Opgenoorth L, Kaldewey P, Danusevicius D, Notivol E, Robledo-Arnuncio JJ, Ramírez-Valiente JA. 2020. Genetic variation
in early fitness traits across European populations of silver birch (Betula pendula). AoB PLANTS 12: plaa019; doi: 10.1093/aobpla/plaa019

Abstract
Given that the ecological niche of tree species is typically narrower for earlier life stages, intraspecific genetic variation at early
fitness traits may greatly influence the adaptive response of tree populations to changing environmental conditions. In this study,
we evaluated genetic variation in early fitness traits among 12 populations of Betula pendula from a wide latitudinal range in Europe
(41–55°N). We first conducted a chamber experiment to test for population differences in germination and the effect of pre-chilling
treatment on seed dormancy release. We then established three common gardens spread across the species latitudinal range in
order to evaluate levels of quantitative genetic variation and genotype-by-environment interaction at different early life traits. Our
results showed significant variation in chamber germination rates among populations (0–60 %), with southern populations exhibiting
lower germination. Pre-chilling treatments did not generally improve germination success. Population seedling emergence rates in
the field were correlated with chamber germination rates, though being an order of magnitude lower, with an average ranging from
0 to 1.3 % across gardens. Highly significant variation was found in field emergence rates among populations, and between seed-crop
years within populations, but not among families within populations. Populations differed in seedling height, diameter, slenderness
and budburst date, with significant among-family variation. Population latitude was positively associated with chamber germination
rate and with seedling emergence rate in one of the central field sites. Overall, genetic, environmental and demographic factors
seem to influence the observed high levels of variation in early fitness traits among B. pendula populations. Our results suggest
limited regeneration capacity for the study species under drier conditions, but further field trials with sufficient replication over
environments and seed crops will improve our understanding of its vulnerability to climate change.
Keywords: Early mortality; local adaptation; population differentiation; regeneration; seed germination; seed mass;
seedling emergence.


Received: 3 December 2019; Editorial decision: 11 May 2020; Accepted: 18 May 2020
© The Author(s) 2020. Published by Oxford University Press on behalf of the Annals of Botany Company.
This is an Open Access article distributed under the terms of the Creative Commons Attribution License (http://creativecommons.
org/licenses/by/4.0/), which permits unrestricted reuse, distribution, and reproduction in any medium, provided the original work is               1
properly cited.
2   |   AoB PLANTS, 2020, Vol. 12, No. 3

Introduction
Climate change models predict drier and warmer summers for             boreal tree species such as Betula alba (Sanz et al. 2011) and Pinus
Mediterranean regions in the next decades (Kovats et al. 2014).        sylvestris (Castro et al. 2004).
In Central Europe, increases in temperature and considerable               We expect that different selective pressures across the
contrasts in precipitation between dry and wet seasons are also        species range have resulted in adaptive genetic divergence
predicted (EEA 2012; Collins et al. 2013). These conditions will       across B. pendula populations (Savolainen et al. 2007). We
result in more severe hydrological and soil moisture droughts          hypothesize clinal, rather than abrupt, geographic genetic
in many areas, especially in summer months (Wong et al.                divergence among populations, given the continue distribution
2011; Samaniego et al. 2018). As a consequence, demographic            and high levels of gene flow in this species (Atkinson 1992;
dynamics and species distribution ranges might be considerably         Alberto et al. 2013). We expect differences in early fitness traits

                                                                                                                                              Downloaded from https://academic.oup.com/aobpla/article/12/3/plaa019/5843671 by Lib4RI Empa user on 02 November 2020
altered (Iverson et al. 2004; Dyderski et al. 2018). In the northern   among seed-crop years related with the great inter-annual
edge of the range, the increase in temperature is expected to          variation in reproduction investment in this species (Rousi
broaden the suitable habitat and distribution of many forest           et al. 2011; Gallego Zamorano et al. 2018). Differences among
tree species (Eggers et al. 2008; Nadeau and Urban 2019). On           populations in dormancy, germination, growth and phenology
the contrary, populations from the southern edge are expected          traits associated with latitudinal and altitudinal clines have
to suffer from size reductions and increased isolation, making         already been found in northern populations (e.g. Myking and
them particularly vulnerable to climatic changes (Jump et al.          Heide 1995; Viherä-Aarnio and Velling 2008; Midmore et al. 2015),
2006; Peñuelas et al. 2007).                                           but there is little information on range-wide genetic variation at
    There is a need to assess the levels of intraspecific genetic      early fitness traits assayed under natural conditions, especially
variation in fitness-related traits, and its environmental             for southern and mid-low latitude populations.
determinants, in order to evaluate the potential and the                   Our specific objectives were: (i) to explore whether B. pendula
drivers of adaptive evolution to climate change (Alberto et al.        exhibits among-population genetic variation at early life
2013). Adaptive evolution requires the existence of heritable          traits along a latitudinal gradient, (ii) to explore the potential
genetic variation at fitness-related traits within and among           geographic and environmental factors associated with the
populations, as it increases both the response to new selective        observed population genetic divergence, (iii) to determine
pressures and the frequency of potentially pre-adapted alleles         the extent to which the growing environment alters patterns
(Jump et al. 2009; Kremer et al. 2014). Common gardens have            of population variation at early life traits (i.e. genotype-by-
long been used to disentangle environmental and genetic                environment interaction) and (iv) to examine levels of within-
effects on phenotypic variability (Savolainen et al. 2007; White       population genetic variation at those traits.
et al. 2007; Alberto et al. 2013). However, most common garden
studies conducted under natural and semi-natural conditions
have focussed on juvenile and adult trees, established from            Materials and Methods
seedlings initially grown in optimal nursery conditions, thus
                                                                       Plant material
neglecting the impact of natural selective pressures during
early life stages (Gibson et al. 2016). The early stages of the life   Twelve natural populations of B. pendula were selected for the
cycle, and particularly the transition from seeds to seedlings,        study throughout the species distribution range in Europe (Fig. 1;
are crucial for the regeneration niche and have enormous               Table 1). Seeds were collected in the summers of 2016 and 2017
consequences on population dynamics (Jackson et al. 2009;              from 11–25 open-pollinated and randomly selected trees within
Donohue et al. 2010; Walck et al. 2011). Predictions on future         each population, separated at least 30 m apart. For populations
species distributions based exclusively on adult tree traits           ES2 and DE1, seed lots were obtained for both 2016 and 2017
could underestimate range contraction risks, given that                crops, which were used to explore variation in early fitness traits
the ecological niche is typically narrower in early life stages        among seed-crop years within populations (Table 1). Unless
(Jackson et al. 2009). Thus, improving our understanding on            specified otherwise, ES2 and DE1 refer to the seed crop from 2016.
intraspecific genetic variation in early fitness traits, such as       Seeds were stored at 4 °C in a dry environment until sowing.
dormancy, germination and seedling establishment rates, is
essential to elucidate the potential ability of tree populations
                                                                       Chamber experiment
to regenerate and persist under climate change.                        In winter 2018, we conducted a chamber experiment to (i)
    In this study, we examined the extent to which populations         obtain benchmark germination rates, (ii) assess the effect of
of Betula pendula, a widely distributed tree species in Europe,        moist-chilling on seed dormancy, germination rate and time
differed in early fitness traits under contrasting environmental       and (iii) examine whether populations responded differently to
conditions. This        wind-pollinated      and     wind-dispersed    its application. We established three treatments with different
broadleaved species has a continuous distribution across               chilling duration: 15 days (T1), 30 days (T2) and 45 days (T3) and
Central and Northern Europe (Atkinson 1992). It is also found          a control treatment, where seeds were not chilled (C). Chilling
in the Mediterranean Basin, where it is restricted to mountain         consisted of adjusting seeds to a moisture level of 33 % at
ranges (Beck et al. 2016). Seeds are dispersed in late summer-         4 °C in darkness, conditions that have been reported to break
autumn and stay dormant until spring, when conditions for              dormancy while avoiding seed germination and deterioration
germination and seedling establishment are more favourable             (De Atrip and O’Reilly 2007). Seed moisturizing was achieved
(Vanhatalo et al. 1996). Dormancy duration and the rates of            by adding distilled water on seeds placed in 1.5ml microtubes
germination and seedling survival are critical parameters in the       (Jones and Gosling 1994). After each chilling treatment, 150
regeneration process (Donohue et al. 2010). The main climatic          seeds per population (6–9 seeds per mother tree) were placed
factors limiting the species recruitment are low temperatures          in three different Petri dishes (i.e. 50 seeds per population per
in northern Europe (Holm 1994a, b) and summer drought in               block) with moistened filter paper inside. Population GB1 was
southern regions, similarly to other European temperate and            only essayed in the C treatment due to limited seed availability.
Solé-Medina et al. – Genetic variation in early fitness traits in Betula pendula | 3
Downloaded from https://academic.oup.com/aobpla/article/12/3/plaa019/5843671 by Lib4RI Empa user on 02 November 2020
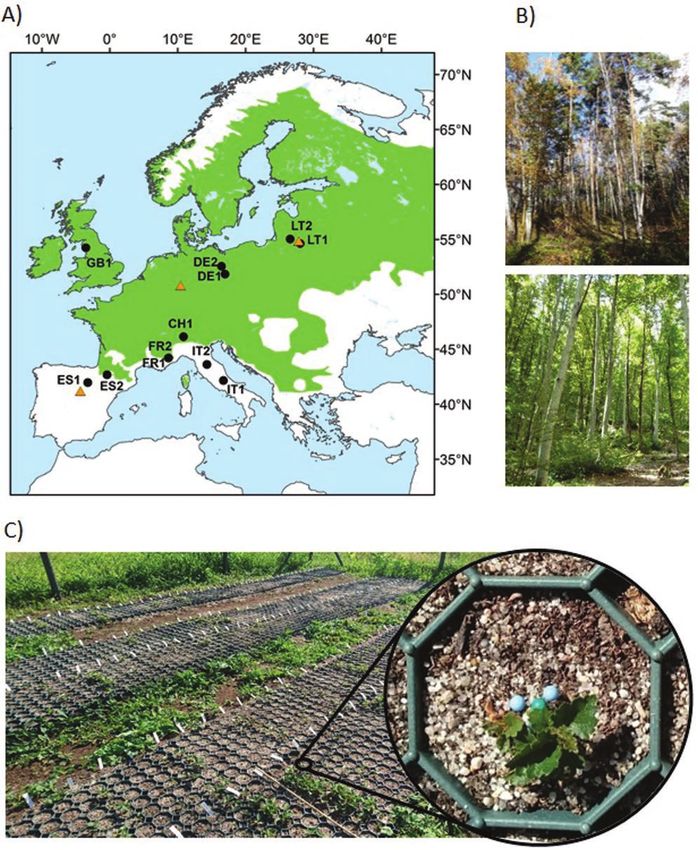
Figure 1. (A) Location of sampled Betula pendula populations with available seeds (black circles) and the sites of the common garden trials (orange triangles). The green
area indicates the species distribution range (EUFORGEN 2009). (B) Natural B. pendula populations DE1 (top) and IT1 (bottom). (C) German garden and zoom-in of a cell
with seedlings.
Petri dishes were placed in the chamber following a randomized where ni is the number of seeds germinated at the ith
block design. Temperature was set at 15 ± 2 °C, to simulate observation date; ti, the number of days since the beginning of
approximate soil temperatures in the field, and photoperiod to the experiment to the ith date; and k the total number of dates
24 h light. Petri dishes were moistened periodically with distilled of observation (Ranal and Santana 2006).
water. Germination was monitored three times per week until
the end of the experiment (45 days after sowing). Common garden trials
We calculated germination percentage per Petri dish, and Experimental design. In spring 2018, three common garden
mean germination time in days (MGT) as: experiments were established across the latitudinal range of
k B. pendula in Europe in Cerezo de Arriba, Spain (41°11′49.8″N,
n i ti
MGT = i=1 3°31′17.4″W), Marburg, Germany (50°48′03.6″N, 8°48′24.8″E)
k
i=1 ni and Šlienava, Lithuania (54°51′18.6″N, 24°03′02.9″E) (Fig. 1).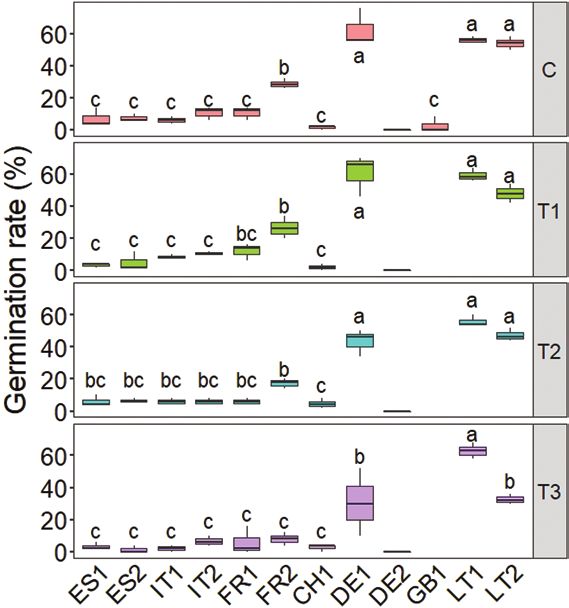
4    |   AoB PLANTS, 2020, Vol. 12, No. 3

The Spanish site was located in the species southern limit,                three populations were selected based on their proximity
at 1319 m.a.s.l. (metres above sea level), characterized by a              (geographically and climatically) to the corresponding common
temperate oceanic submediterranean climate (Rivas-Martínez                 garden sites. Seeds from different mother trees were pooled
et al. 2004) (Table 2). The other two sites were located in the centre     within each of the remaining seed lots before sowing. Fifty-
of the species distribution range, at 325 m.a.s.l. in Germany and          five out of the 85 experimental units per block corresponded
70 m.a.s.l. in Lithuania, representing temperate oceanic climate           to maternal families of the populations with family structure
and temperate continental climate, respectively (Rivas-Martínez            (1 experimental unit per family per block). The remaining
et al. 2004) (Table 2).                                                    30 units in each block corresponded to populations without
    In each garden, we established 255 experimental units                  family structure (3 experimental units per population per
distributed in three blocks (85 experimental units per block). Each        block). Experimental units were randomized following a 51 ×
experimental unit consisted of 16 cells of 30 cm2 each, delimited          5 latinized row-column design, using CycDesigN software

                                                                                                                                                     Downloaded from https://academic.oup.com/aobpla/article/12/3/plaa019/5843671 by Lib4RI Empa user on 02 November 2020
with plastic ground-grids that were open in the bottom and                 (Whitaker et al. 2002).
lateral walls (Guttagarden®). Grids were filled with a mixture
of 50 % fine sand and 50 % peat to homogenize superficial soil             Seed mass, preparation and sowing. We measured average
conditions across gardens. Seeds from population DE2 were not              seed mass per population and per maternal family in the
included in the design because they did not germinate in the               populations without and with family structure, respectively.
chamber (see Results and Table 1). The final design comprised              We used between 0.04 and 0.06 g of seeds per population or
11 different populations, plus the second-year (2017) seed                 maternal family for this estimation (ISTA 2007). Since chilling
lots of populations DE1 and ES2. The family structure (i.e. the            treatments had a negative impact on both germination rate and
maternal identity) was maintained in the 2016 seed lots from               time (see Results), seeds used for the common gardens were
ES2 (Spain), DE1 (Germany) and LT2 (Lithuania) (Table 1). These            not chilled. Betula pendula typically exhibits high proportions

Table 1. Population code, country, latitude, longitude, altitude, annual mean temperature (AMT) and annual precipitacion (AP) of the studied
Betula pendula populations. Next columns represent the number of experimental units used for the analyses of germination rate in chamber
(GR), emergence rate (ER) in Spain and Germany and survival, as well as the number of seedlings for the analysis of growth and phenology traits.
See Materials and Methods for more details. Climatic data for the period 1979–2013 obtained from CHELSA (Karger et al. 2017). aPopulations with
two seed crops available (2016 and 2017) for the analysis of temporal variation. bPopulations with maternal family structure for the analysis of
intrapopulation genetic variation. cPopulations assayed only in control treatment in the chamber experiment.

                                                           Altitude      AMT       AP
Population      Country         Latitude      Longitude    (m)           (°C)      (mm)     GR    ER        Survival          Growth   Phenology

ES1             Spain           41°58′N       2°37′W       1271          8.8        531     12       18        5
ES2             Spain           42°40′N       0°19′W        988          9.1       1001     12a    120a,b     26a,b            29       29
IT1             Italy           42°09′N       13°37′E      1498          6.9        963     12       18        7
IT2             Italy           43°36′N       11°42′E      1084          8.9       1134     12       18        8
FR1             France          44°11′N       7°04′E       1128          6.8        799     12       18        2
FR2             France          44°12′N       7°05′E       1519          5.1        920     12       18        9               20       18
CH1             Switzerland     46°08′N       8°59′E       1089          8         1815     12       18        2
DE1             Germany         51°50′N       14°26′E        72          9.6        573     12a     90a,b     33b             127b     135b
DE2             Germany         52°32′N       14°3′E         55          9.3        532     12
GB1             UK              54°13′N       3°01′W         31          9.8       1105      3c      18        8
LT1             Lithuania       54°37′N       24°13′E       118          7          661     12       18        9               53       60
LT2             Lithuania       55°01′N       23°0′E         56          7.4        669     12      120b      52b             212b     231b

Table 2. Monthly precipitation (Pp, in mm) and monthly mean, maximum and minimum temperatures (Tmean, Tmax, Tmin, in °C) during 3 months
after sowing at the three common garden sites. Values correspond to averages for the reference period 1970–2000 obtained from WorldClim
(Hijmans et al. 2005), and to records for the study year (2018). NA: no available data. aData available from 15 May.

                                       May                                      June                                   July

                                       Reference             2018               Reference           2018               Reference              2018

Lithuania             Pp               49                    19                 68                  58                 79                     138
                      Tmean            12.4                  16.9               15.7                17.3               17.1                   20.7
                      Tmax             18.0                  23.1               21.3                23.4               19.4                   25.4
                      Tmin             6.8                   10.8               10.1                11.3               14.9                   13.8
Germany               Pp               67                    36.2a              69                  19.6               67                     243
                      Tmean            12.4                  17.5a              15.4                17.9               17.2                   21.3
                      Tmax             17.1                  23.8a              20.1                23.8               19.7                   28.6
                      Tmin             7.7                   12.2a              10.6                12.8               14.7                   14.2
Spain                 Pp               68                    NA                 45                  65                 21                     2
                      Tmean            10.3                  NA                 15.1                16.0               18.9                   18.8
                      Tmax             16.4                  NA                 21.2                19.9               23.3                   23.9
                      Tmin             4.2                   NA                 9.0                 12.0               14.6                   13.7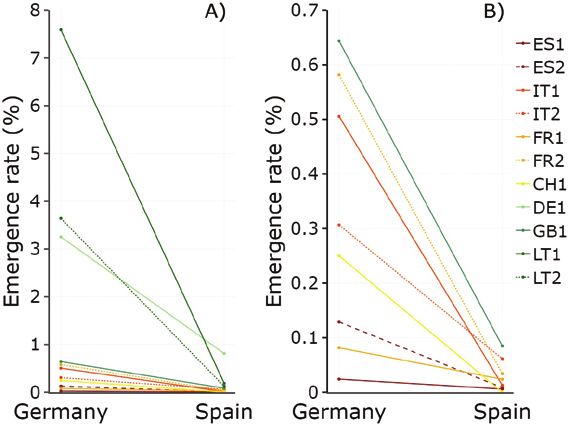
Solé-Medina et al. – Genetic variation in early fitness traits in Betula pendula     |   5

of unviable (empty) seeds, with substantial variation among            survival rate. This distribution is a mixture of a discrete value
populations (e.g. 30–70 % in Midmore et al. 2015). Reliably            0 with probability p0 and a beta distribution fw ~ Beta(µ, σ) on
separating full and empty Betula seeds is a very time-consuming        the unit interval (0, 1) with probability (1 − p0). The probability
process, unfeasible for the large amounts used in this study. So,      density function of the mixture is thus given by Equation 1:
aiming to obtain a sufficient and balanced number of emerged                                      ®
                                                                                                    p0                     if y = 0
seedlings across populations in the field while controlling for                  fy (y|µ, σ, ν) =
                                                                                                    (1 − p0 )fw (y | µ, σ) if 0 < y < 1
the effect on emergence rates of potential variation in empty
seed proportions, we adjusted the number of seeds sown per             In the case of the emergence rate, the mean µ of the beta
population or maternal family in the common gardens. Based             distribution is the estimated mean emergence rate given that
on benchmark chamber germination rates (influenced by the              emergence is not zero (which in our experimental setting
presumably variable proportion of empty seeds in the lots), we         can be interpreted as the mean emergence rate across cells

                                                                                                                                               Downloaded from https://academic.oup.com/aobpla/article/12/3/plaa019/5843671 by Lib4RI Empa user on 02 November 2020
estimated the number of seeds per cell needed to expect at least       showing some emergence), σ is the scale parameter of the beta
one germinated seed with 95 % probability for each population          distribution and ν yields the probability p0 that the emergence
in each cell, and multiplied this number by a safety factor of         rate is zero as p0 = ν/(1 + ν) (which in turn can be interpreted here
25, considering that field emergence rates might be lower than         as the estimated proportion of experimental cells not showing
baseline chamber rates. For maternal families from ES2, DE1 and        any emergence at all). Analogously for the survival rate, μ is the
LT2, we used the averaged population germination rate for these        estimated proportion of surviving seedlings given that survival
estimates. Seeds were sown in spring 2018 and were watered             is not zero (which can be regarded here as the mean survival
three times per week for 1 month.                                      rate across cells with some survival), σ is the scale parameter
                                                                       and ν yields the probability of zero survival as p0 = ν/(1 + ν) (i.e.
Field measurements and fitness estimates. Emergence and survival       the estimated proportion of cells where all emerged seedlings
were monitored three times per week the first month after              died). We tested for differences among populations, gardens and
sowing, every 1–2 weeks the second month and once per month            their interaction in emergence and survival rates by modelling
until November 2018. Each day of measurement, we counted               μ and ν parameters. We only modelled the intercept for σ
the number of seedlings per cell and considered emergence and          parameter, as otherwise convergence was not reached. Models
mortality when the number of seedlings increased or decreased          included population, garden and population-by-garden as
since the last day of measurement, respectively.                       fixed-effect factors, and block and column both nested within
                                                                       garden as random-effect factors. The resulting models were
Growth and phenology traits. At the end of the first growing           compared using likelihood-ratio tests. To test for differences
season (November 2018), height and diameter of the surviving           in emergence and survival between seed-crop years of ES2 and
seedlings were measured. We also calculated the slenderness            DE1, we performed one GAMLSS for each of the two populations
index, a metric of mechanical stability, as height/diameter. At the    including seed-crop year, common garden and their interaction
beginning of the following growing season (mid-May 2019), bud          as fixed-effect factors, and the same random structure as before.
burst was scored every 1–2 days in one seedling per cell when          Generalized additive models for emergence rate of the three
leaf tips were clearly above bud scales (Finn et al. 2007). Growth     populations with family structure were analysed separately,
and phenology were only measured in the German garden,                 with population, garden and population-by-garden as fixed-
because of null emergence and null survival in the Lithuanian          effect factors, and block nested within garden and family nested
and Spanish sites, respectively. Consequently, garden-by-              within population as random-effect factors. Linear models were
population or garden-by-family interactions were only tested           used to test the associations between observed emergence
for emergence rates but not for growth or for phenology traits         rates, estimated μ and p0 in the common gardens and observed
(see also Statistical analyses).                                       chamber germination rates. Linear models were also used
                                                                       to examine associations between observed emergence and
Statistical analyses                                                   survival rates. Mean germination time was not analysed in field
Chamber experiment. Binomial mixed effects models with logit           conditions since the number of emerged seedlings was very low,
link function and lineal mixed effect models were used to test for     which affects the interpretation of this parameter (Ranal and
differences in germination rate (GR) and in mean germination           Santana 2006).
time (MGT) among populations and chilling treatments.                      Linear mixed models were used for the analyses of growth
Population, treatment and their interaction were included              and phenology traits in the five populations with >25 seedlings
as fixed-effect factors and block as a random-effect factor.           alive. Population was included as a fixed-effect factor, and
Analogous models were implemented to test for differences              block, column and row as random-effect factors. To avoid the
in GR and MGT between seed-crop years for ES2 and DE1, with            effect of competition, only cells with less than five seedlings
seed-crop year and treatment as fixed-effect factors.                  were used for the analyses of the growth traits. Comparisons
                                                                       of population means were assessed using Tukey post hoc tests.
Common gardens. Both the seedling emergence and survival               Finally, we also used linear mixed models to analyse growth and
rates in the common garden sites were averaged per                     phenology traits in populations with family structure. All terms
experimental unit (grid of 16 cells) for the analyses. Survival        were included as random-effect factors to study their effects on
was measured relative to the number of emerged seedlings.              the variance.
Emergence was low overall and both fitness components                      The association between trait population means and
presented an overdispersed zero-inflated distribution, with            geographic and environmental variables of the seed provenances
many empty cells and most seedlings emerging (and surviving)           was tested using multiple regression. Betula pendula is only
in small clumps. We, therefore, used generalized additive              present in high altitudes in the southern areas and in mid-low
models (GAMLSS) with a zero-inflated beta distribution                 altitudes in northern populations. Consequently, latitude and
(BEINF0) for the analyses of both the emergence and the                altitude were strongly negatively correlated (r = −0.93, P < 0.001).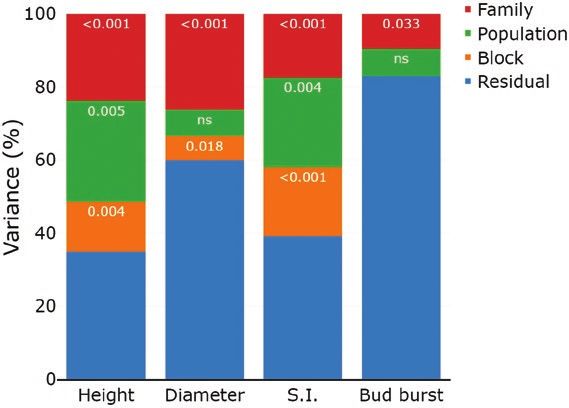
6   |   AoB PLANTS, 2020, Vol. 12, No. 3

Longitude and latitude were also marginally correlated (r = 0.55,
P = 0.054). To avoid multicollinearity, we only included latitude
in the multiple regression, as it better represents the geographic
structure of the sampled populations. We also included two
climatic variables in the multiple regression: mean annual
temperature and annual precipitation for the period 1979–2013
obtained from CHELSA (Karger et al. 2017). We used linear
regressions to test the associations between population trait
means and seed mass. A step forward-backward selection was
performed. Association among traits was tested using Pearson
correlations.

                                                                                                                                                        Downloaded from https://academic.oup.com/aobpla/article/12/3/plaa019/5843671 by Lib4RI Empa user on 02 November 2020
    All analyses were conducted using R 2.3.5 (R Core Team 2014).
We used the packages ‘lme4’ (Bates et al. 2015) for mixed models,
‘emmeans’ (Lenth et al. 2019) for post hoc tests, ‘Hmisc’ (Harrell
2019) for correlation analyses, ‘gamlss’ (Rigby and Stasinopoulos
2005) for the analyses of traits with zero-inflated distributions
(germination and survival), and ‘ggplot2’ (Wickham 2016) and
‘plotly’ (Plotly Technologies Inc. 2005) for graphic representation
of the results.

Results
Seed germination in the chamber experiment
Mixed models revealed significant differences among chilling
                                                                      Figure 2. Germination rates for 14 Betula pendula populations in controlled
treatments in both germination rate (GR) and mean germination
                                                                      chamber conditions under four treatments: a control without pre-chilling (C)
time (MGT) [see Supporting Information—Table S1]. On average,
                                                                      and pre-chilling treatments with a duration of 15 days (T1), 30 days (T2) and
C and T1 treatments resulted in higher GR (mean 17.4 ±                45 days (T3). Population GB1 was only tested in the control treatment (C) due
standard error 1.50 % and 16.6 ± 1.45 %, respectively) than T2        to low seed availability. Means that do not share letters indicate significant
(12.9 ± 1.21 %) and T3 (8.6 ± 0.9 %). In addition, C and T1 seeds     differences among populations within treatments (P < 0.05, Tukey test). Boxes
had shorter MGT (13.3 ± 1.23 and 13.7 ± 1.27 days, respectively)      show the median (inside line), the interquartile range (hinges are the 25th and
                                                                      75th percentiles) and 1.5 times the interquartile range (whiskers). Populations
compared to T2 and T3 pre-chilled seeds (16.7 ± 1.54 and 14.7 ±
                                                                      are ordered by latitude (codes as in Table 1).
1.39 days, respectively) (data not shown). There were also
significant population differences in both traits, and population-
by-treatment interaction in GR [see Supporting Information—           garden and between 0.20 % (for ES1) and 0.95 % (for DE1) in the
Table S1]. Populations LT1, LT2 and DE1 had the highest GR in         Spanish garden [see Supporting Information—Table S4]. In the
all treatments, whereas most of the other populations exhibited       German garden, the estimated probability of zero emergence, p0
very low values (Fig. 2). Population DE2 did not germinate            (calculated using ν in Equation 1) ranged between 77.8 % for FR1
in any treatment (Fig. 2). Significant differences in GR among        and CH1 and 0.0 % for FR2 and LT1, indicating that all cells in the
2016 and 2017 seed crops were found for population DE1 (1.1 %         experiment for the two latter populations had some emergence
in 2017 versus 49.1 % in 2016) but not for ES2 [see Supporting        [see Supporting Information—Table S4]. In the Spanish garden,
Information—Table S2]. Population LT1 had the shortest MGT            p0 ranged between 100 % (i.e. all cells had zero emergence) for
(10.3 ± 1.1 days), whereas ES1 and CH1 had the longest MGT            CH1, and 33 % for IT2, FR1, GB1 and LT1, indicating that these
(19.9 ± 2.02 and 20.4 ± 2.18 days, respectively) (data not shown).    four populations exhibited some emergence in two-thirds of
GR and MGT were not correlated (P = 0.201).                           the experimental cells [see Supporting Information—Table S4].
                                                                      There were correlations between observed population seed
Seedling emergence in the field                                       germination rates in the chamber and observed population
No seedling emergence was observed in the Lithuanian site,            seedling emergence rates, correlations that were significant
whereas a total of 383 and 4554 seedlings emerged in the Spanish      at the German garden (r = 0.91, P < 0.001) and marginally
and German gardens, respectively, which represent 0.1 % and           significant in the Spanish garden (r = 0.63, P = 0.050). There was
1.3 % of the estimated seeds sown in each of the two sites. In        no correlation between observed population emergence rates in
the two common gardens with emergence, three populations              the two common gardens (r = 0.43, P = 0.213).
(LT1, LT2 and DE1) showed emergence rates that were an order              Generalized additive models revealed significant differences
of magnitude higher than those of the rest (Fig. 3).                  in emergence rates between the two different seed-crop years
    Generalized additive models showed significant differences        of the DE1 population in the German garden, both in μ and ν
among gardens for emergence rate in both μ and ν parameters           [see Supporting Information—Table S5], ranging between 3.25 %
[see Supporting Information—Table S3]. There were also                and 0.01 % for the 2016 and 2017 seed crops, respectively. In
significant differences among populations in both μ and ν for         the Spanish garden, the null emergence of the seed crop from
seedling emergence, as well as significant population-by-garden       2017 of DE1 contrasted with the relatively high emergence rate
interaction in ν, but not in μ [see Supporting Information—Table      found for seed crop 2016 (0.95 %). No significant differences in
S3]. The μ parameter, which represents the estimated seedling         emergence were found between the seed-crop years of ES2 in
emergence rate across experimental cells with some emergence,         any of the two gardens [see Supporting Information—Table S5].
ranged between 0.82 % (for ES1) and 7.15 % (for LT1) in the German    Generalized additive models performed on populations with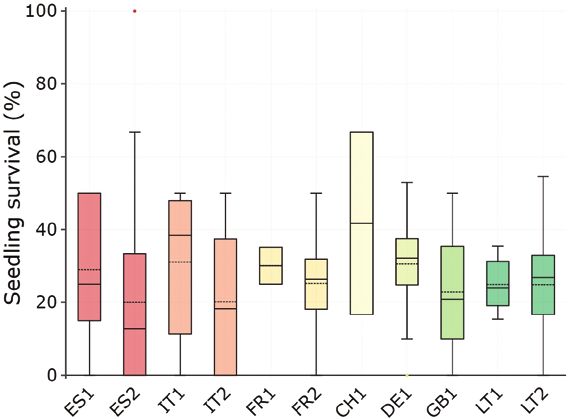
Solé-Medina et al. – Genetic variation in early fitness traits in Betula pendula       |       7

family structure for emergence rates did not reveal significant                  variation in the estimated proportion of cells without survival
family effects for ν or μ (Table 3), whereas differences among                   (p0, calculated from ν), though not in the estimated survival rate
populations were significant for both parameters (Table 3).                      for cells exhibiting seedlings alive at the end of the experiment.
                                                                                 Observed seedling emergence and seedling survival probability
Seedling survival in the field                                                   were not correlated (r = −0.12, P = 0.723), i.e. seeds that tended to
All seedlings that emerged in the Spanish garden died before                     germinate more did not tend to produce more viable seedlings.
the end of the experiment. By contrast, 1274 seedlings (29 % of                  The proportion of sown seeds resulting in alive seedlings at the
emerged seedlings) survived in the German garden. Observed                       end of the experiment was mostly determined by the emergence
seedling survival rates varied from 20 % to 42 % for ES2 and                     rate (r = 0.99, P < 0.001).
CH1, respectively (Fig. 4). Differences among populations were                        The highest and lowest survival rates corresponded to both
significant for the ν parameter but not for μ [see Supporting                    seed crops from ES2 (2016: 20 % and 2017: 43.7 %), although

                                                                                                                                                           Downloaded from https://academic.oup.com/aobpla/article/12/3/plaa019/5843671 by Lib4RI Empa user on 02 November 2020
Information—Table S6], indicating significant population                         GAMLSS did not show significant differences among them in μ
                                                                                 or ν [see Supporting Information—Table S5]. Seedlings from the
                                                                                 2017 seed crop of DE1 did not survive in the German garden,
                                                                                 precluding testing for differences between seed crops for this
                                                                                 population.
                                                                                      Seedling survival rate GAMLSS performed on populations
                                                                                 with family structure did not show a significant family effect
                                                                                 in μ or ν, whereas a highly significant population effect was
                                                                                 observed for ν (Table 3).

                                                                                 Field growth and phenology traits
                                                                                 There were only five populations with >25 seedlings alive
                                                                                 to conduct mixed models for growth and phenology traits
                                                                                 (see Table 1). Results showed significant differences among
                                                                                 populations in height, diameter, slenderness and the day of
                                                                                 bud burst (see Supporting Information—Table S7; Fig. 5). Height
                                                                                 was strongly correlated with diameter (r = 0.97, P = 0.005) and
                                                                                 slenderness (r = 0.94, P = 0.015). No significant correlation was
                                                                                 found between diameter and slenderness (r = 0.85, P = 0.067).
                                                                                 Correlations between bud burst and growth traits were not
                                                                                 significant.
Figure 3. Population means (dots) and reaction norms (lines) for seedling
                                                                                    Analyses for growth and phenology traits at the family level
emergence rates of the studied populations of Betula pendula in two common
gardens in Germany and Spain. Panel (A) shows all studied populations in both    were only conducted for populations LT2 and DE1, as population
common gardens. Panel (B) displays the zoom-in of populations with emergence     ES2 had a very low number of seedlings (none of the families
rates below 1 %. Population codes as in Table 1. Standard errors are not shown   had >6 seedlings alive and more than half of the families had
for clarity.                                                                     between 0–2 seedlings). Mixed models for height and slenderness

Table 3. Results of the GAMLSS for Betula pendula populations with family structure (ES2, DE1, LT2) for seedling emergence rate in the Spanish
and German gardens and for seedling survival rate in the German garden. μ1 is the estimated proportion of emerged seedlings in cells with
some emergence and ν1 yields the probability of no emergence (p0), as p0 = ν/(1 + ν) (i.e. the estimated proportion of cells without any emergence);
μ2 is the estimated proportion of surviving seedlings in cells where survival is not zero and ν2 yields the probability of no survival (p0), as p0 = ν/
(1 + ν) (i.e. the estimated proportion of cells where all emerged seedlings died). LRT: likelihood-ratio test, df: degrees of freedom. Significant
values are in bold type (P < 0.05).

Trait                                Parameter                     Factor                             df                 LRT                      P

Emergence rate                       μ1                            Residual                           313
                                                                   Garden                               1                11.02
8 | AoB PLANTS, 2020, Vol. 12, No. 3
showed significant family and population effects that explained significant, although this effect explained 40 % of the variance (Fig. 6). Mixed models for diameter No significant differences among populations were found for this
showed a significant family effect that explained 26.3 % of the trait (Fig. 6).
variance, while the population effect was not significant (Fig. 6).
For the date of bud burst, differences among families were Climatic and geographic patterns
Multiple regression analyses showed a significant positive
association between latitude and chamber germination rate, and
between latitude and field seedling emergence rate at the German
garden (Fig. 7A and B). A significant positive association between
latitude and μ (i.e. the mean seedling emergence rate across cells
with some emergence) was found in both the Spanish and German
Downloaded from https://academic.oup.com/aobpla/article/12/3/plaa019/5843671 by Lib4RI Empa user on 02 November 2020
common gardens (Fig. 7C and D). No significant associations
with climatic or geographic variables were found for seed mass,
emergence rate in Spain, probability of no germination (p0) in any
of the gardens or seedling survival in Germany (which was only
measured there). Associations between growth traits and climate
variables were not significant, although marginally significant
negative relationships were found between latitude and height,
diameter and slenderness (Fig. 7E–G). No association was found
between date to bud burst measured in the common garden
and latitude. In contrast, the date to bud burst was negatively
correlated with the annual mean temperature at the population
of origin (Fig. 7H). Linear regressions also showed significant
positive associations between seed mass and germination rates
in chamber [see Supporting Information—Fig. S1a] and between
Figure 4. Observed seedling survival rate after the first growing season for Betula
pendula populations in a common garden experiment in Germany. Generalized
seed mass and emergence rates in both the Spanish and German
additive models showed differences among populations in ν (P = 0.010) but not in gardens [see Supporting Information—Fig. S1b], but not between
μ (P = 0.171), indicating that populations differed in the estimated proportion of seed mass and growth or phenology traits (data not shown).
cells without survival (p0), but not in the estimated proportion of cells with at least
one seedling alive at the end of the experiment [see Supporting Information—
Table S6]. Boxes show the median (inside solid line), the mean (inside dashed
Discussion
line), the interquartile range (hinges are the 25th and 75th percentiles), 1.5 times
the interquartile range (whiskers) and outliers (dots). Population codes as in The present paper investigated genetic variation at early fitness
Table 1. Populations are ordered by latitude, colours as in Fig. 3. traits among and within B. pendula populations spread over a
Figure 5. Means and standard errors for height, diameter, slenderness and bud burst measured in seedlings of Betula pendula populations growing in the German
common garden experiment. Only populations with >25 seedlings still alive in spring 2019 were used. Populations are ordered by latitude. Values that do not share
letters are significantly different (P < 0.05, Tukey test). Population codes as in Table 1. Population colours as in Figs 3 and 4.Solé-Medina et al. – Genetic variation in early fitness traits in Betula pendula | 9
Other factors could have been also important in the observed
germination patterns. Specifically, B. pendula is a masting species
with wide annual variation in the quantity and quality of seed
crops (Atkinson 1992). In our study, differences in germination
between seed crops from 2016 versus 2017 were strikingly high
for population DE1, suggesting that investment in reproduction
and environmental factors could influence the proportion
of viable seeds. Finally, it is worth noting that dormancy is
a typical characteristic of birch seeds (Myking and Heide
1995). Differences in germination among populations could
have also resulted from differences in dormancy duration or
Downloaded from https://academic.oup.com/aobpla/article/12/3/plaa019/5843671 by Lib4RI Empa user on 02 November 2020
different environmental requirements to break their dormancy.
For instance, Midmore et al. (2015) showed that populations
of B. pendula from higher latitudes were more sensitive to
pre-chilling compared to populations from lower latitudes,
particularly under colder temperatures. In our study, in contrast,
germination rates were largely unaffected by pre-chilling. These
Figure 6. Percentage of phenotypic variance of early growth and phenology results, together with the similar patterns of emergence rates
traits (height, diameter, slenderness index: SI and bud burst) explained by observed in field conditions (see next section), suggest that
mixed model factors block, population and maternal family within populations
potential differences in dormancy among populations are
in Betula pendula common gardens. The numbers inside the bars are P-values of
the effects, ns indicates a non-significant effect. There was no block variance
unlikely to be major determinants of observed variation in
for bud burst. population germination rates.
Emergence and survival rates in the
large portion of the distribution range of the species, including common gardens
southern margins. By performing chamber experiments under Three populations located in the centre of the species
controlled conditions and common gardens trials at three semi- distribution area had emergence rates an order of magnitude
natural sites across a climatic gradient, we detected strong higher than those of the rest (Fig. 3). Demographic,
population variation in germination and emergence rates as environmental and genetic factors are expected to have shaped
well as in growth and phenology traits throughout the first year population patterns of emergence rates in the field, as discussed
of the life cycle. for germination rates. Field emergence, however, was strikingly
lower than chamber germination in all populations. This is
Germination rate in the chamber experiment
consistent with Tylkowski (2012), who found that B. pendula
Germination is one of the most drastic transitions, and earliest seedling emergence rates from seeds sown in containers were
fitness components, in plant life cycles (Donohue et al. 2010). In lower than the corresponding germination rates in chamber.
our chamber experiment, germination rates were generally low, We expected the Lithuanian site to be the most suitable for
but with substantial differences among populations (Fig. 2). Three B. pendula according to climate niche models (Beck et al. 2016).
populations exhibited germination rates above 50 %, whereas However, null seedling emergence was found in Lithuania.
9 out of 12 populations had germination rates below 10 % in Since seeds of this species require a continuously moisturized
all pre-chilling treatments (Fig. 2). Differences in germination seedbed for germination (Gordon 1992), the exceptionally
rates among populations of B. pendula have been previously warm and dry 2018 spring in Lithuania probably minimized
reported, even at smaller geographical scales (Holm 1994a). germination and precluded any seedling emergence in this
Similar to our results, Midmore et al. (2015) predicted markedly site, despite the initial watering. These results suggest that
high differences in germination rates among populations, extreme climatic events can hamper natural regeneration even
ranging between 0 and 100 % among populations from 47°N to in the central core of the distribution of B. pendula, and that
60°N. Similar patterns of population-level variation have been seedling establishment is a phase very sensitive to climatic
found in other Betula species (e.g. Bevington 1986; Reyes et al. conditions (Rousi et al. 2011). The very low emergence rate
1997). Differences in germination rates among populations and the subsequent total seedling mortality observed for all
could have resulted from different proportions of filled seeds, provenances at the Spanish site might also have resulted
which is supported by the strong positive correlation between from the dry conditions during spring and summer. This
seed mass and germination rates [see Supporting Information— site is located in the southern edge of the species, in an
Fig. S1]. Midmore et al. (2015) showed that, on average, southern area characterized by a mountainous Mediterranean climate
populations had a higher percentage of empty seeds (~77 %) than where summer storms play an important role in long-term
northern populations (~28 %). Southern B. pendula populations regeneration of temperate species. Rainfall in spring of 2018
are generally more isolated, have smaller size, lower density and was higher than average in the area, but rains were irregular,
lower levels of genetic variation, which could have limited ovule with short dry and hot intermediate periods during which soil
fertilization rates because of more irregular pollen availability moisture was considerably reduced. Moreover, the summer
and/or inbreeding depression (Holm 1994a; Palmé et al. 2003). In was much drier than average (Table 2). These results suggest
addition, resource scarcity and warm and dry conditions during that drought strongly limits seedling emergence and survival
seed maturation could have resulted in smaller, less vigorous of B. pendula, and therefore that drier conditions expected in
embryos in southern populations. In all, lower germination the southern edge of the species range in the next decades will
rates in southern populations appear to be greatly determined hinder natural regeneration in this area (Humphries et al. 1982;
by demographic and environmental factors. Hynynen et al. 2010; Beck et al. 2016; Pliūra et al. 2019).10 | AoB PLANTS, 2020, Vol. 12, No. 3
Downloaded from https://academic.oup.com/aobpla/article/12/3/plaa019/5843671 by Lib4RI Empa user on 02 November 2020
Figure 7. Linear regressions between the latitude of Betula pendula populations and (A) population chamber germination rate, GR; (B) seedling emergence rate, ER, in
the German site; (C) the estimated proportion of emerged seedlings in cells with some emergence (μ) in the Spanish site; (D) μ in the German site; (E) seedling height;
(F) seedling diameter; and (G) seedling slenderness. Panel (H) shows the linear regression between annual mean temperature of the populations and bud burst date.
Dots represent population means. Grey shaded areas indicate 95 % confidence intervals. Emergence rate in Spain was not significantly associated with any geographic
or climatic variable (not shown). Growth and phenology traits (height, diameter, slenderness and bud burst) were only tested in the German garden. Standard errors
of population trait means are not shown for clarity.
Climatic conditions in the German site seemed more those observed in Spain and Lithuania. The German garden was
favourable, even if seedlings were exposed to low precipitation in addition the only of the three gardens where some seedlings
that originated some soil water deficit in mid-summer. Emergence survived until the end of the experiment. The comparatively
rates in Germany did not reach the seed germination rates high survival rate of emerged seedlings (28 %) relative to the
observed in the chamber, but still were significantly higher than low emergence rate (1.3 %) suggests that selection pressures atSolé-Medina et al. – Genetic variation in early fitness traits in Betula pendula | 11
early life stages in B. pendula are particularly strong during the Heinonen 2007; Baliuckas and Pliūra 2008). We also found differences
seed-to-seedling transition. Furthermore, the lack of significant among families within populations in early growth traits and in
population differentiation in seedling survival rates among the timing of bud burst, with the family effect explaining between
populations within experimental sites suggests, in accordance 9 and 25 % of the total phenotypic variance for these traits. The
with van Andel (1998), that the effect of environmental conditions variance explained by the family effect was indeed larger than that
on early seedling mortality substantially exceeds the one of the of the population effect for diameter and bud burst. These results
genetic background. These results highlight the importance of align with those of previous studies suggesting that intrapopulation
including the germination (and not only the seedling/sapling) genetic variance in B. pendula growth and phenology traits is an
stage in field trials conducted to assess adaptive genetic variation important component of the intraspecific genetic diversity in this
and to identify the life stages that represent the major bottlenecks species. However, the substantial levels of genetic variance in bud
for recruitment (Walck et al. 2011). burst reported within B. pendula populations might be insufficient
Downloaded from https://academic.oup.com/aobpla/article/12/3/plaa019/5843671 by Lib4RI Empa user on 02 November 2020
to enable fast enough adaptation to the expected rate of change
Growth and phenology traits in temperature (Billington and Pelham 1991; Possen et al. 2014).
Our results showed population differences in growth and On the other hand, we failed to detect significant variation in the
phenology traits. Growth in height and diameter tended to be rates of seedling emergence and survival among families within
higher in populations from lower latitudes (Fig. 7E–G). Previous populations (Fig. 4). One possible reason for this negative result
studies have also reported negative latitudinal clines in growth is that the low germination rates resulted in low statistical power
traits in B. pendula at smaller spatial scales (Velling 1979; Myking for the analysis of intrapopulation genetic variation. Another
and Heide 1995; Viherä-Aarnio and Velling 2008). This latitudinal possible explanation is that the environmental conditions might
pattern could reflect local adaptation to differences in the have imposed a very strong selective pressure (reflected by the low
length of the growing period. Viherä-Aarnio et al. (2005) found emergence rates), thus reducing the expression of intrapopulation
that, under a common environment, southern populations genetic variability.
of the species were able to keep growing in days with shorter In conclusion, our study revealed extremely low germination
photoperiods, therefore prolonging their growing season in and seedling survival of B. pendula, particularly under dry
autumn. Phenology in spring could also play a role in the conditions, suggesting limited future regeneration capacity if
differences in growing season length across populations. In fact, drought conditions increase, especially in the southern margins.
our results showed that populations of B. pendula differed in Populations greatly differed in early fitness components, with
the timing of bud burst. However, this trait was associated with significant intrapopulation variation detected for growth and
annual temperature but not with latitude. Furthermore, Li et al. phenology traits but not for emergence and survival rates.
(2002) found 40-day differences among southern and northern Genetic differences and other non-genetic factors, such as
populations of B. pendula in the date of growth cessation, while demography, climate and maternal effects, could have shaped
differences in growth initiation in spring were of only 4–7 days. the observed population variation patterns. These results,
These observations suggest a minor contribution of early along with high among-year variation in seed production
phenology to growth variation among populations of B. pendula. and germination, highlight the difficulty of achieving general
Different photosynthetic capacity might also have conclusions concerning tree early fitness traits. Further studies
contributed to observed growth differences among populations. under sufficiently replicated environmental conditions will
Previous studies have reported gas exchange and growth be necessary to test for plastic responses, ideally using seeds
potential variation across genotypes of B. pendula (Possen et al. collected in different years, to improve our understanding on
2011). Aspelmeier and Leuschner (2004) observed that B. pendula the potential regeneration niche and vulnerability of forest trees
genotypes from areas with drier summers had higher gas species such as B. pendula to climate change.
exchange rates, including higher stomatal conductance and
photosynthesis, in both well-watered and dry conditions. These
authors suggested that this strategy would favour fast growth Data
and competitiveness in drought-prone habitats. Phenotypic data used in this study are available at https://
Contrary to expectations based on previous studies, seed zenodo.org/record/3865210
mass was not significantly associated with growth traits. Seed
mass has been generally observed to play an important role in
early growth even at intraspecific level (e.g. Oleksyn et al. 1998;
Supporting Information
Rose et al. 2009; Ramírez-Valiente and Robledo-Arnuncio 2015). Table S1. Results of the mixed models for seed germination
One possible reason for the absence of association between rate and mean germination time in the chamber experiment.
seed mass and growth could be low statistical power, resulting Table S2. Results of the mixed models for seed germination
from the small number of populations that had seedlings alive rate in the chamber experiment of seed-crop years 2016 and
at the end of the experiment. Other reason is that seed mass 2017.
was determined mostly by empty seed proportions, and not by Table S3. Results of the generalized additive models (GAMLSS)
viable seed mass differences. Finally, it could be that traits such for emergence rate.
as growth phenology and gas exchange capacity would be more Table S4. Estimated values for emergence rate parameters
important than seed mass for growth potential in this species. using generalized additive models (GAMLSS).
Table S5. Results of the generalized additive models (GAMLSS)
Within-population variation at early fitness traits for emergence and survival rate for 2016 and 2017 seed crops of
Most forest trees show high within-population genetic variation populations ES2 and DE1.
(Hamrick 2004), particularly widely distributed species (e.g. Ramírez- Table S6. Results of the generalized additive models (GAMLSS)
Valiente et al. 2014, 2015). Studies in B. pendula have shown significant for survival rate.
intrapopulation genetic variation in growth and phenology traits in Table S7. Results of linear mixed models for height, diameter,
adult and juvenile trees (Baliuckienë and Baliuckas 2006; Rousi and slenderness and bud burst.12 | AoB PLANTS, 2020, Vol. 12, No. 3
Figure S1. Regression models for the relationship between seed Billington HL, Pelham J. 1991. Genetic variation in the date of budburst in
mass and chamber germination and field emergence rates. Scottish birch populations: implications for climate change. Functional
Ecology 5:403–409.
Castro J, Zamora R, Hodar JA, Gomez JM. 2004. Seedling establishment of
a boreal tree species (Pinus sylvestris) at its southernmost distribution
Sources of Funding
limit: consequences of being in a marginal Mediterranean habitat.
This project has received funding from the European Union’s Journal of Ecology 92:266–277.
Horizon 2020 research and innovation programme under grant Collins M, Knutti R, Arblaster J, Dufresne JL, Fichefet T, Friedlingstein P,
agreement no. 676876 (GenTree project). A.S.-M. was supported Gao X, Gutowski WJ, Johns T, Krinner G, Shongwe M, Tebaldi C,
by a PhD grant from the Subdirección General de Investigación Weaver AJ, Wehner MF, Allen MR, Andrews T, Beyerle U, Bitz CM, Bony S,
Booth BBB. 2013. Long-term climate change: projections, commitments
y Tecnología of the Instituto Nacional de Investigación y
and irreversibility. In: Stocker TF, Qin D, Plattner G-K, Tignor MMB,
Downloaded from https://academic.oup.com/aobpla/article/12/3/plaa019/5843671 by Lib4RI Empa user on 02 November 2020
Tecnología Agraria y Alimentaria (FPI-SGIT2016-01).
Allen SK, Boschung J, Nauels A, Xia Y, Bex V, Midgley PM, eds. Climate
Change 2013 - The Physical Science Basis: contribution of Working
Group I to the Fifth Assessment Report of the Intergovernmental Panel
Conflict of Interest on Climate Change. New York, NY: Intergovernmental Panel on Climate
Change, Cambridge University Press, 1029–1136.
None declared.
De Atrip N, O’Reilly C. 2007. Germination response of alder and birch seeds
to applied gibberellic acid and priming treatments in combination
Contributions by the Authors with chilling. Annals of Forest Science 64:385–394.
Donohue K, Rubio de Casas R, Burghardt L, Kovach K, Willis CG. 2010.
J.J.R.-A. conceived the idea; J.J.R.-A., A.S.-M., J.A.R.-V. and E.N. Germination, postgermination adaptation, and species ecological
designed the study; A.S.-M., K.H., L.O., P.K., D.D., J.A.R.-V and ranges. Annual Review of Ecology, Evolution, and Systematics 41:293–319.
J.J.R.-A. established the experiment and collected data; A.S.-M. Dyderski MK, Paź S, Frelich LE, Jagodziński AM. 2018. How much does
conducted the data analysis and wrote the manuscript; all climate change threaten European forest tree species distributions?
authors read, commented and approved the manuscript. Global Change Biology 24:1150–1163.
EEA. 2012. Climate change, impacts and vulnerability in Europe 2012, an
indicator-based report. EEA Report No. 12/2012. Copenhagen, Denmark:
Acknowledgements European Environment Agency (EEA).
We are greatly indebted to all GenTree partner teams that Eggers J, Lindner M, Zudin S, Zaehle S, Liski J. 2008. Impact of changing
participated in the seed collection campaigns: CSIC, INRA, wood demand, climate and land use on European forest resources
WSL, CNR, THUENEN and CEH. We thank Eduardo Ballesteros, and carbon stocks during the 21st century. Global Change Biology
Julius Bette, Fernando del Caño, Tabea Mackenbach and Sergio 14:2288–2303.
San Segundo for field work assistance, Lars-Göran Stener for Finn GA, Straszewski AE, Peterson V. 2007. A general growth stage key for
advice on B. pendula seed handling and sowing, José Climent describing trees and woody plants. Annals of Applied Biology 151:127–131.
EUFORGEN. 2009. Distribution map of silver birch (Betula pendula). www.
and Ricardo Alía for helping in the experimental design and
euforgen.org (August 2019).
Ruth Shaw for statistical advice during the stay of ASM at the
Gallego Zamorano J, Hokkanen T, Lehikoinen A. 2018. Climate-driven
University of Minnesota. We thank X. Picó, M. Abdelaziz and synchrony in seed production of masting deciduous and conifer tree
one anonymous reviewer for constructive criticism. We also species. Journal of Plant Ecology 11:180–188.
thank the staff at the Servicio Territorial de Medio Ambiente de Gibson AL, Espeland EK, Wagner V, Nelson CR. 2016. Can local adaptation
Segovia for the authorization and assistance for establishing the research in plants inform selection of native plant materials? An
Spanish experimental site. analysis of experimental methodologies. Evolutionary Applications
9:1219–1228.
Gordon AG. 1992. Seed manual for forest trees. Forestry commission bulletin
Literature Cited 83. London: HMSO.
Alberto FJ, Aitken SN, Alía R, González-Martínez SC, Hänninen H, Kremer A, Hamrick JL. 2004. Response of forest trees to global environmental
Lefèvre F, Lenormand T, Yeaman S, Whetten R, Savolainen O. 2013. changes. Forest Ecology and Management 197:323–335.
Potential for evolutionary responses to climate change - evidence from Harrell FE Jr. 2019. Hmisc: Harrell miscellaneous. R package version 4.2-0.
tree populations. Global Change Biology 19:1645–1661. https://CRAN.R-project.org/package=Hmisc (August 2019).
Aspelmeier S, Leuschner C. 2004. Genotypic variation in drought response Hijmans RJ, Cameron S, Parra J, Jones P, Jarvis A, Richardson K. 2005.
of silver birch (Betula pendula): leaf water status and carbon gain. Tree WorldClim, version 1.3. Berkeley, CA: University of California.
Physiology 24:517–528. Holm SO. 1994a. Reproductive patterns of Betula pendula, and B. pubescens
Atkinson MD. 1992. Betula pendula Roth (B. verrucosa Ehrh.) and B. pubescens coll. along a regional altitudinal gradient in northern Sweden.
Ehrh. The Journal of Ecology 80:837. Ecography 17:60–72.
Baliuckas V, Pliūra A. 2008. Phenogenetic variation pattern in adaptive Holm SO. 1994b. Reproductive variability and pollen limitation in three
traits of Betula pendula, Alnus glutinosa and Quercus robur in Lithuania. Betula taxa in northern Sweden. Ecography 17:73–81.
Biologija 2:60–65. Humphries RN, Jordan MA, Guarino L. 1982. The effect of water stress
Baliuckienë A., Baliuckas V. 2006. Genetic variability of silver birch (Betula on the mortality of Betula pendula Roth and Buddleia davidii Franch.
pendula L.) wood hardness in progeny testing at juvenile age. Baltic seedlings. Plant and Soil 64:273–276.
Forestry 12:134–140. Hynynen J, Niemisto P, Viherä-Aarnio A, Brunner A, Hein S, Velling P. 2010.
Bates D, Maechler M, Bolker B, Walker S. 2015. Fitting linear mixed-effects Silviculture of birch (Betula pendula Roth and Betula pubescens Ehrh.) in
models using lme4. Journal of Statistical Software 67:1–48. northern Europe. Forestry 83:103–119.
Beck P, Caudullo G, de Rigo D, Tinner W. 2016. Betula pendula, Betula pubescens ISTA. 2007. International rules for seed testing. Bassersdorf, Switzerland: The
and other birches in Europe: distribution, habitat, usage and threats. International Seed Testing Association.
In: San-Miguel-Ayanz J, de Rigo D, Caudullo G, Houston D, Mauri A, eds. Iverson LR, Schwartz MW, Prasad AM. 2004. How fast and far might tree
European atlas of forest tree species. Luxembourg: Publications Office of species migrate in the eastern United States due to climate change?
the European Union, e010226. Global Ecology and Biogeography 13:209–219.
Bevington J. 1986. Geographic differences in the seed germination of paper Jackson ST, Betancourt JL, Booth RK, Gray ST. 2009. Ecology and the
birch (Betula papyrifera). American Journal of Botany 73:564–573. ratchet of events: climate variability, niche dimensions, and speciesYou can also read