George Washington Region Resilience Plan - September 2021 2021
←
→
Page content transcription
If your browser does not render page correctly, please read the page content below
2021

   George Washington Region
        Resilience Plan
                           September 2021

PREPARED FOR THE GEORGE WASHINGTON REGIONAL COMMISSION BY THE BERKLEY GROUP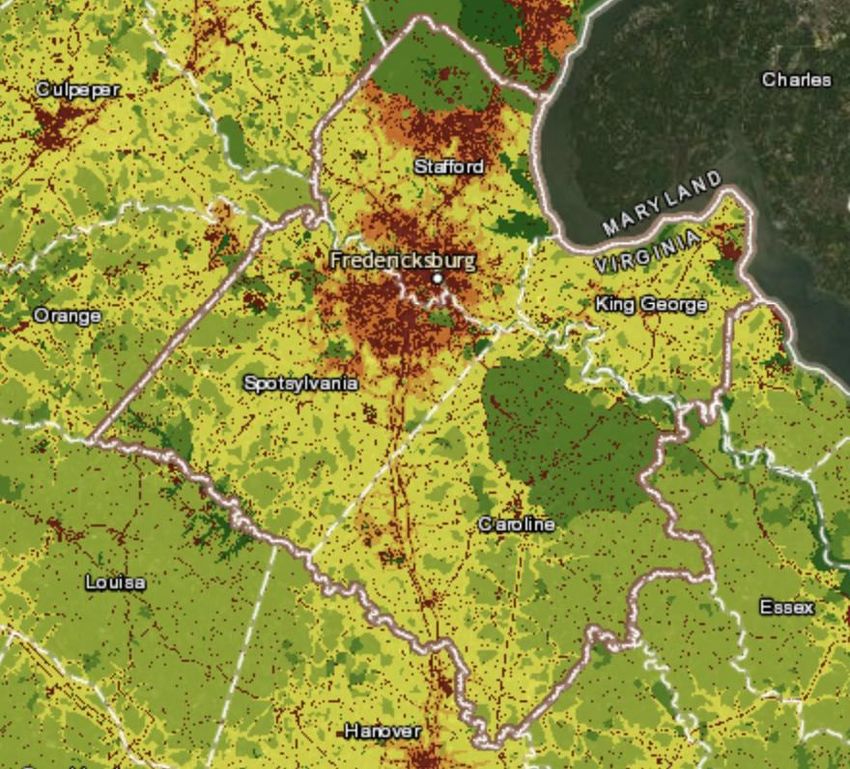
Table of Contents
Executive Summary ............................................................................................................... 1
Purpose and Introduction ...................................................................................................... 3
Definition of Coastal Resiliency .............................................................................................. 4
Existing Plans, Programs, and Data........................................................................................ 5
   Regional Plans ...............................................................................................................................5
   Programs .......................................................................................................................................6
   Data ..............................................................................................................................................1
Regional Assets ..................................................................................................................... 2
   Natural and Built Environmental Assets ..........................................................................................2
   Development Vulnerability ............................................................................................................6
   Economic Assets ............................................................................................................................8
   Social Assets ................................................................................................................................ 13
Natural Hazards .................................................................................................................. 17
   Hazard Overview: ........................................................................................................................ 17
   Dam Failure: ................................................................................................................................ 18
   Drought & Extreme Heat: ............................................................................................................. 19
   Wildfires: ..................................................................................................................................... 19
   Earthquakes:................................................................................................................................ 20
   Sinkholes & Landslides: ................................................................................................................ 21
   Flooding: ..................................................................................................................................... 21
   Hurricanes & Thunderstorms:....................................................................................................... 23
   Tornadoes: .................................................................................................................................. 23
   Winter Storms & Nor’easters: ...................................................................................................... 23
   Climate Change: ........................................................................................................................... 24
   Federal, State, Regional, and Local Disaster Preparedness............................................................. 28
   Critical Facilities ........................................................................................................................... 30
   Critical Infrastructure ................................................................................................................... 34
   Rivers and Impaired Waterways ................................................................................................... 35
   Topography ................................................................................................................................. 36
   Soil Erodibility.............................................................................................................................. 37
Initial Needs for Regional Resilience .................................................................................... 38
Potential Resilience Projects and/or Policies: ....................................................................... 39
Prioritizing Resilience Projects ............................................................................................. 39
APPENDIX A – Relevant Data Bases .................................................................................. 41
APPENDIX B – Goals and Objectives of Previous Regional Plans ....................................... 46
   GWRC Hazard Mitigation Plan Goals........................................................................................ 48
   Environmental Services Strategic Plan (2020) ............................................................................ 50
   GWRC Green Infrastructure Plan ............................................................................................. 51
   Good Jobs Here Report .............................................................................................................. 53
APPENDIX C – Impaired Waterways (DEQ Environmental Data Mapper 2020). ................ 56
APPENDIX D – Maps of Regional Watersheds/Impaired Waterways ................................... 71
APPENDIX E – GWRC Priority Species of Greatest Conservation Need .............................. 74
APPENDIX F: Summary of Conservation Strategies and Actions for the GW Region .......... 76
APPENDIX G: Considering the Whole Community ............................................................. 78
   Civil Rights Requirements .......................................................................................................... 78
   Analysis for Resiliency Plans and Programs ............................................................................... 79
APPENDIX H: Community Engagement ............................................................................ 81
   Opportunities for Community Engagement ................................................................................ 81
   Procedures .................................................................................................................................. 81

                                                                                                                                                 2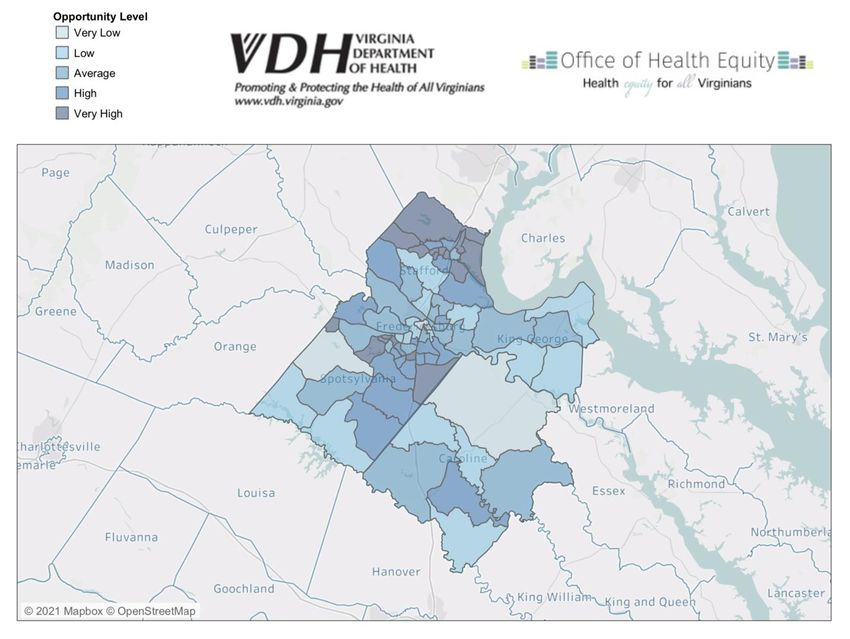
Executive Summary
The George Washington Regional Commission (GWRC)
is the Planning District Commission established by
legislation in 1969 by the General Assembly and
chartered in 1970 for the region that is home to the
City of Fredericksburg and the counties of Caroline,
King George, Spotsylvania and Stafford, known
collectively as “Planning District 16.” Caroline County
includes the incorporated towns of Bowling Green and
Port Royal.

GWRC is currently home to 376,649 residents. Planning
District 16 is the fourth-largest and the fastest-growing
of the Commonwealth’s 21 planning districts. GWRC
land drains to the Potomac River to the north and the
Rappahannock River in the center. Portions of
Stafford and King George Counties are bordered by the
Potomac River. Portions of all the localities touch the
Rappahannock River. Portions of Caroline County have
stream front on the Mattaponi and the Pamunkey
Rivers, tributaries to the York River. All these
waterways drain to the Chesapeake Bay.

Immediate, quantifiable resiliency related considerations for the region consist of sea level rise and
extreme weather events. While resiliency considerations and priorities for every locality within the region
will slightly differ, as will the capacity to address them, planning for regional resiliency can help reduce
future disaster related response and recovery cost. This Resilience Plan will equip the George Washington
Regional Commission and localities in the Region with a deeper understanding of priority actions that can
be implemented to improve the region’s resilience to hazards.

This Plan reviewed GWRC’s resiliency needs, and found that the natural hazards identified to be the
highest priority for the region include: Drought, Severe Weather (including Extreme Heat, Nor’easters,
Thunderstorms, Tornadoes, and Winter Storms), Sinkholes and Landslides, and Dam Failure, all of which
are likely to increase or be affected as a result of climate change. The Region has multiple resiliency assets
including greenways, ecological cores, rare and priority species, floodplains, rivers and waterways, and
cultural resources. These resources should be protected to effectively promote resilience throughout the
entire region. Currently, 33.8% of the population in the Region is ALICE (Asset Limited, Income
Constrained, Employed) and 7.2% of the population is disabled. In addition, four (4) census tracts in
Caroline County, two (2) in Spotsylvania County, and one (1) in Stafford County are designated as Mildly
Socially Vulnerable according to the VIMS Social Vulnerability Index. Two (2) census tracts in
Fredericksburg are designated Highly Vulnerable. These populations in particular should be focused on in
order to promote economic and social resiliency.

                                                                                                            1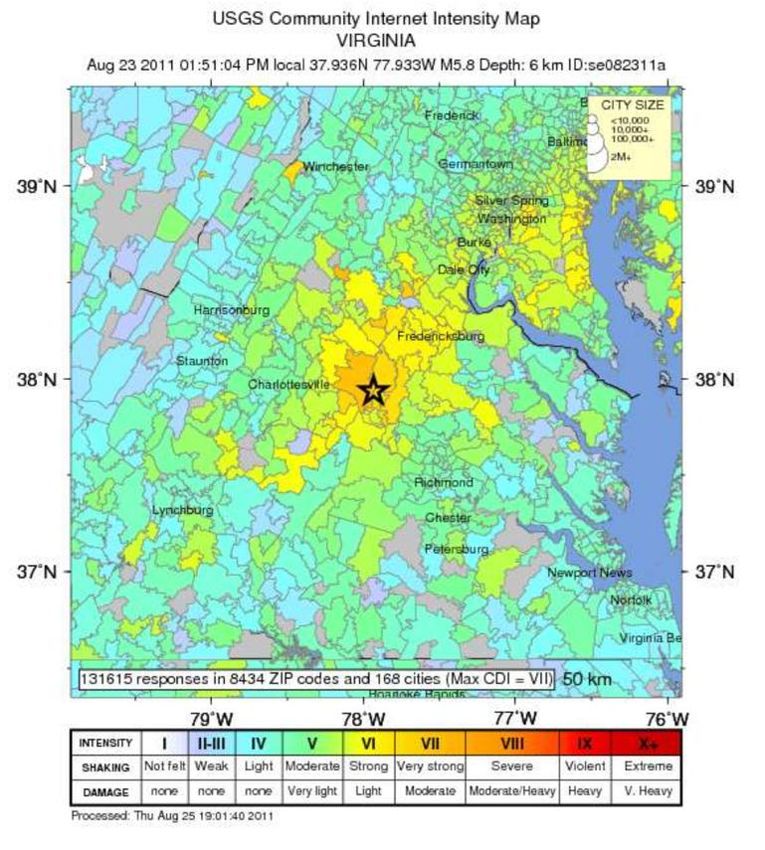
The George Washington Region should focus on the following needs to support future resiliency goals:

   1. Defining what resilience means to GWRC.
   2. Creating flood evacuation or snow evacuation plans for jurisdictions within the region.
   3. Obtaining data and establishing a plan to address roadways that are prone to flooding within the
      GW region.
   4. Shoring up public and private lands that are prone to recurrent flooding or will be at higher flood
      risk according to sea level rise and climate change models.
   5. Identifying disproportionately at-risk (otherwise known as “front line”) communities that need
      further assistance using environmental and socio-economic variables.
   6. Creating a plan to strategically address the Environmental Justice populations in the GW Region.
   7. Updating GIS and mapping capacity to serve the public and assist with regional planning efforts,
      especially related to flooding hazards and flood zones. Stafford County’s GIS portal (Stafford GIS)
      can serve as a guide.
   8. Mapping dam inundation zones in all counties and mapping high-risk dams throughout the region
      to protect human life and property.
   9. Filling in data gaps in soil erodibility as this will impact flooding and development considerations
      regionally. Fredericksburg, King George, and Spotsylvania do not have data on soil erodibility
      readily available to the public.
   10. Identification and potential mapping of regional repetitive and severe repetitive loss structures.

                                                                                                             2
Purpose and Introduction
This plan seeks to increase resiliency across the GWRC region by addressing threats to human life and
property from flooding, severe weather, and other natural events. It attempts to do so with 5 major
criteria in mind: being project based, with projects focused on flood control and resilience; incorporating
nature-based solutions to the maximum extent possible; including all parts of the GW Region regardless
of race or socioeconomic status; coordination within the region to achieve goals based on mutually-
agreed-upon timelines; and being based on the best-available science. Each of these criteria are outlined
in this or other regional plans here:

    1. It is project-based with projects focused on flood control and resilience.

 See the GWRC Environmental Services Strategic Plan, detailed on pg. 49 of this Resilience Plan.

    2. It incorporates nature-based infrastructure to the maximum extent possible.

 The solutions and planning principles outlined in this Resilience Plan and the projects listed in the
 Environmental Services Strategic Plan incorporates nature-based stormwater and flooding BMPs to the
 greatest extent possible.

    3. It includes considerations of all parts of a locality regardless of socioeconomics or race.

 This Plan considers solutions that involve every member of the community at every step of the process,
 and seeks to identify and target the GW Region’s most vulnerable communities. See “Social Assets” on
 pg. 12 of this plan for a detailed breakdown as well as “Appendix G: Considering the Whole Community”
 on pg. 78.

    4. It includes coordination with other local and inter-jurisdictional projects, plans, and activities and
       has a clearly articulated timeline or phasing for plan implementation.

 The Environmental Services Strategic Plan has detailed timelines and cost estimates for projects
 throughout the region.

    5. Is based on the best available science, and incorporates climate change, sea level rise, storm
       surge (where appropriate), and current flood maps.

 This plan attempts to quantify the resiliency challenges that climate change will bring using the best
 available data and science. See “Natural Hazards”, pg. 16, which includes specific plan elements related
 to flooding, climate change, flood maps, and vulnerability to sea level, with specific considerations for
 each locality in the region.

                                                                                                            3
Definition of Coastal Resiliency
The definition of resilience for the George Washington Regional Commission was developed through
adaptations of national, state and local language.

National: The ability to prepare and plan for, absorb, recover from, and more successfully adapt to
adverse events; the ability to adapt to changing conditions and withstand—and rapidly recover from—
disruption due to emergencies (NOAA).

Virginia: The ability of natural and built coastal environments to withstand and recover from hazardous
events such as extreme weather, storm surge, and recurrent flooding; focusing on increasing resilience to
sea level rise and natural hazards (including extreme storms and riverine flooding) with structural and
natural infrastructure projects and programs.

GWRC Strategic Plan Definition: Reduce or prevent losses of coastal habitat, life, and property caused by
shoreline erosion, storms, relative sea level rise, and other coastal hazards in a manner that balances
environmental and economic considerations (VA CZM Goal 4).

                                                                                                            4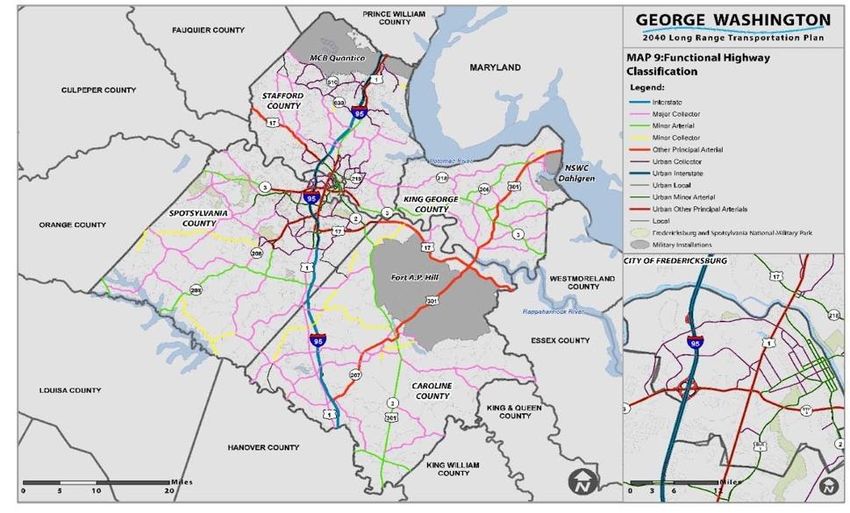
Existing Plans, Programs, and Data

Regional Plans
Regional Green infrastructure Plan (2017)
This plan documents the status of green infrastructure implementation, discusses local government tools
for supporting green infrastructure implementation, displays successful case studies, and provides
recommendations for future implementation. GWRC concluded that developing a collaborative approach
based on green infrastructure will be the best method to achieving voluntary actions. This plan relates to
the resiliency of the region through the safety of the built and natural environments.

Environmental Management Strategic Plan (2020)
The purpose of the strategic plan is to identify the region’s environmental service’s needs, coordinate the
requirements of related programs, create a list of strategies, and develop an implementation plan. The
items in this plan transcend the commission’s environmental services department to interact with
economic development, human services, and transportation programs. Through the planning process
GWRC works with regional stakeholders to develop a multi-year strategic plan for coastal zone
management that aligns with the goals and focus areas of the CZM Program, and responds to the needs
of the local jurisdictions of Planning District 16. The conceptual development and prioritization of projects
ranges from planning activities to “shovel-ready” designs.

GO Virginia Region 6 Growth and Diversification Plan Update (2019)
The purpose of GO Virginia is to create more and higher paying jobs through incentivized collaboration,
primarily from out-of-state revenue, which diversifies and strengthens regional economies. This update to
the 2017 plan identifies economic trends and drivers, priority industry clusters, and the demand for a
trained workforce and then provides investment strategies and recommendations to strengthen the
region’s economy, including establishing a Center for Resiliency Innovation.

Good Jobs Here Strategic Plan (2020)
Good Jobs Here is a broad-based effort to create, measure, execute, and foster economic growth and job
creation in the Fredericksburg region. Utilizing a GO Virginia grant, GWRC partnered with leading local
organizations to create a shared understanding of current data, analysis, strengths and opportunities for
this region.

Septic System Study (2018)
This study determined that the local health district does not have the capacity or tools to properly
document septic systems and pump outs as required in 5-year intervals by the CBPA. The study
recommended developing a pilot regional program that would aid local governments and VHD better
coordinate respective efforts to monitor and maintain septic systems. This study relates to the resilience
of the region through human and environmental health.

FAMPO Community Engagement and Equity Plan (2021)
FAMPO developed procedures and guidelines to evaluate existing equity, community engagement,
environmental justice, and limited English proficiency inclusion in the region’s transportation planning
process. These procedures might be beneficial in planning for the resilience of region as it creates a
consistent procedure every locality could adopt.

                                                                                                             5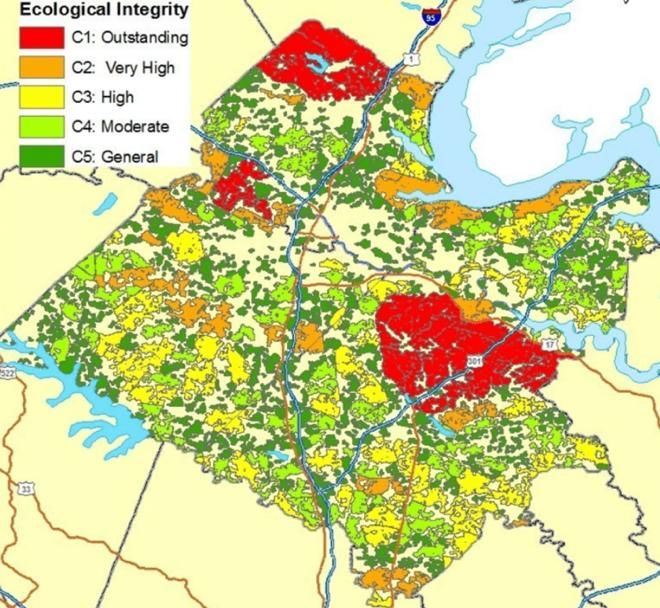
Water Quality Assessment Integrated Report (2020)
DEQ identified impaired waterways in Virginia collected from 2013 through 2018. The implementation
plans local to GWRC all address bacteria impairments:
Carter Run, Great Run, Deep Run, Thumb Run - Stafford (2006)
Upper York - Spotsylvania (2013)
Fairview Beach - King George (2016)
Mattaponi River - Caroline, Spotsylvania (2020)
GWRC Hazard Mitigation Plan (2017)
This Hazard Mitigation Plan is the sum of many actions that can be taken at the local and regional level,
setting goals, developing strategies, and outlining tasks and schedules to reduce or eliminate long-term
risk to human life and property from a variety of natural hazards. This plan relates to the resilience of the
region through identifying natural hazard priorities, and the safety of the built and natural environments.
APPENDIX B lists the resiliency related goals, objective, and projects of the plans mentioned above, from
which resiliency projects can be aggregated.
Programs
Watershed Implementation Plan (WIP)
Virginia developed a Watershed Implementation Plan in ongoing phases (2010, 2012, and 2019) to
incorporate strategies to reduce nutrient pollution in our waterways. The Chesapeake Bay Total
Maximum Daily Load (TMDL) is designed to ensure that all pollution control measures needed to fully
restore the Bay and its tidal rivers are in place by 2025. Specifically in Virginia, the TMDL calls for a 20.5%
reduction in Sediment delivered to the bay. This will be achieved through stormwater Best Management
Practice (BMPs). GWRC and other communities across Virginia, in cooperation with the Virginia
Department of Environmental Quality (DEQ), have been developing strategies to reduce nutrient
pollution in our waterways through the Chesapeake Bay TMDL Phase III WIPs.
In 2019, the state compiled and provided PDCs with plans that recommended voluntary implementation
of the following BMPs for the GWRC region by 2025:
Nutrient Management Plan, 37,212 acres Permeable Pavement, 7 acres
Conservation Landscaping practices, 1,250 acres Stormwater Treatment, 1 acre
Dry Extended Detention Pans, 9,154 acres Erosion and Sediment Control Level 2, 2,874 acres
Dry Detention Ponds, 4,926 acres Non-Urban Stream Restoration, 23,983 feet
Wet ponds and Wetlands, 8,205 acres Urban Stream Restoration, 8,032 feet
Infiltration Practices, 6,007 acres Urban Shoreline Management, 1,119 feet
Filtering Practices, 5,228 acres Non-urban Shoreline Management, 1,019 feet
Tree Planting - Canopy, 648 acres Urban Shoreline Erosion Control Vegetated, 399 feet
Forest Buffer and Planting, 360 acres Septic Pumping, 9,469 units
Forest Harvesting Practices, 6,882 acres Septic Denitrification - Conventional, 7,080 units
Runoff Reduction, 177 acres Septic Connection, 4,841
Bioretention/Rain Gardens, 2,522 acres Septic Secondary Treatment - Conventional 600 units
Vegetated Open Channels, 262 acres Septic Secondary Treatment - Enhanced, 22 units
Bioswale, 36 acres Septic Denitrification - Enhanced, 13 units
Impervious Surface Reduction, 1,497 acres Septic Effluent - Enhanced, 4 units
6
Coastal Zone Management (CZM)
DEQ administers the CZM annual grants from the National CZM Program. A portion of these funds are
administered to the state’s eight coastal PDCs to provide annual technical assistance to localities.
The Virginia CZM Technical Assistance Program provides GWRC with annual funds to advance coastal
management at the local level. Contracts between PDCs and governing state agencies must include three
minimum standards:
1. Coordination. PDC’s should hold quarterly meetings of local government representatives directly
involved in the management of coastal resources to share information on issues.
2. Training. PDC’s should provide at least four training opportunities related to one or more of CZM
program goals.
3. Issue Analysis / Special Projects. Each PDC should undertake one project during the grant year
that helps advance one or more of the coastal resource management goals.
CZM special projects typically deal with resiliency issues. Previous GWRC CZM special projects include:
Land Cover Data Layer Classification
Environmental Chapter for the Caroline County Code of Ordinances
Assessment and draft strategy for a Plant GWRC Natives Campaign
Forest Retention Data Gathering
Stormwater Best Management Practices Signage
City of Fredericksburg and Caroline County Community Rating System Project
Plant Central Rappahannock Natives Campaign Support
Regional Green Infrastructure Planning
Data
APPENDIX A is a table of relevant and useful resilience related databases- what entity produced the
dataset, the use/purpose of the dataset, and if the data is downloadable.
APPENDIX C has tables for each locality with 2020 data on the impaired waterways throughout the
region. The health of the region’s waterways affects the regional economic, social, and environmental
resiliency.
APPENDIX D contains maps of the watersheds that GWRC is located within and the associated impaired
waterways.
APPENDIX E is a table with GWRC priority species of greatest conservation need. Identifying and
protecting vulnerable species is important for the resilience of the region’s ecosystem and environment.
APPENDIX F is a table of conservation strategies and actions for the GW region, retrieved from the
Virginia Wildlife Plan.
1Regional Assets
The assets of the region have been grouped into three categories: Natural and Built
Environment, Economic, and Social.
Natural and Built Environmental Assets
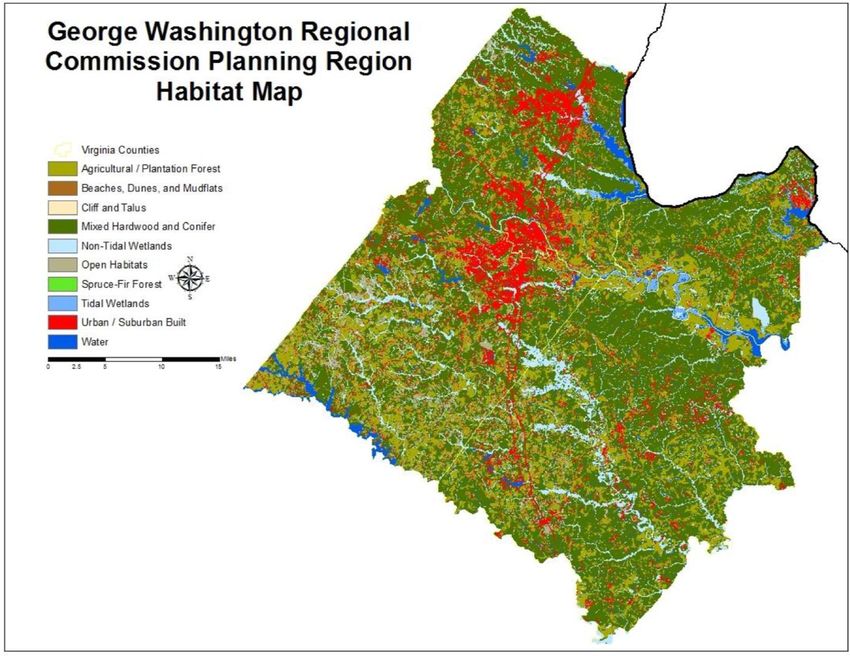
Special Habitats:
Figure 2. GWRC Species Habitat
Source: DCR, Natural Heritage 2014.
Of Virginia’s 883 Species of Greatest Conservation Need (SGCN), 76 are believed to either occur, or have
recently occurred, within the George Washington Planning Region. Of these 76 species, 30 SGCN are
dependent upon habitats provided only within the region. Appendix E lists priorities species throughout
the region with the greatest conservation need. Appendix F is a table summarizing conservation
strategies and actions for the region.
2Conservation Lands:
Having recognized the importance of the local habitats to both resident and migratory wildlife, state,
federal, and private entities have made significant investments to conserve lands within the planning
region. Conservation mechanisms range from conservation easements to state parks, forests, and wildlife
management areas to National Wildlife Refuges (NWR). Significant conservation assets, in terms of size,
include:
Rappahannock River Valley National Wildlife Refuge,
Fredericksburg and Spotsylvania National Military Park,
Lands’ End Wildlife Management Area,
Mattaponi Wildlife Management Area,
Pettigrew Wildlife Management Area,
Lake Anna State Park,
Widewater State Park,
Prince William Forest Park,
Crow’s Nest Natural Area Preserve,
Chotank State Natural Area Preserve, and
Caledon State Natural Area.
These properties contain a diversity of open water, forest, agricultural, and wetland habitats (Figure 3).
They have been conserved to provide a range of conservation, recreational, and economic benefits such
as habitat protection and restoration, ecotourism, and fishing and hunting opportunities. Additionally,
various military installations, such as Marine Corps Base Quantico and Fort A.P. Hill, support viable
habitats and wildlife populations.
Figure 3. GWRC Conserved Lands
Source: DCR, Natural Heritage (2014).
3Ecological Cores:
Ecological cores are patches of natural land with at least 100 acres of interior cover which provide habitat
for a large variety of species, including forest, marsh, and maritime dependent species. The Virginia
Natural Landscape Assessment (VaNLA) provides an analysis, using satellite data, that has identified,
prioritized, and linked the important land networks throughout Virginia. Preserving and maintaining these
landscapes can help ensure they continue to provide ecosystem services such as cleaner air and water
filtration. Ecological cores can also provide recreational opportunities and open space resources. The
following map shows which areas of the counties and cities within the GW region contain ecological
cores. A higher rating (with red being the highest) indicates the amount of ecosystem services that
ecological core provides. Examples of ecological services that cores provide include: wildlife and plant
habitat, biodiversity conservation, water resource protection, erosion control, and carbon sequestration.
The GW region should have strategies to preserve ecological cores, such as using them as park lands for
low-impact recreation (hiking, bird watching, etc.) and other conservation efforts.
Figure 4. GWRC Ecological Cores.
Source: Regional Green Infrastructure Plan (2009)
4Resource Protection Areas (RPAs):
Resource Protection Areas are defined as lands at or near the shoreline that have an intrinsic water
quality value due to ecological and biological processes they perform, or that are sensitive to impacts that
may result in significant degradation to the quality of state waters. RPAs in a natural condition provide for
the removal and/or reduction of sediments, nutrients, and potentially harmful toxic substances in runoff.
RPAs include the following sensitive land areas:
Tidal wetlands;
Nontidal wetlands connected by surface flow and contiguous to tidal wetlands or tributary
streams;
Tidal shores;
Other lands deemed by the governing body as necessary to protect the quality of state waters;
and
A buffer area not less than 100 feet in width located adjacent to and landward of the
components listed above, and along both sides of any tributary stream. In Spotsylvania County
the total amount of land designated as RPAs is estimated to be 12,000-acres, or roughly 5% of the
County’s total land area. The City of Fredericksburg’s RPAs and Resource Management Areas are
visualized below.
Figure 5. Fredericksburg RPAs and RMAs.
Resource Management Areas (RMAs):
Resource Management Areas are defined as lands that if improperly used, developed, or destroyed from
environmental hazards would have a potential for causing significant water quality and environmental
5degradation, diminishing the functional value of the land. The regulations require RMAs to be contiguous
to the entire inland boundary of the Resource Protection Area. RPAs and RMAs must be taken into
consideration when making land use and development decisions.
The regulations require the following to be considered for inclusion in the Resource Management Area:
Floodplains;
Highly erodible soils, including steep slopes;
Highly permeable soils;
Nontidal wetlands not included in the Resource Protection Area; and
Other lands necessary to protect the quality of state waters.
Development Vulnerability
Preserving the previously stated ecological cores and protecting rare species should be a resiliency goal
for the GW region. The Virginia Development Vulnerability Model determines the predicted relative risk
of conversion from natural, rural and other open space lands to higher density and urbanized land uses.
As shown in Figure 6 below, current high-density development is concentrated in the City of
Fredericksburg and adjacent areas in Stafford and Spotsylvania Counties. This data can help to identify
areas where development should be limited in ecological cores or other lands that should be protected in
order to preserve ecological integrity and continue to benefit from the ecosystem services they provide.
Figure 6. GWRC Development Vulnerability
Source: Virginia Department of Conservation and Recreation, Natural Heritage Program
Cultural Areas, Tribal Zones, Historical Areas:
Cultural and historical sites provide a valuable resource for communities. These destinations can
encourage tourism, and protecting them from flooding, and other natural disasters is essential. Historic
6and cultural areas assist localities with community character and provide opportunities for community
events and other essential services. The following are listed resources by county and city:
Table 1: GWRC Historical, Cultural, or Tribal Resources
Types of Historical, Cultural, or
County/City Link
Tribal Resources
Contains a variety of Native
American/Tribal sites, civil war sites, https://co.caroline.va.us/DocumentCenter/
Caroline
cemeteries, local parks, historical towns View/413/Chapter-5-Cultural-and-
County
such as Bowling Green, and historical Historic-Resources-PDF
properties and buildings.
Contains state and local parks, Tribal sites,
King George https://www.dhr.virginia.gov/historic-
historical properties and buildings, and
County registers/king-george-county/
archaeological sites.
Contains historic districts, archaeological
sites, historic manors, churches,
Stafford cemeteries, courthouses, national state and https://www.dhr.virginia.gov/historic-
County local parks and trails. Additionally, this registers/stafford-county/
County is home to a state recognized
Indian tribe (the Patawomeck Tribe).
https://www.spotsylvania.va.us/737/Histor
y-Culture
Contains national, state, and local parks,
Spotsylvania
civil war battlefield sites, historic iron
County https://www.spotsylvania.va.us/Document
mines, and tribal sites.
Center/View/2110/Appendix-C---Historic-
Resources-PDF
Contains national and local parks, civil
war battlefield sites, historic district, and https://www.fredericksburgva.gov/Docume
Fredericksburg cemeteries. Additionally, this County is ntCenter/View/334/Historic-Preservation-
home to a state recognized Indian tribe Plan?bidId=
(the Patawomeck Tribe).
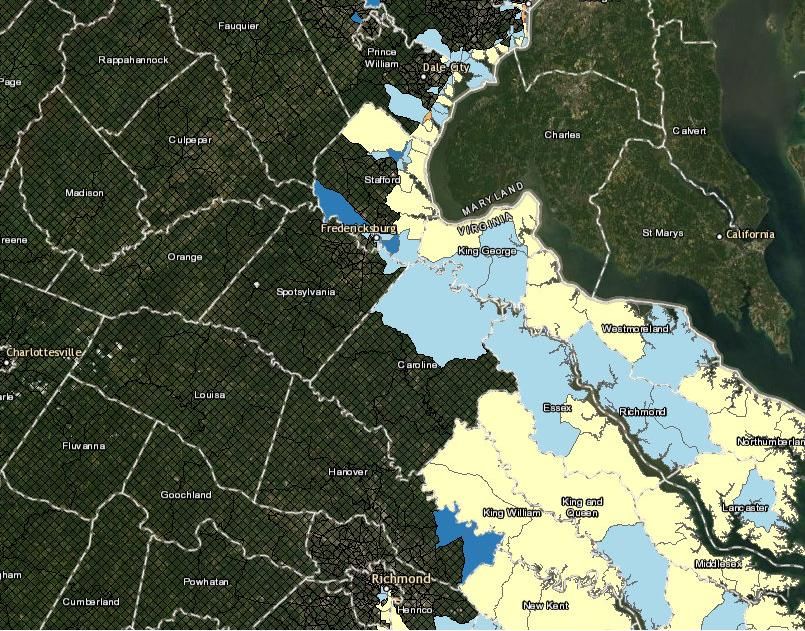
Community Environmental Opportunity:
The Community Environmental Profile indicates what the current state of the natural, built, and social
environment is of the GW region. This information can provide the GW region with information where
resilience BMPs and green infrastructure can provide additional co-benefits. The Community
Environment Profile includes the following indicators:
Air Quality: includes measures of pollution from the EPA, including on-road and, non-road, and
non-point pollution. It also includes the EPA measure of neurological, cancer, and respiration
risks.
Population Churning: the rate at which people move in and out of a given community.
Population Density: the population density of a given community.
7 Walkability: A measure of multiple variables, including residential and employment density, street
connectivity, and public transit accessibility.
Figure 7: Community Environmental Opportunities
Source: https://apps.vdh.virginia.gov/omhhe/hoi/community-environmental-profile
Economic Assets
Community Economic Opportunity:
The following map provides the Economic Opportunity Profile for the GW region, based on Virginia’s
Department of Health (DOH) Health Opportunity Index. The Economic Opportunity Profile provides a
visual for the impact place has on a citizen’s ability to participate in the economic life of a community.
Factors influencing economic opportunity include access to jobs, labor participation rates, and the
distribution of income within a community. Understanding these factors can help planning efforts in
calculating co-benefits in terms of resiliency. In particular, green jobs and other environmentally
sustainable growth strategies can bring new jobs to the region and provide other new opportunities for
residents. It can also help focus in on the communities that could most benefit from economic
revitalization.
8Figure 8. Economic Opportunity for the GW region
Source: https://apps.vdh.virginia.gov/omhhe/hoi/economic-opportunity-profile
Household Trends:
As of 2010, there were 112,048 households in the GW Region, including the 28,339 additional households
added since 2000 (a 34% increase). With moderate economic growth projected in the Fredericksburg,
Washington DC-Northern Virginia area, and Richmond metro economies for years to come, continued
household growth is likewise projected for the GW Region, reaching an estimated 223,710 households by
2040. With the projected growth in households throughout the region, increased development is
inevitable. To ensure more resilient and equitable communities and housing conditions, all new
development should be located away from areas prone to flooding or other environmentally sensitive
areas.
Economic Trends & Drivers:
To create economic resiliency for the GW Region the largest employers should be actively included
throughout the planning process to inform and engage prominent businesses.
9The 10 largest employers in the George Washington Region include:1
1. U.S. Department of Defense
2. Stafford County Schools
3. GEICO
4. Spotsylvania County Schools
5. Mary Washington Hospital
6. U.S. Federal Bureau of Investigation
7. Wal-Mart
8. University of Mary Washington
9. Stafford County
10. Spotsylvania County
An assessment of economic and labor market conditions conducted in the GO Virginia Region 6 Growth
and Diversification plan yielded these findings:2
Private sector jobs account for a smaller proportion of total employment in Region 6 (76%) than
the state of Virginia (82%)
Employment growth for the region has slowed to the statewide trend, and the Fredericksburg
area grew at a faster pace than other parts of the region.
The unemployment rate in the GW Region has been continuously lower than that of the United
States and the Commonwealth of Virginia. This is attributable to the high number of U.S. Military
and Government workers that reside in the Region.
The Professional, Scientific & Technical Services sector increased by 739 jobs; Other Services
increased by 474 jobs; and Health Care and Social Assistance increased by 438 jobs. These three
sectors lead year-over-year employment growth.
60% of the region’s workers commute to employment outside the region.
Fredericksburg is the regional center for administration, professional services, finance, higher
education, medicine, and commerce.
The findings above indicate that the economic development of the region would significantly benefit from
expanding the region’s private sector resiliency marketplace, through attracting and increasing
companies that can provide services and products to meet the needs for the protection of coastal land,
infrastructure, and water quality. This may also decrease the proportion of those who commute out of
the region for work.
Transportation:
Due to the rapid growth of the George Washington Region, traffic congestion levels have risen
considerably over the past 30 years. Interstate 95 carries more than 160,000 vehicles per day through the
Fredericksburg region and experiences recurring congestion and incident delays. As of 2015, over half of
the workers that live in GW commuted to work outside of the Region, with an average travel time to work
of 35.4 minutes. Roads are critical infrastructure for residents to commute to work or travel, and figure
heavily into resiliency considerations.
1
Source: VEC, GO Virginia Region 6 Plan.
2
Region 6 includes the GW region and the counties of Essex, Gloucester, King and Queen, King William,
Lancaster, Mathews, Middlesex, Northumberland, Richmond, and Westmoreland.
10The corridors of choice for these commuters are Interstate 95 and Jefferson Davis Highway/Cambridge
Street (US-1), which bisect the region and serve as major north-south transportation routes for
commuters, vacationers, business travelers, local resident trips, and long-haul truck traffic. The
Rappahannock River, which flows through the Region, presents a significant barrier to north-south auto
travel and is a choke point as many alternate routes (US 17, VA 3) funnel traffic to the limited crossings in
the Fredericksburg Vicinity. Fredericksburg is also a strong regional employment center in its own right,
which brings a large number of people into the City on a daily basis.
Figure 9 & 10. George Washington Region Transportation Network
Source: FAMPO/GWRC TDM STUDY
Transportation and infrastructure are a critical component of healthy and resilient communities, even
more so during a natural hazard or emergency. The Transportation Demand Management (TDM) for the
localities in the region should determine the potential congestion that would arise in the event of a
natural disaster or emergency. Major roadways and other critical transportation infrastructure must be
incorporated into resiliency planning as it impacts human health and economic resilience of the region.
When establishing Emergency Evacuation Routes for the region, factors that must consider include but
are not limited to: accessibility, connectivity, congestion, and the capacity of travel corridors. Flooding
events in particular are a major concern.
11Fiscal Stress:3
Fiscal stress describes the ability of a locality to provide services to their citizens – a lack of revenue,
dwindling tax base, or too much debt can place a burden on the government services that citizens
depend on. “The fiscal stress index illustrates a locality’s ability to generate additional local revenues from
its current tax base relative to the rest of the Commonwealth. Revenue capacity is a computation of how
much revenue a jurisdiction could generate if it taxed its population at statewide average rates. Revenue
effort is a ratio of actual tax collections by a locality to its computed revenue capacity. Median household
income represents the level at which exactly half of the households in a jurisdiction earn more and the
other half earns less.”
In the GWRC region, this primarily affects Fredericksburg, which is listed as “above average” due to its
poor “revenue effort”, or ability to generate its own revenue (from real estate taxes, personal property
taxes, local option sales taxes, and other local sources).
Figure 11. Fiscal Stress Index Map
Source: Virginia Department of Housing and Community Development, Commission on Local Government
3
For more information, see the Department of Housing and Community Development’s July 2020 report:
https://www.dhcd.virginia.gov/sites/default/files/Docx/clg/fiscal-stress/fiscal-stress-report.pdf
12Social Assets
Populations that are predicated to be disproportionately impacted by regional hazards must be equitably
centered in resiliency planning as those individuals are more vulnerable to disasters based on social and
economic factors.
Environmental Justice Groups for the George Washington Region include:
1. Minority Populations
2. Low Income Populations
3. Disabled Populations
4. Older Adult Populations
5. Limited English Proficiency Populations
Minority Populations:4
African American
As of 2010, persons with African American ancestry make up roughly 17.5% of the total regional
population. Stafford has the lowest percentage of African Americans (15.1%) living within the county;
following Stafford County is Spotsylvania County at 16.58%, King George County at 17.2%, the City of
Fredericksburg with 21%, and finally Caroline County with the highest percentage at 29.1%. Naturally,
with Caroline County having the highest percentage within the region, it has relatively high percentages
split up amongst its six census tracts. Five of the six tracts have 20.1-40% of their populations comprised
of African Americans, with the sixth tract representing 40.1-53.5%. The remaining municipalities with an
exception to Fredericksburg have a relatively even percentage distribution of persons with African
American heritage. The City of Fredericksburg has five census tracts; the one on the southeastern portion
of the city has between 40.1% and 53.5% of the population with African American heritage. The middle
two tracts have between 0% and 10%, with the remaining two on the western half of the city with
aggregations between 20.1% and 40%.
Asian American
As of 2010, Asian American demographic makes up a relatively small portion of the overall population,
with an average of 2.1% for the entire FAMPO and GW Region. To the contrary of the data observed for
African American populations, Asian Americans have a higher concentration in the more urbanized areas
of the region. Stafford County has the highest percentage with 2.6%, whereas Caroline County has the
lowest with 0.4%, followed by King George County with 1.05%, City of Fredericksburg with 2.05% and
Spotsylvania County with 2.17%. Most of this population group lives along and to the west of the I-95
corridor.
Latino/Hispanic
As of 2010, the Regional percentage of the Hispanic/Latino population is roughly 6.2%. Stafford County
leads this segment with approximately 7.97% of its population descending from Hispanic/Latino heritage.
King George County follows closely behind with 7.73%, Spotsylvania County with 6.36%, Caroline County
with 3.55%, and finally the City of Fredericksburg with 3.15%. Much like the distribution of the Asian
American population group, Hispanic/Latinos have higher concentrations along and to the west of the I-
4
Demographic data collected from FAMPO Long Range Transportation Plan.
1395 corridor, with a majority located in the urbanized areas of Fredericksburg and northern Stafford
County.
Limited English Proficiency Population:5
About 3.14% of the Region’s population has limited English Proficiency, with Fredericksburg having the
highest percentage at 4.5%. Stafford County is next with 4.2%, followed by Spotsylvania County with
3.3%, Caroline County with 1.5% and finally King George County with 0.7%. The Fredericksburg and North
Stafford urbanized areas have the highest concentrations of Limited English speakers, with King George
and Caroline Counties having the lowest percentage. Individuals or households that have limited
proficiency in English must have equal access to information which may require translations of resilience
documents to be created.
ALICE Population:6
Asset Limited, Income Constrained, Employed (ALICE) households are households that are above the
federal poverty line, but still have limitations and do not have as much economic flexibility and who may
struggle to keep up with a standard household budget. Most of the jurisdictions within the region are
above the state average for ALICE populations of 29%. Lower-income households are more vulnerable to
extreme weather events and climate change as these individuals have less recourse to adequately
prepare for and recover from environmental hazards.
Table 2: ALICE in GWRC 2018
% Population Below ALICE
County ALICE Population
Threshold
City of Fredericksburg 10,582 54%
King George County 9,103 26%
Spotsylvania County 45,223 37%
Stafford County 48,418 29%
Caroline County 10,911 44%
Regional Total 124,237 33.8%
Source: U.S. Census, ACS, 2019
5
For more information on LEP populations visit https://apps.vdh.virginia.gov/omhhe/clas/leppopulation/
6
For more information see www.unitedforalice.org.
14Figure 12. ALICE Households by District
Source: Good Jobs Here Report
Disabled Individuals:
Individuals with disabilities are also vulnerable from extreme weather events. People with disabilities may
not have the social support they need in order to evacuate during extreme weather events and may not
have the financial resources available to relocated. It is vital that communities have a plan in place to
address households with individuals who have disabilities and other special needs.
Table 3: Disabled Individuals in GWRC 2019 (Census Data)
County Disabled Individuals % of Population
City of Fredericksburg 2,381 8.2%
King George County 2,066 7.7%
Spotsylvania County 10,897 8%
Stafford County 9,173 6%
Caroline County 2,550 8.3%
Regional Disabled Population 27,067 7.2%
Source: U.S. Census, 2019 American Community Survey
Older Adults:
As of 2010, about 6.4% of the Region’s population is comprised of Older Adults, with the City of
Fredericksburg having the highest percentage at 11.07%. Caroline County comes in second with 10.9%;
King George County is next with 7.22%, followed by Spotsylvania County with 6.35% and finally Stafford
15County with 4.55%. The southern and eastern portions of the Region have the highest percentages of
Older Adults living there.
16Natural Hazards
Environmental events that could result in harm to property or human welfare are an important
consideration in Regional resiliency. Natural hazards were identified in the Regional Hazard Mitigation
Plan, which also developed actions, tasks, mitigation strategies to reduce risk. Below, the natural hazards
for the George Washington Region are identified then further defined.
1. Dam Failure
2. Drought & Extreme Heat
3. Wildfires
4. Earthquakes
5. Sinkholes & Landslides
6. Flooding
7. Hurricanes & Thunderstorms
8. Tornadoes
9. Winter Storms & Nor’easters
10. Climate Change
Hazard Overview:
The natural hazards identified to be the highest priority for the region include: Drought, Severe
Weather (including Extreme Heat, Northeasters, Thunderstorms, Tornadoes, Winter Storms), Sinkholes
and Landslides, and Dam Failure. Identifying the natural hazards that pose the most risk to the city and
counties in this Region enabled GWRC to create mitigation strategies for each community. The table
below presents community-specific sections where those natural hazards affect each member jurisdiction
differently. Low, Medium, and High are the indicators of the probability of occurrence of each hazard.
Table 4: Community Specific Natural Hazards
GWRC Regions
Priority for Identified Caroline King George Spotsylvania Stafford
Fredericksburg
Hazards County County County County
Dam Failure Low N/A Low Low Low
Drought and Extreme Heat Medium Medium-High Medium-High Medium Medium-High
Wildfires Medium-High Medium-High Medium Medium Medium-High
Earthquakes Low Medium Medium-High Medium-Low Low
Sinkholes and Landslides Low Medium-Low Low Low Medium-Low
Flooding and Erosion Low High Medium-High High High
Non-Rotational Wind Medium-High High High High High
Tornadoes Medium-High High High Medium-High High
Winter Storms and
Medium-High High High High High
Nor’easters
17Dam Failure:
Dam failure can occur if hydrostatic pressure behind the dam exceeds its design capacity or the crest of
the dam is overtopped and rushing flood water scours the base of the dam. The Virginia Soil and Water
Conservation Board established the Virginia Dam Safety Program to provide for safe design, construction,
operation, and maintenance of dams to protect public safety. Dams cannot be constructed or altered
until the VSWCB issues a permit; all dams are subject to regulations.
Dams are classified with a hazard potential (low, significant, high) depending on the downstream losses
anticipated in event of failure. Hazard potential is unrelated to structural integrity of a dam, rather the
potential adverse downstream impacts should a dam failure occur. Below are the classifications of dams
within the region.
Table 5: National Inventory of Dams in GWRC Region
Downstream Hazard Potential
Community
High Significant Low
Caroline County 3 35 51
City of Fredericksburg 0 0 0
King George County 1 1 8
Spotsylvania County 5 7 9
Stafford County 7 11 6
GWRC Total 16 54 74
Data Source: GWRC Hazard Mitigation Plan
A dam break inundation zone is the area downstream of a dam likely to be inundated or otherwise
directly affected because of a dam failure. Identifying zones that have been classified as high and
significant hazard potential help the communities within the region better prepare areas that would be
disproportionately affected by a dam failure. Stafford County is the only part of the region that has a
publicly available map of dam break inundation zones.
Stafford County has 22 listed dams, 20 of which are subject to DCR regulations. Two dams are located on
the Quantico Marine Corps Base and are federally owned and therefore not subject to DCR regulations.
Fredericksburg’s “Pond D” dam (No. 630004 in DCR’s Dam Safety Inventory System), an earthen
embankment impounding Smith Run before connecting to Hazel Run and the Rappahannock River, is
anticipated to be classified as a “high-hazard” dam. The City has already retained consultants to develop
the appropriate certification documents (e.g. Emergency Action Plan, dam failure analysis, mapping of
dam break inundation zone, etc.) and is refining the hazard classification documentation relative to the
spillway design storm requirements (0.9 PMP vs. 0.6 PMP). Overtopping protection measures will be
implemented, three of which have been evaluated by the City. Fredericksburg will incorporate resilience
elements that are nature-based; coordinated with a similarly-located, under-design, wet-pond [TMDL]
retrofit, and based upon the best available science.
18Figure 13. Stafford County Dam Inundation Zones
Source: Stafford County
Drought & Extreme Heat:
A drought is a period of drier-than-normal conditions that results in water-related problems. In a one-
year time frame, droughts are considered large when the 12-month rainfall averages approximately 60
percent of normal. On a multi-year time scale, 75 percent of the normal rainfall indicates a serious
problem. High summer temperatures can exacerbate the severity of a drought. Drought and extreme
heat can impact regional agriculture, wildlife, and habitat. Agriculture remains a major industry in the
GWRC region; although the number and size of farms across the region has decreased in the last 20
years, the economic impact of farms have increased.
Extreme Heat results from high daily temperatures combined with high relative humidity. High relative
humidity retards evaporation, robbing the body of its ability to cool itself. Incidents of excessive heat in
GWRC are defined by Heat Watches and Heat Warnings issued by the National Weather Service (NWS).
While the severity of extreme heat is quite small compared with the rest of the nation, the entire GWRC
region is subject to high temperatures, with occasional summer days reaching over 100 degrees
Fahrenheit, often accompanied by high humidity. There are intersectional threats related to heat, with
the elderly and those socioeconomically stressed and/or without the means to afford air conditioning
being especially vulnerable.
Wildfires:
An uncontrollable fire spreading through vegetative fuels, possibly consuming structures. Geographically,
wildfire risk as determined by the Virginia Department of Forestry (VDOF) varies across the GWRC region.
Approximately 62.7% of the GWRC region is located within a high fire risk zone.
19Table 5: Critical Facilities for Wildfire Risk
Locality Total at Risk Critical Facilities
Caroline County incl. Towns of Port Royal and
12
Bowling Green
City of Fredericksburg 5
King George County 29
Spotsylvania County 71
Stafford County 54
George Washington Region Total 171
Data Source: GWRC Hazard Mitigation Plan
Earthquakes:
Defined as a series of elastic waves in the crust of the earth, caused by abrupt easing of strains built along
geologic faults and by volcanic action, and resulting in movement of the earth’s surface. Earthquakes can
affect hundreds of thousands of square miles and cause extreme damage to property, cause injury and
loss of life, and disrupt the social and economic functions of the affected area. The GWRC region lies in an
area of moderate seismic risk, with a peak acceleration of 6 to 10g, which is considered a moderate
hazard probability.
Figure 14. GWR Earthquake Intensity
Source: USGS Community Earthquake Intensity Map (2011)
20Sinkholes & Landslides:
Sinkholes are depressions in the land surface caused by subsurface conditions. Naturally occurring
sinkholes are largely associated with karst topography, where changing groundwater conditions may
cause a sudden loss of stability in the roofs of cavernous openings, causing sudden sinkholes. The GWRC
region is not considered to be within a karst area.
A landslide is the movement of any mass of rocks, soil, or debris down a slope. Usually triggered by heavy
rainfall, rapid snow melt, stream incision, or earthquakes. Certain man-made changes to the land can
greatly increase the likelihood of landslides. The steady urbanization of the GWRC region makes the
possibility of landslides caused by man made changes to slopes by the location of buildings and
infrastructure, including roads, on or near steep slopes, more common. Landslide potential is considered
high is Stafford County, moderate in King George County, and low in Spotsylvania County, Caroline County
and the City of Fredericksburg.
Flooding:
The most frequent and most costly natural hazard throughout the United States is flooding. Excess water
from snowmelt, rainfall, or storm surge accumulates and overflows onto adjacent floodplains. There are
four basic types of flood that afflicts Virginia’s communities, depending on the region of the state
examined: coastal flooding, urban flooding, flash flooding, and riverine flooding. The GWRC region is most
susceptible to urban flooding and flash flooding. Low-lying areas adjacent to rivers, streams, or creeks are
susceptible to riverine flooding. In addition, portions of the Potomac and Rappahannock Rivers in the
region are subject to tidal flooding. Urban Flooding often occurs in highly impervious areas.
Table 6: Critical Facilities in 100-year floodplain
Locality Total at Risk Critical Facilities
Caroline County incl. Town of Port Royal and
0
Bowling Green
City of Fredericksburg 17
King George County 3
Spotsylvania County 11
Stafford County (excl. Quantico) 1
George Washington Region Total 32
Data Source: GWRC Hazard Mitigation Plan
While many floodplain boundaries are mapped by FEMA’s National Flood Insurance Program (NFIP),
floods sometimes go beyond mapped floodplains or change course due to natural processes or human
development (e.g., filling in floodplain or floodway areas, increased impervious surfaces from new
development within watershed, etc.). All the jurisdictions in GWRC are mapped by NFIP and participate in
the program. FEMA’s HAZUS tools estimate the risk from severe weather, including earthquakes.
King George County has 26 properties enrolled in NFIP; none of the insured properties are classified as
Repetitive Loss property. FEMA’s HAZUS estimates the displacement of 49 households as the result of a
hypothetical 100-year flood event, with 20 people seeking emergency shelter within the community.
21You can also read


