GET VICTORIA MOVING - Traffic light removal project - Fixing 55 of Melbourne and Geelong's busiest, most congested intersections
←
→
Page content transcription
If your browser does not render page correctly, please read the page content below
GetVictoriaMoving.com.au

GET
VICTORIA
MOVING
A Super Highway for Melbourne
- Building an East West Link and a North East Link

                     +
Traffic light removal project
- Fixing 55 of Melbourne and Geelong’s busiest,
  most congested intersections
INTRODUCTION

                              A Liberal Nationals Government will build an
                              East West Link and a North East Link to create
                              Australia’s biggest ‘Super Highway’ for Australia’s
                              fastest growing city.
                              Melbourne’s population is about to hit the 5 million mark. Melbourne is jam- packed.

                              We need to stop playing catch-up with infrastructure and start getting ahead.

                              Only the Liberal Nationals will build an East West Link AND a North East Link, developed
                              in tandem with both expected to be completed in 2026 and 2027 respectively.

                              Only the Liberal Nationals will remove traffic lights and roundabouts through grade
  MATTHEW GUY MP              separations at 55 of Melbourne and Geelong’s busiest, most congested intersections.
  Leader of the Opposition
                              Only the Liberal Nationals will deliver a record number of jobs in the construction of
                              an East West Link, a North East Link and the removal of 55 intersections.

                              Only the Liberal Nationals have a comprehensive congestion-busting plan for
                              Melbourne’s highways and arterial roads.

                              Our comprehensive plan for a Super Highway and removing 55 of Melbourne and
                              Geelong’s busiest, most congested intersections will mean people like tradies,
                              couriers and salespeople who use the roads to get between jobs, will be able to do so
                              more quickly. That’s good for small businesses and good for jobs.

                              Recently released census data shows that 74% of Melburnians drive to work every day.
                              That’s why more of Daniel Andrews’ same band-aid approach won’t work and it’s why
                              we are offering a clear choice at the next election.

                              The details for our plan for building a new Super Highway and unclogging our arterial
  PETER WALSH MP              roads - the biggest combined congestion-busting project in Australia – are laid out in
  Leader of the Nationals     this booklet and can be found on our website www.GetVictoriaMoving.com.au

                              Yours sincerely,

                              MATTHEW GUY MP                 PETER WALSH MP                DAVID HODGETT MP
                              Leader of                      Leader of                     Shadow Minister for
                              the Opposition                 the Nationals                 Roads and Infrastructure
  DAVID HODGETT MP
  Shadow Minister for Roads
  and Infrastructure

GetVictoriaMoving.com.au                                                                                               –1–
–2–
CONTENTS

       INTRODUCTION. . . . . . . . . . . . . . . . . . . . . . . . . . . . . . . . . . . . . . . . . . . . . . . . . . . . . . . . . . . . . . .  1

       THE PROBLEM. . . . . . . . . . . . . . . . . . . . . . . . . . . . . . . . . . . . . . . . . . . . . . . . . . . . . . . . . . . . . . . . 4
           Population growth . . . . . . . . . . . . . . . . . . . . . . . . . . . . . . . . . . . . . . . . . . . . . . . . . . . . . . . . . . . . . . . . . . . . . . . .  4
           Increase in vehicles. . . . . . . . . . . . . . . . . . . . . . . . . . . . . . . . . . . . . . . . . . . . . . . . . . . . . . . . . . . . . . . . . . . . . . . .  5
           Congestion. . . . . . . . . . . . . . . . . . . . . . . . . . . . . . . . . . . . . . . . . . . . . . . . . . . . . . . . . . . . . . . . . . . . . . . . . . . . . . .  5
           People who travel to work by car . . . . . . . . . . . . . . . . . . . . . . . . . . . . . . . . . . . . . . . . . . . . . . . . . . . . . . . . . . . 7
           Peak hours are busier and longer. . . . . . . . . . . . . . . . . . . . . . . . . . . . . . . . . . . . . . . . . . . . . . . . . . . . . . . . . . .  8
           Impact on people. . . . . . . . . . . . . . . . . . . . . . . . . . . . . . . . . . . . . . . . . . . . . . . . . . . . . . . . . . . . . . . . . . . . . . . . .  9
           Impact on business productivity and jobs . . . . . . . . . . . . . . . . . . . . . . . . . . . . . . . . . . . . . . . . . . . . . . . . . .  9
           The costs to small business . . . . . . . . . . . . . . . . . . . . . . . . . . . . . . . . . . . . . . . . . . . . . . . . . . . . . . . . . . . . . .  10

       A ‘SUPER HIGHWAY’ . . . . . . . . . . . . . . . . . . . . . . . . . . . . . . . . . . . . . . . . . . . . . . . . . . . . . . . . . . 12
           Melbourne is jam-packed. . . . . . . . . . . . . . . . . . . . . . . . . . . . . . . . . . . . . . . . . . . . . . . . . . . . . . . . . . . . . . . . . 13
           Building an East West Link. . . . . . . . . . . . . . . . . . . . . . . . . . . . . . . . . . . . . . . . . . . . . . . . . . . . . . . . . . . . . . . . . 13
           Building a North East Link. . . . . . . . . . . . . . . . . . . . . . . . . . . . . . . . . . . . . . . . . . . . . . . . . . . . . . . . . . . . . . . . . . 14
           A congestion-busting plan for new highways and suburban arterial roads. . . . . . . . . . . . . . . . . . . . 15
           Jobs and labour capacity. . . . . . . . . . . . . . . . . . . . . . . . . . . . . . . . . . . . . . . . . . . . . . . . . . . . . . . . . . . . . . . . . . 15
           Community consultation. . . . . . . . . . . . . . . . . . . . . . . . . . . . . . . . . . . . . . . . . . . . . . . . . . . . . . . . . . . . . . . . . . 15
           Productivity and economic growth. . . . . . . . . . . . . . . . . . . . . . . . . . . . . . . . . . . . . . . . . . . . . . . . . . . . . . . . . 15
           Decentralising Victoria’s population . . . . . . . . . . . . . . . . . . . . . . . . . . . . . . . . . . . . . . . . . . . . . . . . . . . . . . . . 16
           Super Highway estimates. . . . . . . . . . . . . . . . . . . . . . . . . . . . . . . . . . . . . . . . . . . . . . . . . . . . . . . . . . . . . . . . . . 16

       A COMPREHENSIVE PLAN TO CUT CONGESTION . . . . . . . . . . . . . . . . . . . . . . . . . . . . . . 20
           Easing the squeeze. . . . . . . . . . . . . . . . . . . . . . . . . . . . . . . . . . . . . . . . . . . . . . . . . . . . . . . . . . . . . . . . . . . . . . . 20
           Getting Victoria Moving . . . . . . . . . . . . . . . . . . . . . . . . . . . . . . . . . . . . . . . . . . . . . . . . . . . . . . . . . . . . . . . . . . 20

       TRAFFIC LIGHT REMOVAL PROJECT. . . . . . . . . . . . . . . . . . . . . . . . . . . . . . . . . . . . . . . . . . . 21
           Benefits of trafficlight removals . . . . . . . . . . . . . . . . . . . . . . . . . . . . . . . . . . . . . . . . . . . . . . . . . . . . . . . . . . .  22
           Less congestion . . . . . . . . . . . . . . . . . . . . . . . . . . . . . . . . . . . . . . . . . . . . . . . . . . . . . . . . . . . . . . . . . . . . . . . . .  22
           Safer local roads . . . . . . . . . . . . . . . . . . . . . . . . . . . . . . . . . . . . . . . . . . . . . . . . . . . . . . . . . . . . . . . . . . . . . . . . .  22
           More jobs . . . . . . . . . . . . . . . . . . . . . . . . . . . . . . . . . . . . . . . . . . . . . . . . . . . . . . . . . . . . . . . . . . . . . . . . . . . . . . .  22
           Lower emissions . . . . . . . . . . . . . . . . . . . . . . . . . . . . . . . . . . . . . . . . . . . . . . . . . . . . . . . . . . . . . . . . . . . . . . . . .  22
           Building cities forthe future. . . . . . . . . . . . . . . . . . . . . . . . . . . . . . . . . . . . . . . . . . . . . . . . . . . . . . . . . . . . . . .  23

       MAP OF TRAFFIC LIGHT REMOVALS. . . . . . . . . . . . . . . . . . . . . . . . . . . . . . . . . . . . . . . . . . . 24

       CASE STUDIES . . . . . . . . . . . . . . . . . . . . . . . . . . . . . . . . . . . . . . . . . . . . . . . . . . . . . . . . . . . . . . . 27
           1. Princes Highway and Springvale Road. . . . . . . . . . . . . . . . . . . . . . . . . . . . . . . . . . . . . . . . . . . . . . . . . . .  27
           2. North Road and Nepean Highway. . . . . . . . . . . . . . . . . . . . . . . . . . . . . . . . . . . . . . . . . . . . . . . . . . . . . . . 29
           3. Lower Heidelberg Road and Banksia Street. . . . . . . . . . . . . . . . . . . . . . . . . . . . . . . . . . . . . . . . . . . . . . . 31
           4. Settlement Road and Barwon Heads Road . . . . . . . . . . . . . . . . . . . . . . . . . . . . . . . . . . . . . . . . . . . . . . 33

GetVictoriaMoving.com.au                                                                                                                                                                 –3–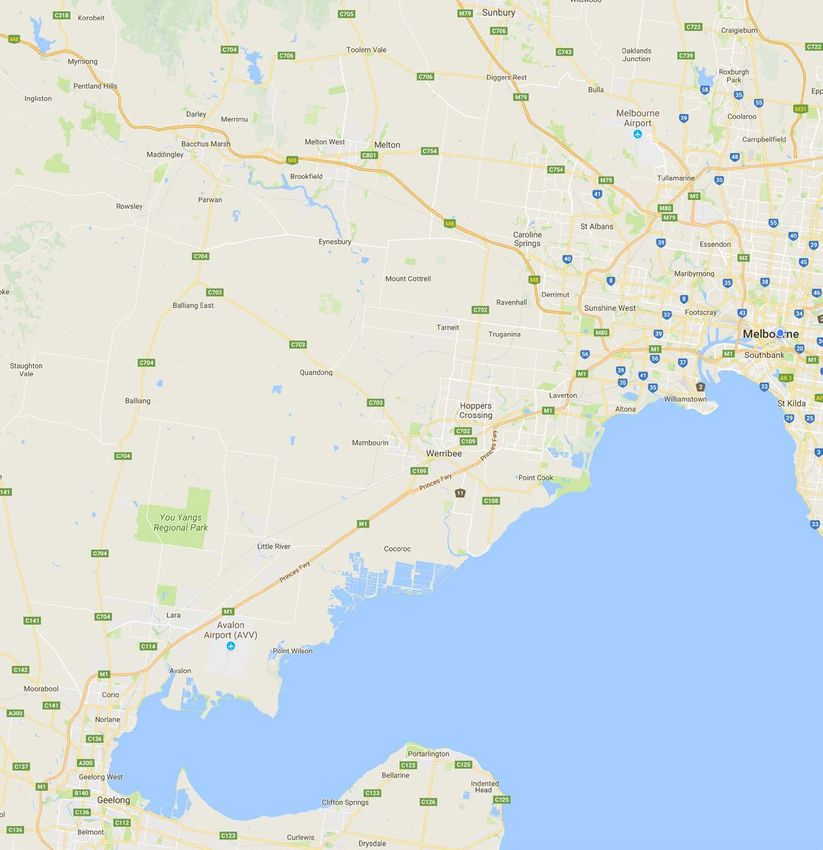
THE PROBLEM                                                              2014, Melbourne’s total population has surged by
                                                                         over 365,000 people – an 8.2% increase. That’s the
                                                                         equivalent of the entire population of Canberra
                                                                         moving into Melbourne in just over three years. It’s
Population growth                                                        no wonder Melburnians are feeling the pressure of
                                                                         this explosive population growth.
Latest statistics show Melbourne is overtaking
Sydney for the worst traffic congestion in Australia.                    Much of this unprecedented growth continues
Unless we take radical action now, traffic                               to occur in Melbourne’s urban fringe, which
congestion is expected to cost Melbourne’s                               exemplifies the type of population pressures our
economy up to a staggering $10.2 billion a year                          city is facing.
by 2030.
                                                                         For example, since 2001, the population of the
Melbourne’s crippling traffic congestion is due to                       City of Casey has increased by 146,936 people (or
our city’s unprecedented population growth. Since                        81.4%), Cardinia Shire by 55,796 people (119.4%),

                                                                                                    CHART    Projected
                       Greater Melbourne Population Growth                                            1      to eclipse
                                                                                                             10 million
                                                                                                              by 2050
          5 million

        4.5 million

          4 million

        3.5 million

          3 million

        2.5 million
                      2001 2002 2003 2004 2005 2006 2007 2008 2009 2010 2011 2012 2013 2011 2015 2016 2017     2050

                                                                                                                                –4–
Melton by 96,392 people (188.8%), and Wyndham           must be well placed to handle this activity as
  by 155,298 people (183.6%), to name but a few.          effectively as possible.

  These figures also show that Melbourne is one
  of the top ten fastest-growing major cities in the
  developed world – with a growth rate faster than
  Vancouver, Mexico City, London and New York.
                                                                      Victorian Registered Motor Vehicles
     Melbourne cannot                                     6 million
     continue growing at this                                                                                             CHART
                                                                                                                            2
     pace until our roads,                                5 million

     transport and services
     infrastructure catches up.                           4 million

  Increase in vehicles                                    3 million

  Because there’s a huge increase in population
                                                          2 million
  in recent years, there’s also been a corresponding
  huge increase in the number of vehicles on our
  roads.
                                                          1 million

  Conservative estimates indicate there’s an
  additional 512,000 vehicles on Victoria’s roads
  since 2012 – a staggering 11.9% increase.                           2001   2003   2005   2007   2009   2011   2013   2015   2017

  In combination with an additional 4.8 million train
  and 27.1 million tram passenger trips since 2014,
  Melbourne’s existing transport infrastructure
  network is now at the point where it struggles to
                                                          Congestion
  manage its fundamental role of getting people           The former Liberal Nationals Government built
  to and from work safely and efficiently, thus           and funded 13 level crossing removals from 2010 to
  impacting upon our city’s liveability and economic      2014 and that work has continued under the current
  productivity.                                           state Government.

  When it comes to economic productivity, it is not       The latest round of level crossing removals under
  just about moving everyday Melburnians across           the current government has received bipartisan
  the road network in a safe and efficient manner. It     support. The Liberal Nationals also helped pass
  is predicted that Victoria’s freight task will double   legislation that provided the funding for this
  by 2050, putting immense pressure on an already         important program.
  clogged network courtesy of more trucks than ever       However, congestion remains a massive problem
  being required to shift goods between the Port of       in Melbourne and our regional cities. And with
  Melbourne and the city’s industrial hubs.               Victoria’s population growing by over 100,000
                                                          people every year, traffic congestion will continue to
  Indeed, in line with strong population growth,          get a lot worse unless we invest in much more road
  throughput at the Port of Melbourne is expected         and transport infrastructure.
  to continue growing strongly. This will mean a
  significant increase in the current 10,000 heavy        Congestion means more time stuck in frustrating
  trucks trips a day which are required to service the    traffic which means less time with family and friends
  operations at the port.                                 and that has a big impact on our quality of life.
                                                          Congested roads are also very dangerous, especially
  With the efficient movement of freight                  at busy intersections where a combination of high
  being critical to Melbourne’s productivity,             volumes of vehicles and frustrated drives can be a
  connectedness and liveability, our road network         fatal combination.

GetVictoriaMoving.com.au                                                                                                             –5–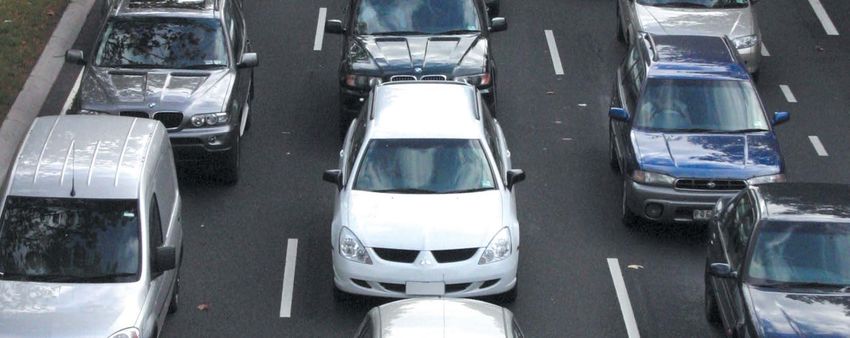
Median Traffic volumes in October 2017                                  Traffic congestion also affects our work lives and
Total Vehicle Movements in a 15 minute period                           means higher running costs for businesses and
    Weekday         Weekend                                             that means less money to invest in growth and
                                                                        create more jobs.
                                                           CHART
                                                             3          As Chart 3 shows, according to VicRoads data on
                                                                        traffic that passes through major intersections, on
                                                                        an average weekday in October 2017, up to
                                                                        2.5 million vehicle movements were recorded
                                                                        during the afternoon peak.

                                                                        Peak periods range from 6:30am to 9:30am in
                                                                        the mornings, and from 3:00pm until 6:15pm in
                                                                        the evenings.

                                                                        Outside of the morning and evening peaks,
                                                                        congestion is worse on weekends than it is on
                                                                        weekdays, with VicRoads recording 2 million
                                                                        vehicle movements during the average weekend
                                                                        lunch time peak.That’s why the Andrews
                                                                        Government’s decision to tear up the East West
                          Source: VicRoads Traffic Signal Volume Data
                                                                        Link contract at a cost to taxpayers of $1.3 billion
                                                                        to not build the road, makes no sense. If Daniel
                                                                        Andrews hadn’t cancelled the East West Link
   Congestion means more                                                contract, this vital piece of infrastructure would
                                                                        now be nearly built.
   time stuck in frustrating
   traffic which means less                                             Before the last election, Daniel Andrews said his
                                                                        $500 million Western Distributor project was
   time with family and friends.                                        ‘shovel ready’. But just a few months after the
                                                                        election, it was revealed that the cost had blown-out
                                                                        to $680 million and it wasn’t shovel ready, and years
                                                                        away from commencing construction.

                                                                        The Andrews Government then scrapped plans for
                                                                        the Western Distributor and instead accepted an
                                                                        unsolicited bid from Transurban to build the West
                                                                        Gate Tunnel, but to be funded by increasing the

                                                                                                                               –6–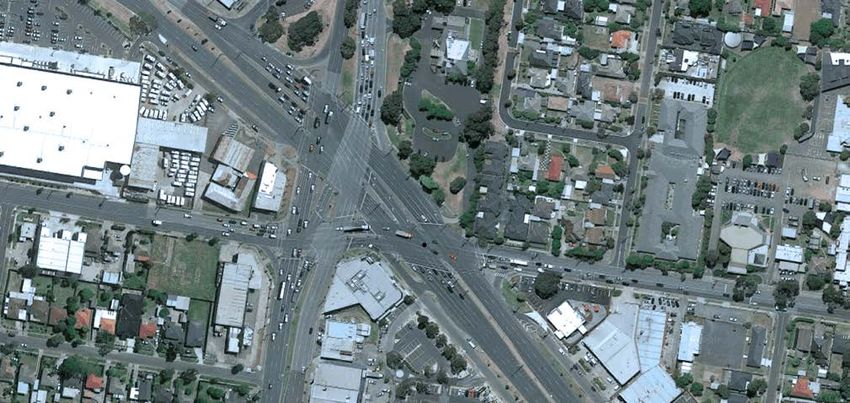
tolls on the Monash and Tullamarine Freeways. In
  other words, a road for the western suburbs would                 2016 ABS Census - Travel to work
  be funded by more tolls to be paid by motorists
  in the northern, the eastern and south-eastern                                   % of people who
  suburbs.                                                    LGA                  travelled to work by car
                                                                                   as driver or passenger
  Fixing public transport is an important part of
  building a city for the future. But the fact remains        Banyule              66.4%
  that 1.3 million Melburnians take a car to work every
  day, according to the most recent Census data. In           Bayside              63.4%
  other words, three quarters of Melburnians take a           Boroondara           57.4%
  car to work every single day.
                                                              Brimbank             75.1%

                                                              Cardinia             77.0%
  People who travel to work                                   Casey                79.2%
  by car                                                      Darebin              55.7%
  Three in every four people in Melbourne travel to           Frankston            78.5%
  and from work by car every day. That’s over 1.3
  million people, and it doesn’t include the hundreds         Glen Eira            61.1%
  of thousands of parents who are also on the road in
  the same periods doing the ‘school run’.                    Greater Dandenong    76.8%

  As the 2016 ABS census data opposite shows, the             Hobsons Bay          67.4%
  Melbourne average of 74% is higher in some LGAs.            Hume                 77.0%
  The City of Casey, in Melbourne’s south-east, is one        Kingston             71.5%
  of Australia’s biggest growth corridors where nearly
  80% of people travel to work by car every day.              Knox                 78.4%
  And while improved public transport services and
  infrastructure will encourage more patronage, the           Manningham           71.3%
  reality is it’s not going to result in a dramatic decline   Maribyrnong          56.6%
  in traffic.
                                                              Maroondah            73.7%

                                                              Melbourne            23.6%

                                                              Melton               78.2%
                                                              Monash               68.1%
                                                              Moonee Valley        63.2%

                                                              Moorabool            74.1%

                                                              Moreland             53.2%

                                                              Nillumbik            73.2%

                                                              Port Phillip         45.7%

                                                              Stonnington          47.7%

                                                              Whitehorse           64.6%

                                                              Whittlesea           76.9%

                                                              Wyndham              73.1%
                                                              Yarra                36.2%

GetVictoriaMoving.com.au                                                                                      –7–
Peak hours are busier                                      250 cars passing through this intersection every
                                                           15 minutes compared to three years ago. Similarly,
and longer                                                 at 6:15pm there is also an extra 250 cars every
                                                           15 minutes.
In the last three years alone, peak hour in Melbourne
and Geelong’s arterial roads have become busier
and longer.
                                                           Springvale Road/Dandenong Road
For example, Chart 4 for the intersection at               Median Traffic volumes in October 2014 and 2017
Springvale and Dandenong Roads from October                Total Vehicle Movements in a 15 minute period
2014 to October 2017, shows peak hour traffic has              2014       2017
increased by over 50% from 1,000 cars in every
15 minute period to about 1,600.                                                                                      CHART
                                                                                                                        4

Chart 4 also shows that the current length of peak
hour traffic in this particular case study of Springvale
and Dandenong Roads, extends by around 30
minutes in daily peak hour traffic compared to
October 2014.
But a concerning new trend is that congestion
in so-called non-peak periods is rapidly getting
worse – the fluctuations between peak and non-
peak in terms of the number of vehicles through
intersections is becoming shallower.
If this trend continues we could see a situation
where traffic volumes peak from early morning all
through the day to early evening.
                                                                                     Source: VicRoads Traffic Signal Volume Data
Another case study, the intersection of North and
Warrigal Roads also shows that over the last three
years, peak hour traffic is busier and extending for
longer, especially in the afternoon peak period.
In both daily peak periods, just over 1,500 cars are          We could see a situation
passing through this intersection every 15 minutes –
that’s 100 cars a minute.
                                                              where traffic volumes peak
Chart 5 shows that at the intersection of North
                                                              from early morning all through
and Warrigal Roads at 6:30am, there are an extra              the day to early evening.

                                                                                                                              –8–
North Road/Warrigal Road Tradies, couriers, salespeople and many others
Median Traffic volumes in October 2014 and 2017 in jobs that require travel on our roads know that
Total Vehicle Movements in a 15 minute period time stuck in traffic congestion means they aren’t
2014 2017 earning money. Inevitably, that cost is passed
onto consumers.
CHART
5 It also means that those small and large businesses
losing money due to reduced productivity because
of traffic congestion often can’t afford to expand and
employ more staff, or have to cut jobs to cut costs.
According to a 2015 report, ‘Traffic and congestion
cost trends for Australian capital cities’ by BITRE,
(Chart 4) the cost of congestion to the Victorian
economy will be $5.54 billion in 2018. The cost to
our economy is accelerating at such a pace that in
the following two years, that cost will increase by
almost another billion dollars.
By the end of the next term of government, that
annual cost will be a staggering $7.28 billion.
Source: VicRoads Traffic Signal Volume Data
These aren’t just figures on a spread sheet. These
Impact on people are lost jobs and lost opportunities for thousands
of Victorian small businesses, tradies, couriers
With Victoria’s population growing by well over and salespeople.
100,000 every year, there are more cars on the road
which means peak hour is getting longer and we are
spending more time frustrated in traffic.
The impact of increased travel time is being felt
across the board. People are leaving for work earlier Cost of Congestion
Year
and getting home later. It’s the same for parents ($ Billions)
who drop their kids off at school later in the morning 2011 $3.68
and pick them up again.
2012 $4.1
It wasn’t very long ago that people looked forward
2013 $4.45
to the relatively quiet traffic conditions of weekends.
But lately it feels as though weekend traffic is almost 2014 $4.55
as bad as weekday peak. 2015 $4.62
Victorians are wasting hours in congestion every 2016 $4.85
week. That’s time that could be better spent with
2017 $5.18
family and friends, enjoying recreational activities to
keep mentally and physically active, fit and healthy. 2018 $5.54
Traffic is also more unpredictable than ever. The 2019 $5.94
program to remove level crossings that was started 2020 $6.38
by the previous Liberal Nationals Government and
2021 $6.84
continuing under the current government, is helping
to reduce the unpredictability of traffic congestion, 2022 $7.28
but there is still much more to be done. 2023 $7.71
But we can all agree on one thing, that the rate of 2024 $8.12
growth of traffic congestion is unsustainable.
2025 $8.51
Impact on business
2026 $8.88
2027 $9.21
productivity and jobs 2028 $9.55
Our worsening traffic congestion isn’t just impacting 2029 $9.88
on our quality of life, it’s costing our economy and
it’s costing jobs. 2030 $10.19
GetVictoriaMoving.com.au –9–The costs to small Cost of congestion ($ billions)
business CHART
6
For smaller businesses, the costs of transporting
goods and services can be the difference between
making a profit or a loss. It can be the difference
between growth and stagnation.
If courier and road transport costs continue to
skyrocket because of worsening congestion, that is
going to have a big impact on businesses and jobs
in Victoria.
Victorians are wasting
hours in congestion every
week. That’s time that could
be better spent with family
and friends.
Source: BITRE “Traffic and congestion cost
trends for Australian capital cities” (2015)
By the end
of the next
term of
government,
the annual
cost of
congestion
will be a
staggering
$7.28 billion.
– 10 –GET
VICTORIA
MOVING
A Super Highway for Melbourne
– Building an East West Link
and a North East Link
GetVictoriaMoving.com.au – 11 –An East West Link + A North East Link
– 12 –A ‘SUPER HIGHWAY’ In our first 100 days of government a North East
Link Authority will be re-tasked to manage the
delivery of both an East West Link and a North East
A Liberal Nationals Government will build the Link.
biggest connected super highway in Australia and
get Victoria moving again.
A Liberal Nationals Building an East West Link
Government will build an A Liberal Nationals Government will build an East
West Link so we can fix the end of the Eastern
East West Link AND a North Freeway before completing the construction of
East Link, developed in a North East Link which will put an extra 100,000
more cars on to the Eastern Freeway.
tandem with both expected Daniel Andrews wants to build his North East Link
to be completed in 2026 without fixing the Eastern Freeway and that’s a plan
and 2027 respectively. for 24 hour gridlock.
Previous Labor and Liberal Nationals Governments
Melbourne is jam-packed have recognised the need to complete the missing
links in Melbourne’s freeway system to transform it
Melbourne’s population is about to hit the 5 million into a true continuous orbital network.
mark and it’s growing by over 120,000 people every
single year. That’s more than the equivalent of the Since 2008 when the Brumby Labor Government-
city of Ballarat moving into Melbourne each year. commissioned the East West Link Needs
Assessment report, this road has been identified
We need to stop playing catch-up with as an essential missing piece of infrastructure to
infrastructure and start getting ahead. improve passenger vehicle and freight linkages
Recent reports indicate that Melbourne has now between Melbourne’s eastern, northern and
taken the mantle as Australia’s most congested city western suburbs.
and the fifty-eighth most congested city globally.
Under the Liberal Nationals plan construction on an
That’s why we have a plan for building a new East West Link will commence in 2020-21 following
Super Highway and unclogging our arterial final determination of the route in consultation
roads through the removal of 55 of our busiest with the Office of Projects Victoria. It is expected
intersections - the biggest combined congestion- that construction of an East West Link will be fully
busting project in Australia. completed in 2026.
GetVictoriaMoving.com.au – 13 –Metropolitan
Ring Road
Building an East
West Link and a
North East Link to
create Australia’s North East
biggest ‘Super Link
Highway’ for
Australia’s fastest
growing city. City Link
Central route option
Eastern
East West Freeway
Link
Southern route option
West Gate Monash
Tunnel Freeway
A Liberal Nationals Government will consult with the The review would also look at consultation work
Office of Projects Victoria on two proposed routes undertaken to address community concerns
for an East West Link. about the impacts on property, land use and loss
of parkland.
The first proposed route is through a central corridor
broadly connecting from the Eastern Freeway The recommendations of this review are likely to
through to CityLink north of the City. see changes to improve the current design such
as tunnel length, interchange design, property
The second proposed route is through a southern acquisitions and protecting parkland.
corridor connecting from the Eastern Freeway
through to the Westgate Tunnel. A Liberal Nationals Government will also assess
the current procurement strategy and phasing of
The construction of the West Gate Tunnel makes
key North East Link project components such as
this southern corridor option a consideration as it
staging the procurement to ensure that the project
otherwise provides for the Western Interchange
is delivered in an economically responsible way.
and integration with CityLink despite the
comparatively longer tunnel length to the southern This will also allow a Liberal Nationals Government
corridor configuration. to ensure that the staging of a North East Link and
an East West Link is economically and logistically
Daniel Andrews and Labor don’t support an East
efficient.
West Link and wasted $1.3 billion of taxpayers’
money when he tore up the contract after A Liberals National Government will build an East
promising voters it wasn’t worth the paper it was West Link so we can fix the end of the Eastern
written on. If an East West Link project went ahead Freeway before completing the construction of
it would now be almost complete and a North East Link which will put an extra 100,000
ready for a North East Link to connect to the more cars on to the Eastern Freeway.
Eastern Freeway.
Daniel Andrews wants to build his North East Link
without fixing the Eastern Freeway and that’s a plan
for 24 hour gridlock.
Building a North East Link
In tandem with the construction of an East West Under the Liberal Nationals
Link, a Liberal Nationals Government will continue
with the development of a North East Link plan, both an East West Link
consistent with the current timeline but including an
immediate review to improve the design, including
and a North East Link would
portal location and property acquisitions. be developed in tandem.
GetVictoriaMoving.com.au – 14 –A congestion-busting plan weighed down by Daniel Andrews’ 12 new taxes and
over $24 billion in budget blowouts. The Victorian
for new highways and economy needs this sort of turbo-charged super-
project to get people out of the unemployment
suburban arterial roads queues and back into work.
Census data shows that 74% of Melburnians take Consistent with the current North East Link business
a car to work every day. That’s why more of Daniel case, this component of our super-project will
Andrews and Labor’s band-aid approach to roads create just over 10,300 jobs during construction.
won’t cut it anymore.
Construction of an East West Link will create
Only the Liberal Nationals have a comprehensive between 3,500 and 4,500 jobs depending on the
congestion-busting plan for Melbourne’s highways final alignment and tunnel length.
and arterial roads.
The traffic light intersection removal project will
Only the Liberal Nationals will remove traffic lights create an estimated 5,000 jobs.
and roundabouts through grade separations at 55 of
Melbourne and Geelong’s busiest, most congested The investments in these projects over construction
intersections. years will also generate thousands more indirect
jobs as well as a significant number of new
Only the Liberal Nationals will deliver a record apprenticeships.
number of jobs in the construction of an East
West Link, a North East Link and the removal of 55 These projects will also have significant support
congested suburban intersections. for regional Victoria supplying materials for
construction such as Benalla and Kilmore.
Melbourne’s population is about to hit the 5 million
mark. Melbourne cannot continue growing at
this pace until our roads, transport and services
infrastructure catches up. Community consultation
Melburnians have never before felt under so much In our first 100 days of government the North East
pressure. We are spending more time at work, more Link Authority will be re-tasked to manage the
time stuck in traffic and less time with family and delivery of both an East West Link and a North East
friends. Link projects and asked to review the community
consultation work undertaken with a particular focus
Traffic congestion makes our roads dangerous for
on community concerns about the impacts on
all road users. Traffic congestion costs our economy
property, land use and loss of parkland.
around $5.54 billion a year. Traffic congestion
causes delays and frustrations which means we In determining the final route for an East West Link,
have less time to spend with family and friends. a Liberal Nationals Government will work with the
Office of Projects Victoria to assess which option
We can’t keep playing this game of infrastructure
will cut congestion and improve traffic flow, reduce
catch-up. We have no time to lose to start getting
property acquisitions and provide the best value
ahead.
for taxpayers. Assessments will also be made on
the best option from an environmental perspective
Jobs and labour capacity including parkland impacts and consequent
cuts in exhaust fumes by removing traffic light
The Liberal Nationals biggest congestion-busting intersections. A critical part of that process will
new highway and arterial road projects in Australian include community consultation.
history will create an estimated 19,000 jobs.
Under the Andrews Labor Government, Victoria’s
unemployment rate has been consistently higher Productivity and
than New South Wales. For 18 consecutive months
in 2017 and 2018, Victoria’s unemployment rate was economic growth
higher than the national average.
A report by the Bureau of Infrastructure, Transport
The New South Wales economy continues to stride and Regional Economics shows that the cost of
ahead while Victoria remains at the back of the pack congestion in Victoria will be $5.54 billion in 2018.
GetVictoriaMoving.com.au – 15 –By 2022 that annual cost will be a staggering health and education services and good job
$7.28 billion a year. opportunities in the regions. We can’t just hope
people will want to live and work in the regions, the
We have no time to lose. Every year wasted by not state government must provide incentives like great
building this super-infrastructure will have the effect jobs, services and infrastructure.
of putting a handbrake on our economy.
There are hundreds of thousands of jobs that
are affected by congested roads that impact on
productivity. Time stuck in traffic congestion means
Super Highway estimates
they aren’t earning money. The Liberal Nationals will allocate at least $2 billion
as initial funding from the Victorian Government
That lost time and the cost of that is passed onto
towards the construction of an East West Link and a
consumers or these small businesses are required to North East Link during the next term.
let staff go to keep costs down.
It is anticipated that further monies may be needed
In the case of Victorian retailers, transport and in future forward estimates.
courier costs represent a significant component
of their business costs. When growing traffic Further funding will be provided by the Australian
congestion results in higher transport costs, Government, with contributions of $3 billion and
retailers have little choice to either pass on the cost $1.75 billion expected towards an East West Link
to customers or reduce staff costs. Victorians are and a North East Link respectively.
already facing enormous cost of living pressures
and can’t afford to be paying more for goods and Unlike Daniel Andrews and Labor, we will not
services because retailers have to pass on extra increase tolls on any existing roads or increase tolls
freight costs. on existing roads, including the Eastern Freeway, to
fund the construction of the Super Highway.
Cutting traffic congestion with new highways
and removing 55 of Melbourne and Geelong’s The final contracting strategy and project staging
most congested intersections, will result in more of both an East West Link and a North East Link
efficient transport of goods and services which will will be informed by the Office of Projects Victoria’s
boost productivity and keep business costs more review and analysis. This will also inform any
competitive and allow businesses to grow and additional financial contributions from the Victorian
employ more staff. Government for build completion. This will ensure
that both Links are built efficiently and provide
value-for-money for Victorians.
Decentralising Victoria’s
population
The Liberal Nationals plan to ease the squeeze on
Melbourne’s population growth will improve quality
of life for Victorians that spend too much time in
congestion and promote economic productivity
and growth.
The Liberal Nationals vision to manage Melbourne’s
surging population growth focuses on a growing
economy with more and better jobs for the regions,
better urban and regional roads and public transport
and more health and education services across all
of Victoria.
Victoria’s population has grown by over 400,000
since Daniel Andrews was elected but he still
doesn’t have a plan to decentralise our population.
The Liberal Nationals are committed to creating
push and pull factors like better infrastructure,
GetVictoriaMoving.com.au – 16 –We need
to stop playing
catch-up with
infrastructure
and start
getting ahead.
GetVictoriaMoving.com.au – 17 –– 18 –
GET
        VICTORIA
        MOVING
        Traffic light removal project
        – Fixing 55 of Melbourne and Geelong’s
          busiest, most congested intersections

GetVictoriaMoving.com.au                           – 19 –
A COMPREHENSIVE Recently released census data shows that 74% of
Melburnians take a car to work every day. Despite
PLAN TO CUT the level crossing removal program’s benefits to
traffic along Melbourne’s train lines, over one million
CONGESTION people continue to sit in gridlocked traffic on other
parts of the road network.
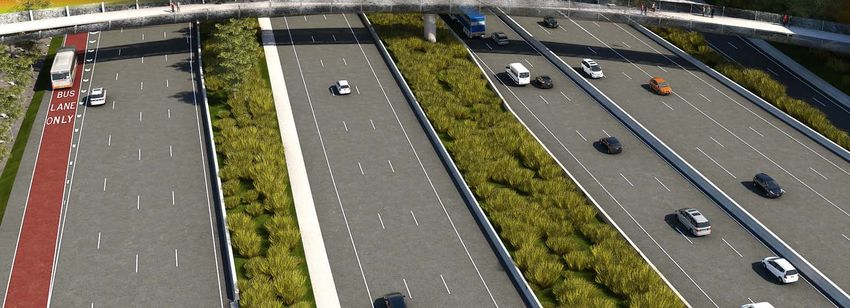
Removing traffic lights or That means tradies, couriers and salespeople are
roundabouts with grade–separations losing money while sitting in gridlock. It means
at busy and congested intersections mums and dads spending more time on their
Better and more reliable public commute and less time at home with their families.
transport
Level crossing removals
Traffic signal systems will be Getting Victoria Moving
modernised to ensure traffic flow Our Plan will help to fix that. It will ease the squeeze
is optimised on corridors where on our roads. it will make our roads safer. It will make
intersections are removed our roads more efficient for those who use them
to do business. Our plan will create thousands of
jobs in the construction phase. It will accommodate
Easing the squeeze Melbourne’s ongoing population growth. Itwill help
mums and dads get home quicker. And our Plan will
Bottlenecks on our arterial roads are choking get Melbourne and Geelong moving.
Melbourne and Geelong.
At the next election, Victorians will have a clear
That’s why I’ve developed a new plan to ease the choice. They can choose more of the same
squeeze on our most congested arterial roads. from Daniel Andrews or they can choose our
comprehensive plan to relieve traffic congestion
Everyone agrees the removal of level crossings will
across the state.
help to free up Melbourne’s traffic congestion, but
it’s only part of the solution. There’s only one certainty. If you are stuck with
Daniel Andrews, you are going to be stuck in traffic.
Another key part is to remove Melbourne’s most People often comment that Melbourne is a city with
congested and frustrating traffic intersections, 1980’s infrastructure but with a 2017 population. My
using grade–separations. Preference for grade– vision is to make a city with 2050 infrastructure and
separations will be an underpass construction with a 2020 population.
consultation with the community, local government
and engineering experts, determining the final Better public transport is important, but as the
design. The grade-separation configurations will be most recent census data shows, 74% of Melburnians
a closed diamond model of intersection removal. take a car to work every day – that’s 1.3 million
These will not be freeway style, clover interchanges. people on the roads travelling to and from work
every single day.
As part of this project, traffic signal systems will be
modernised to ensure traffic flow is optimised on That number is only going to continue to grow as
corridors where intersections are removed. our population grows.
That’s why we are And whilst the bipartisan level crossing removal
program is an important tool in the toolbox for
committing between decongesting Melbourne traffic, it is only relevant
$4.1 billion to $5.3 billion to those roads along the rail corridors. There are
many congested suburbs throughout Melbourne
to remove traffic lights and Geelong that will not benefit from level
from 55 of Melbourne’s crossing removals.
busiest, most congested That’s why we need a plan that goes much further
and builds on the level crossing removals done by
intersections. the former and current governments.
GetVictoriaMoving.com.au – 20 –To get Melbourne and Geelong traffic flowing again for grade–separation, which will remove traffic lights
we have a comprehensive plan that includes better and allow arterial roads traffic to flow.
and more reliable public transport, new freeway
Over the next 12 months our team will continue
infrastructure like an East West Link, level crossing
to study the comprehensive VicRoads data as
removals and grade–separations at our busiest and
well as working with local communities to identify
most congested intersections.
the remaining 20 of 55 traffic light intersections to
Preference for grade-separations will be an be removed.
underpass construction with consultation with the
community, local government and engineering Our consultation process
experts, determining the final design.
will include listening to
The grade-separation configurations will
be a closed diamond model of intersection
local people about their
removal. These will not be freeway style, clover concerns about traffic
interchanges.
congestion in their area.
The Liberal Nationals are committed to a
comprehensive plan to tackle Melbourne and We will also be listening to community leaders,
Geelong’s crippling congestion problem. This stakeholders and third-parties for their insights
plan will include finishing the level crossing and ideas.
program that started under the former Liberal Preference for grade–separations will be an
Nationals Government and is continuing under underpass construction with consultation with the
the current Government. This multifaceted strategy community, local government and engineering
to cut congestion also includes improving public experts, determining the final design.
transport and building new freeways like East
West Link. Following consultations, we will continue to
announce the details of the remaining 20 locations
in addition to the 35 already nominated.
TRAFFIC LIGHT
As part of this project, traffic signal systems will be
modernised to ensure traffic flow is optimised on
REMOVAL PROJECT corridors where intersections are removed
The Liberal Nationals team has identified 35 of
Victoria’s worst and most congested intersections
– 21 –Benefits of traffic More jobs
light removals In 2017, Victoria has recorded some of the worst
unemployment figures of any state.
Less congestion
At the time of this policy launch, Victoria’s
Safer local roads unemployment rate is 1.1% greater than NSW’s.
More jobs This major infrastructure project is estimated
Productivity and economic growth to create around 5,000 new jobs in addition to
indirect jobs.
Building for the future
Lower emissions
Less congestion
There is a direct correlation between heavy traffic
Removing Victoria’s 55 worst intersections by congestion, high fuel consumption and emissions.
building grade–separation that removes traffic
lights will keep traffic flowing and reduce frustrating The start and stop nature of heavy traffic congestion
bottlenecks on arterial roads. on our suburban roads means higher fuel
consumption and that means higher emissions.
Removing traffic lights at these busy intersections
through grade–separations will significantly cut A road network that cuts congestion and ensures
peak hour travel times for the 74% of Melburnians more free-flowing traffic, reduces fuel consumption
who take a car to and from work and parents who and pollution from emissions.Productivity and
do the daily school run. economic growth
Removing our 55 worst intersections will complement A report by BITRE shows that the cost of congestion
the level crossing removals program by significantly in Victoria will be $5.54 billion in 2018.
reducing traffic bottlenecks across Melbourne. The
effect will be faster moving traffic that helps motorists By the end of the next term of government (2018-
move around the city more efficiently. 2022), that annual cost will be a staggering $7.28
billion a year.
That’s why we have no time to lose and take
Safer local roads decisive action.
Removing traffic lights at congested intersections
will mean safer roads and reduce the number of
There are hundreds of
accidents and injuries on these busy roads. thousands of jobs that
Congested traffic intersections, particularly are affected by congested
where motorists are making left or right turns, are
dangerous and sometimes fatal. Many accidents are
roads impacting
the result of errors in judging oncoming traffic, or on productivity.
driver frustration caused by congestion.
Tradies, couriers, salespeople and others that
Sadly, in recent years in Victoria there hasn’t been require travel on our roads need to get between jobs
the sort of continuing decline in road fatalities efficiently. Time stuck in traffic congestion means
that we have seen in recent decades. Whilst there they aren’t earning money. Inevitably, that cost is
are many reasons for this tragic trend, there is no passed onto consumers or these small businesses
doubt that congestion and errors caused by driver are required to cut jobs to keep costs down.
frustration are a contributing factor.
Traffic congestion also results in lost opportunities.
Building more freeways and removing traffic lights
Reduced productivity due to traffic congestion
at intersections will make our roads safer.
prevents small and medium sized businesses from
expanding and employing more staff.
For Victorian retailers, transport and courier costs
GetVictoriaMoving.com.au – 22 –are a significant proportion of their business costs.
When increasing traffic congestion results in higher
transport costs, retailers are likely to pass on the
cost to customers or reduce staff costs.
Cutting traffic congestion will result in more
efficient transport of goods and services
throughout Melbourne and regional cities which
will boost productivity, keep business costs more
competitive, and allow businesses to grow and
employ more staff.
Building cities for
the future
The Liberal Nationals plan to ease the squeeze
on Melbourne’s population growth will improve
quality of life for Victorians and promote economic
productivity and growth.
Today, Melbourne’s ageing road infrastructure
is struggling under the weight of our growing
population. We need an ambitious program of
road infrastructure construction that will service
Melbourne’s growing population for tomorrow.
This $4.1 billion to
$5.3 billion construction
and jobs program will
remove 55 of our most
dangerous and congested
suburban intersections.
– 23 –MAP OF TRAFFIC
LIGHT REMOVALS
7
9
8
10
12
5
6
4
3
25
26
GET
VICTORIA
MOVING
Traffic light removal project
– fixing 55 road intersections
1 2
– 24 –Traffic Light Removal Program
1 Torquay Road and Settlement Road, Belmont
2 Barwon Heads Road and Settlement Road, Belmont
3 Point Cook Road and Princes Hwy, Point Cook
4 Geelong Road and Somerville Road, West Footscray
5 Ballarat Road and McIntyre Road, Sunshine
6 Ballarat Road and Geelong Road, Footscray
7 Gap Road and Horne Street, Sunbury
8 Mickleham Road and Broadmeadows Road, Gladstone Park
11
9 Sydney Road and Cooper Street, Somerton
10 Sydney Road and Mahoneys Road, Campbellfield
11 Plenty Road and McDonalds Road, South Morang
12 St Georges Road and Bell Street, Preston
13 Albert Street and Bell St, Preston
15 14 Banksia Street and Lower Heidelberg Road, Heidelberg
13 16 15 Fitzsimons Lane and Main Road, Eltham
14 16 Fitzsimons Lane and Porter Street, Templestowe
17
17 Williamsons Road and Foote Street, Templestowe
18 Whitehorse Road and Springvale Road, Nunawading
19 Springvale Road and Burwood Hwy, Vermont South
18
20 Springvale Road and Ferntree Gully Road, Glen Waverley
21 Princes Hwy, Springvale Road and Police Road, Mulgrave
19 22 Stud Road and Wellington Road, Rowville
23 Princes Hwy and North Road, Clayton
24 Dandenong Road and Warrigal Road, Oakleigh
24
6 20 25 Nepean Hwy and Glenhuntly Road, Elsternwick
23 26 Nepean Hwy and North Road, Brighton East
27 21 22 27 Nepean Hwy and South Road, Bentleigh
28
28 Warrigal Road and South Road, Moorabbin
29 Nepean Hwy, Warrigal Road, Lower Dandenong Road, Mentone
29 31 30 Boundary Road and Governor Road, Mordialloc
31 Heatherton Road and Hallam Road, Endeavour Hills
30 32 Racecourse Road and Bald Hill Road, Pakenham
33 Thompsons Road and Western Port Hwy, Lyndhurst
34 Hall Road and Western Port Hwy, Cranbourne West
35 Moorooduc Hwy and Cranbourne Road, Frankston
33
32
34
Another 20 intersections will be identified following
community consultation and feedback. You can have your
35 say on which intersection you think needs to be fixed at:
GetVictoriaMoving.com.au
GetVictoriaMoving.com.au – 25 –GET VICTORIA MOVING
Giving you...
More time
to spend
with family
and friends.
GetVictoriaMoving.com.au – 26 –Case Study 1
The intersection of Princes Highway and Springvale Road, Mulgrave
Case Study 1 the weekends, see Chart 9.
Throughout October 2017, including weekends,
more traffic passed through this intersection than
The intersection of Princes on the average day in October 2014. On Fridays, the
Highway and Springvale Road volume of traffic is more than 80% greater than it
was three years ago (Chart 10).
is located in Melbourne's
South-East. Princes Highway/Springvale Road, Mulgrave
Number of crashes by year
Dangerous CHART
5
Between January 2006 and October 2017, there
have been 161 crashes at the Springvale Road &
Princes Highway intersection.
88 people have been seriously injured in crashes at
this intersection in this period and 164 people have
received other injuries.
Despite ongoing road safety initiatives over the
past decade, the number of crashes by year has
remained consistent, see Chart 7.
Congested
Although traffic in the very early morning has
decreased through this intersection, peak
period congestion has increased substantially,
as demonstrated in Chart 10, which shows the
average number of vehicles using the intersection 88 people have been
in each fifteen-minute period throughout the day,
contrasting the average traffic volumes in 2014 seriously injured at this
(blue) and 2017 (red). intersection and 164 people
Traffic has also substantially increased on have received other injuries.
– 27 –Princes Highway/Springvale Road, Mulgrave
CHART
8 Median Traffic volumes in October 2014
and 2017
Total Vehicle Movements in
a 15 minute period (weekdays)
2014 2017
Princes Highway/Springvale Road
CHART
9 Median Traffic volumes in October 2014
and 2017
Total Vehicle Movements in
a 15 minute period (weekends)
2014 2017
Princes Highway/Springvale Road, Mulgrave
CHART
10 Total Daily Traffic in October 2017
Sources: VicRoads Traffic Signal Volume Data
GetVictoriaMoving.com.au – 28 –Case Study 2
The intersection of North Road and Nepean Highway
Case Study 2 Throughout October 2017, the median daily
volume of traffic passing through this intersection
was approximately 7% greater than it was three
years ago, an increase of more than 2% per year
The intersection of North Road (Chart 14).
and Nepean Highway is located
in Melbourne’s South. North Road/Nepean Highway, Gardenvale
Number of crashes by year
Dangerous CHART
11
Between January 2006 and October 2017, there
have been 24 crashes at the North Road & Nepean
Highway intersection.
13 people have been seriously injured in crashes at
this intersection in this period and 13 people have
received other injuries.
Despite ongoing road safety initiatives over the
past decade, the number of crashes by year has
remained consistent, see Chart 11.
Congested
As demonstrated in Chart 12, the traffic volumes
at this intersection have increased slightly
during morning peak, however are much higher
throughout the day and in the afternoon peak
period. The plot compares the average number
of vehicles using the intersection in each fifteen- 13 people have been
minute period throughout the day, contrasting the
average traffic volumes in 2014 (blue) and 2017 (red). seriously injured at this
Traffic has also increased on the weekends, see
intersection and 13 people
Chart 13. have received other injuries.
– 29 –North Road/Nepean Highway,
CHART
12 Gardenvale
Median Traffic volumes in October
2014 and 2017
Total Vehicle Movements in a
15 minute period (weekdays)
2014 2017
North Road/Nepean Highway,
CHART
13 Gardenvale
Median Traffic volumes in October
2014 and 2017
Total Vehicle Movements in a
15 minute period (weekends)
2014 2017
North Road/Nepean Highway,
CHART
14 Gardenvale
Total Daily Traffic in October 2017
Sources: VicRoads Traffic Signal Volume Data
GetVictoriaMoving.com.au – 30 –Case Study 3
The intersection of Lower Heidelberg Road & Banksia Street
Case Study 3
The intersection of Lower Lower Heidelberg Road/Banksia Street, Heidelberg
Number of crashes by year
Heidelberg Road and
Banksia Street is located in CHART
15
Melbourne’s inner North-East.
Dangerous
Between January 2006 and October 2017, there
have been 38 crashes at the Lower Heidelberg Road
& Banksia Street intersection.
13 people have been seriously injured in crashes at
this intersection in this period and 42 people have
received other injuries.
Congested
As demonstrated in Chart 16, the traffic volumes
at this intersection have increased slightly during
morning peak and afternoon peak, and are higher
throughout the day. The plot compares the average
number of vehicles using the intersection in
each fifteen-minute period throughout the day,
contrasting the average traffic volumes in 2014
(blue) and 2017 (red).
The volume of traffic was also higher on weekends
during October, compared to three years ago, see
Chart 17. 13 people have been
Throughout October 2017, the median daily seriously injured at this
volume of traffic passing through this intersection
was approximately 5.3% greater than it was three
intersection and 42 people
years ago (Chart 18). have received other injuries.
– 31 –Lower Heidelberg Road/Banksia Street,
CHART
16 Heidelberg
Median Traffic volumes in October
2014 and 2017
Total Vehicle Movements in a
15 minute period (weekdays)
2014 2017
Lower Heidelberg Road/Banksia Street,
CHART
17 Heidelberg
Median Traffic volumes in October
2014 and 2017
Total Vehicle Movements in a
15 minute period (weekends)
2014 2017
Lower Heidelberg Road/Banksia
CHART
18 Street, Heidelberg
Total Daily Traffic in October 2017
Sources: VicRoads Traffic Signal Volume Data
GetVictoriaMoving.com.au – 32 –Case Study 4
The intersection of Settlement & Barwon Heads Roads
Case Study 4
The intersection of Settlement Settlement Road/Barwon Heads Road, Belmont
Number of crashes by year
and Barwon Heads Roads is
located in Geelong. CHART
19
Dangerous
Between January 2006 and October 2017, there
have been 49 crashes at the Settlement & Barwon
Heads Roads intersection.
16 people have been seriously injured in crashes at
this intersection in this period and 50 people have
received other injuries.
Congested
As demonstrated in Chart 20, the traffic volumes
at this intersection have increased slightly during
morning peak and afternoon peak, and are higher
throughout the day. The plot compares the average
number of vehicles using the intersection in
each fifteen-minute period throughout the day,
contrasting the average traffic volumes in 2014
(blue) and 2017 (red).
Throughout October 2017, the median daily
volume of traffic passing through this intersection
was approximately 4% greater than it was three 16 people have been
years ago. seriously injured at this
intersection and 50 people
have received other injuries.
– 33 –Settlement Road/Barwon Heads Road,
CHART
20 Belmont
Median Traffic volumes in October
2014 and 2017
Total Vehicle Movements in a
15 minute period (weekdays)
2014 2017
Settlement Road/Barwon Heads Road,
CHART
21 Belmont
Median Traffic volumes in October
2014 and 2017
Total Vehicle Movements in a
15 minute period (weekends)
2014 2017
Settlement Road/Barwon Heads
CHART
22 Road, Belmont
Total Daily Traffic in October 2017
Sources: VicRoads Traffic Signal Volume Data
GetVictoriaMoving.com.au – 34 –GET VICTORIA MOVING
Giving you...
More time for
the next job.
– 35 –GetVictoriaMoving.com.au – 36 –
GetVictoriaMoving.com.au – 37 –
For more information go to GetVictoriaMoving.com.au
Office of the Leader of the Opposition
Level 1, 157 Spring Street, Melbourne Victoria 3002

Authorised and printed by N Demiris, 104 Exhibition Street, Melbourne Victoria 3000.
You can also read