Global climate action from cities, regions, and businesses - NewClimate Institute
←
→
Page content transcription
If your browser does not render page correctly, please read the page content below
Global climate action from cities,
regions, and businesses
Taking stock of the impact of individual actors and
cooperative initiatives on global greenhouse gas
emissions. 2021 edition

Technical annex I: Methodology for quantifying the
potential impact of individual actors’ commitments

Suggested citation:

NewClimate Institute, Data-Driven EnviroLab, Utrecht University, German Development
Institute/Deutsches Institut für Entwicklungspolitik (DIE), CDP, Blavatnik School of Government,
University of Oxford. Global climate action from cities, regions and businesses. 2021 edition. Research
report prepared by the team of: Takeshi Kuramochi, Sybrig Smit, Frederic Hans, Julia Horn, Katharina
Lütkehermöller, Leonardo Nascimento, Julie Emmrich, Niklas Höhne, Angel Hsu, Brendan Mapes,
Xuewei Wang, Mark Roelfsema, Sander Chan, Andrew Deneault, Bianca de Souza Nagasawa, Mishel
Mohan, Megan Whitney, Johannes Brehm, Jonathan Hassel, Andrew Clapper, Abhishek Hiremath,
Thomas Hale. Technical Annex I.

     Download the report
     http://newclimate.org/publications/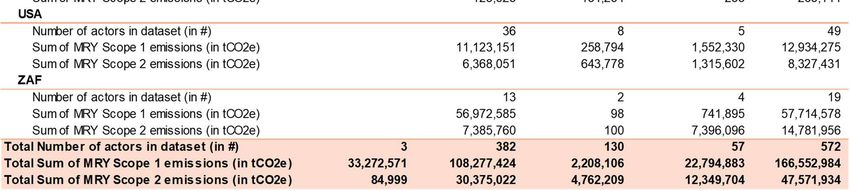
Table of contents
Table of contents ...................................................................................................................................... i
1     Datasets used in the analysis ........................................................................................................... 2
      1.1       Overview of data .................................................................................................................... 2
      1.2       Subnational actions ............................................................................................................... 4
      1.3       Companies’ actions ............................................................................................................... 6
2     Quantification of greenhouse gas (GHG) emissions reductions at national level ............................ 9
3     Individual actors aggregation: country results ................................................................................ 11
      3.1.1 Brazil .................................................................................................................................... 11
      3.1.2 Canada ................................................................................................................................ 12
      3.1.3 China ................................................................................................................................... 13
      3.1.4 European Union (EU27) + United Kingdom ........................................................................ 14
      3.1.5 India ..................................................................................................................................... 15
      3.1.6 Indonesia ............................................................................................................................. 16
      3.1.7 Japan ................................................................................................................................... 17
      3.1.8 Mexico ................................................................................................................................. 18
      3.1.9 South Africa ......................................................................................................................... 19
      3.1.10 United States ....................................................................................................................... 20
References ............................................................................................................................................ 22

                                                                                                                                                       i
1 Datasets used in the analysis
The analysis covers commitments from individual actors that have set quantitative greenhouse gas
(GHG) emissions reduction targets, and for which historical emissions data is available. The emissions
trajectories for non-state and subnational actors with commitments are developed based on the data
provided by CDP for companies and by Data-Driven Lab, with data from the Alliance of Peak Pioneering
Cities, Global Covenant of Mayors for Climate & Energy, Global Covenant of Mayors for Climate &
Energy (EU Secretariat), CDP Cities, CDP States and Regions, ICLEI carbonn® Climate Registry, C40
Cities Climate Leadership Group, Under2 Coalition, We Are Still In, United States Climate Mayors, and
United States Climate Alliance, for sub-national actors. For sub-national actors, these datasets were
further supplemented by additional data collection from websites of individual subnational governments
(see Section 1.2). Our analysis covers quantifiable emissions reduction commitments from over 1,929
cities, more than 125 regions, and approximately 800 companies operating in the ten major emitting
economies.
Direct emissions (Scope 1) and indirect emissions from electricity generation (Scope 2) are included in
the analysis for individual actors. Commitments' impact on supply chain emissions (Scope 3) are
excluded from the analysis if they make up the entirety of the commitment. While Scope 3 emissions
are significant for most companies, it was not possible to quantify the overlaps between Scope 1 and 2
emissions and Scope 3 emissions across actors, nor to localize these emissions to specific geographies
given current data availability. We include commitments with a combination of Scope 1 and 2 emissions
and Scope 3 emissions, although the impact of this assumption on the obtained results are likely limited
since there are only 98 companies with this type of commitment in our dataset. For cities and regions,
only 105 cities and 4 regions reported Scope 3 emissions in their inventories, so we did not assess them
in this study.
1.1 Overview of data
Our analysis considered approximately quantifiable emissions reduction commitments from 1,929 cities,
125 regions, and approximately 800 companies. The emissions inventory totals used for the calculations
were mostly self-reported by entities through one of the above-mentioned reporting platforms. Data for
quantifiable climate commitments came from the sources presented in Table 1.
2Table 1: Data sources for individual subnational and non-state actor commitments
Climate Action
Data source
Platform
Alliance of Peaking Alliance of Peaking Pioneer Cities of China (2016). Accessed from:
Pioneer Cities of http://www.huanjing100.com/p-1307.html.
China Peak emissions years were used in the calculation of the cities’ projected carbon
emissions. Emissions data were further supplemented through data collection
through Internet research.
C40 Cities for C40 Cities for Climate Leadership. Accessed February 2021 from:
Climate Leadership https://www.c40.org/cities.
Group
ICLEI Local ICLEI Local Governments for Sustainability carbonn® Climate Registry
Governments for (www.carbonn.org). (Data provided directly by ICLEI in June 2019). Individual
Sustainability targets and action plans for carbonn participants based on 2018 GPC Inventory
carbonn® Climate responses. Although many ICLEI members report to CDP through the ICLEI-CDP
Registry unified reporting system, we supplemented our database with previously-collected
data from the ICLEI carbonn Climate Registry if used in previous report editions.
CDP Cities CDP. (2021). 2020 Full Cities Disclosure. Individual target and emissions data.
Accessed February 2021 from: www.data.cdp.net.
CDP 2020 Disclosure CDP. (Provided directly from CDP in March 2021). GHG emissions and action data
Survey for companies based on the 2020 responses.
CDP States and CDP. (2021). 2020 States and Regions Annual Disclosure. Individual target and
Regions emissions data. Accessed February 2021 from: www.data.cdp.net.
EU Covenant of EU Covenant of Mayors for Climate & Energy. Individual targets and emissions data
Mayors for Climate & for reporting members. Accessed February 2021 from:
Energy https://www.covenantofmayors.eu/. Additional data on EU Covenant of Mayors
members (e.g., scope 1 and 2 disaggregated emissions data) were obtained from:
Kona, A., Bertoldi, P., Monforti-Ferrario, F., Baldi, M. G., Lo Vullo, E., Kakoulaki, G.,
Vetters, N., Thiel, C., Melica, G., Sgobbi, A., Ahlgren, C., and Posnic, B.: Global
Covenant of Mayors, a dataset of GHG emissions for 6,200 cities in Europe and the
Southern Mediterranean, Earth Syst. Sci. Data Discuss. [preprint],
https://doi.org/10.5194/essd-2021-67, in review, 2021.
Under2 Coalition Under2 Coalition (Secretariat: The Climate Group). Membership data. Accessed
March 2021 from: https://www.under2coalition.org/members.
Global Covenant of Global Covenant of Mayors for Climate & Energy. Membership data. Accessed
Mayors for Climate & February 2021 from www.globalcovenantofmayors.org.
Energy
US Climate Alliance U.S. Climate Alliance. Accessed February 2021 from:
https://www.usclimatealliance.org/state-climate-energy-policies.
Information from this source was supplemented through desk research of
participants’ climate action targets or plans.
US Climate Mayors US Climate Mayors. Accessed February 2021 from: www.climatemayors.org and
http://climatemayors.org/actions/climate-action-compendium/.
Information from this source was supplemented through desk research of
participants’ climate action targets or plans.
We Are Still In We Are Still In. Participation data. Accessed July 2019 from:
https://www.wearestillin.org
The emission pathway in the “Current national policies plus individual actors’ commitments” (CPS+NSA)
scenario for each actor is derived from emission levels in target year. We assume a linear interpolation
of emission levels between the modelling starting year and the short- to mid-term target year (between
2020 and 2030). After the last target year, we have assumed that the emission levels follow CPS
scenario emission projections until 2030. We also assume linear interpolation towards the target year if
the actor only has a long-term target (e.g., 2050) and take the obtained emissions level for 2030. The
methodology note of the Climate Action Aggregation Tool (CAAT) provide more detailed explanations
3on how the CAAT conducts linear interpolations between the target’s base year, the most recent
inventory year (if available), and target year(s) (ICAT, 2021).
1.2 Subnational actions
Data collection and harmonisation approach
Subnational climate action data was collected from a variety of climate action registries and platforms,
including the Global Covenant of Mayors for Climate and Energy, Global Covenant of Mayors for Climate
and Energy (EU Secretariat), CDP Cities, CDP States and Regions, ICLEI carbonn® Climate Registry,
C40 Cities Climate Leadership Network, Under2 Coalition, United States Climate Mayors, United States
Climate Alliance and We Are Still In.1
Different platforms report participants’ climate actions in different formats and to different levels of detail:
CDP Cities report the breakdown of Scope 1 and Scope 2 emissions of subnational actors, whereas
others do not include information on emissions scopes if inventory information is reported by an actor.
Climate action platforms also capture different types of targets that span absolute greenhouse gas
(GHG) emissions reduction, energy efficiency, renewable energy, and intensity-based targets, among
others.
To overcome the inconsistencies in each platform’s method of categorizing targets and to include as
many subnational actors’ targets as possible, we chose the most common targets across platforms. We
included city- or region-wide absolute GHG emission reduction targets and quantified each target’s
emissions reduction using the following variables: actor's base year Scope 1 and Scope 2 emissions,
the target percent reduction, the target base year, the target year, and the actor’s most recent GHG
inventory data.
In the preliminary analysis presented in this paper, sector-level and government-operations targets for
cities and regions were excluded if city- or region-wide emissions reduction targets existed.
In sum, the hierarchy was applied as follows:
1) City- or region-wide absolute GHG emissions reduction targets, in terms of:
o Absolute emissions reduction
o Reduction relative to base year emissions
o Intensity-based targets
2) Government (e.g., direct and indirect GHG emissions from buildings and other government-
owned sources) GHG emission reduction targets, in terms of:
o Absolute emissions reduction
o Reduction relative to base year emissions
We supplemented data on subnational actors from a range of external sources for key countries in our
analysis. Chinese subnational commitments were derived from the C40 Cities for Climate Leadership
Group, the iGDP China Policy Mapping Tool (IGDP, 2019), and the Chinese cities and provinces
participating in the Alliance of Pioneer Peaking Cities (2016). China's 2012 emissions inventory data
(including both Scopes 1 and 2) of these cities in 2012 were taken from Liu & Cai (2018) and also
through Internet research. Population data and projections from the World Urbanization Prospects 2014
were also used in the calculation of these Chinese cities’ emissions (UN DESA, 2014). GDP data were
derived from the China Economic Database (CEIC, 2019). For US subnational actors, we gap-filled
1 Several of these networks are included as data sources for both the analysis of individual commitments by cities,
states, and regions and the analysis of ICIs. In this analysis, we assess the specific commitments already made by
each city, state, and region, while the ICIs analysis assess the aspirational goals of included initiatives.
4some missing information on baseline emissions and climate action commitments through internet desk
research of city climate action plans and progress reports.
For Japanese subnational actors, we collected most up-to-date data on historical GHG emissions and
post-2020 emissions reduction targets data for all 47 prefectures and government ordinance cities from
their respective websites. GHG emission inventories by Japanese subnational governments include
emissions related to electricity consumption, but the breakdown between direct and electricity-related
emissions are not always available. Therefore, we uniformly applied the average share of power
generation CO2 emissions in national total GHG emissions (excluding land use, land-use change and
forestry) for years FY2013-2018 (GIO, 2020).
In other cases, when city-level GHG emissions data was missing cities’ emission values were calculated
by multiplying per-capita provincial-level emissions by the cities’ population. An example of such a case
is Semarang in Indonesia. The city’s emissions inventory value was calculated by multiplying per capita
emissions of Central Java Province (where Semarang is located), as reported in the World Resources
Institute (WRI)'s CAIT Indonesia Climate Data Explorer (PINDAI) (WRI, 2016), by Semarang’s
population.
We also made several corrections to the reported data based on additional desk research and expert
judgment. When we could not verify questionable data, we removed these commitments from our
analysis. In total we quantified commitments from 1,929 subnational actors from 35 countries in our key
10 high-emitting economies.
The emissions data for the subnational commitments was carefully examined; we corrected or excluded
erroneous data points whenever identified. In the case of discrepancies between collected emissions
and emissions values found in inventory reports, official municipal strategy documents, etc., the latter
sources were prioritized. For data appearing to be resulting from incorrect unit conversion, etc. (values
much higher or lower than the per capita emissions mean) we applied filters to exclude commitments
with per capita GHG emissions lower than 0.2 tCO2e/capita and higher than 40 tCO2e/capita, with a few
exceptions for which were able to verify the correctness of the data (e.g., many GHG commitments for
local government operations, which often had very low per capita GHG emissions values, were still
included in the analysis).
Population and other contextual data for cities and regions came from Hsu et al. (Hsu et al., 2020) and
the data sources listed above, supplemented, when possible, with desk research.
Calculation of share of Scope 1 and Scope 2 emissions for cities and regions
The shares of Scope 1 and Scope 2 emissions in cities and regions’ total Scope 1 plus Scope 2
emissions were often not available. For regions, we use the share of electricity related GHG emissions
in total emissions of a region is assumed to equal the national average. Country-level total GHG
emissions from electricity generation in 2015 were estimated based on the IEA World Energy Outlook
2019 (China, Brazil, EU, India, Japan, Russia, South Africa) and APEC Energy Demand and Supply
Outlook 2019 (Canada, Indonesia, Mexico) for energy-related CO2 emissions (APERC, 2019; IEA,
2019). For cities, we use the median values for cities with the data available (Table 2).
5Table 2: Share of Scope 2 emissions in total Scope 1 plus Scope 2 emissions from cities by country
Country Value Source
Brazil 12% Average of 3 cities in dataset
Canada 10% Average of 12 cities in dataset
China 45% Authors' estimate from Liu (2016) on four major cities (Beijing, Shanghai,
Tiangjin, Chongqing) in 2009
EU27+UK 33% Average of 522 cities in dataset
India 44% Average of 2 cities in dataset
Indonesia 30% Average of 1 city in dataset
Japan 49% Average of 4 cities in dataset
Mexico 19% Average of 3 cities in dataset
South Africa 51% Average of 3 cities in dataset
USA 34% Average of 58 cities in dataset
1.3 Companies’ actions
Data collection and harmonisation approach
The dataset of companies’ actions was provided by CDP. It is based on the 2020 responses to CDP’s
investor climate and supply chain program (CDP, 2019, 2021). The CDP dataset on company-level
action provides information necessary for the analysis, such as the amount of GHG emissions generated
in each country’s jurisdiction, by a company operating worldwide.
While CDP is not necessarily comprehensive of all corporate global climate action, they report that over
6,900 companies responded to their climate change questionnaire (CDP, 2019). We quantified the
mitigation impact of approximately 800 companies that reported quantifiable absolute GHG emissions
reduction targets with a target year beyond 2020 and operated within the 10 high-emitting economies
this report focuses on. We could not quantify any intensity GHG emission reduction targets except for
nine companies operating in India that have been manually collected from the CDP database. We have
further added two Japanese companies’ targets not included in the CDP dataset (Tokyo Electric Power
Company and Chubu Electric Power Company).
The CDP questionnaire for companies encourages the use of GWPs from the IPCC’s Fifth Assessment
Report (AR5) (IPCC, 2014) for reporting emissions. We consider these data to be comparable with that
reported in terms of AR4 GWPs as most companies are categorised to be emitting predominantly CO2,
with only a minimal amount of tracked emissions (year emission values were calculated using the company’s target percentage in emissions reduction for
absolute targets, anticipated emissions reduction for emission intensity targets.
Targets aiming at exclusively reducing Scope 3 emissions were removed from the dataset since we
were unable to quantify probable overlaps, while targets that also include Scope 3 emissions alongside
Scope 1 and/or Scope 2 emissions were included due to their low group size (~1% of the number of
total company commitments).
From all companies in the dataset, for each country branch two GHG target were selected, based on
the following priority order
The target year closest to 2035, and the target closest to this target with a preference for an
earlier target (if it exists).
Only absolute emission reduction targets were included.
Scopes preferred in order of “Scope 1”, “Scope 1+3”, “Scope 1+2”, “Scope1+2+3”, “Scope 2”,
“Scope 2+3”.
Targets closest just before and closest to 2030 are preferred.
The data was translated to the data format required by the Climate Action Aggregation tool (ICAT, 2021)
that was used for the assessment of the impact of company targets on GHG emissions. For this we
assumed that the same reduction targets applied to both Scope 1 and Scope 2 emissions. In addition,
CDP sectors were translated to sectors used in the tool.
The starting point of the scenario analysis is 2018, and therefore the emission pathway of each company
branch consists of interpolated emissions between base year, start year and the selected two target
years. If the target years are before 2030, emission growth in line with the current policies scenario is
assumed.
For the analysis described Section 2, we combined company revenue data from the 2020 Fortune
Global 500, Forbes Global 2000, Orbis, and D&B Hoovers datasets, supplemented, when possible, with
desk research.
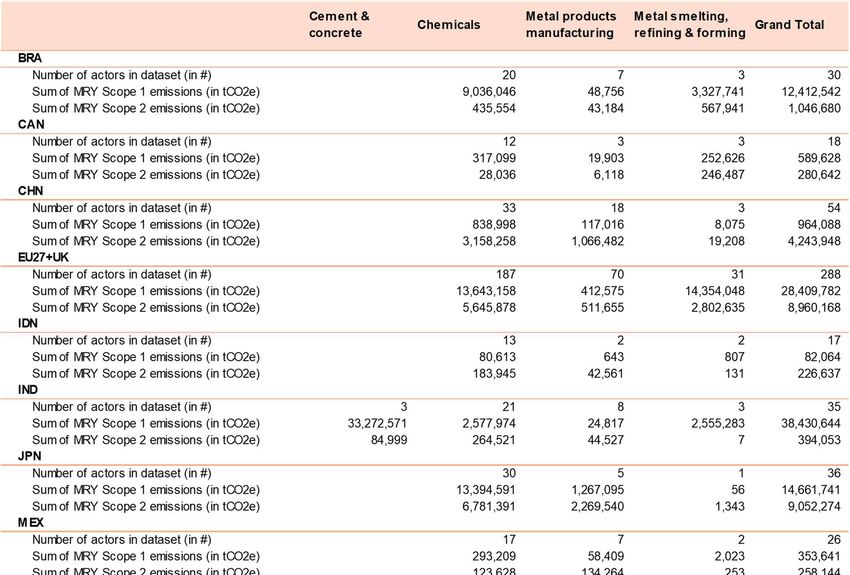
Overview of selected industrial subs-sectors in the companies’ dataset
The assessment of several selected industrial sub-sectors - cement and concrete, chemicals, metal
products manufacturing, metal smelting, and refining and forming - reveals that these are generally
underrepresented in our analysis. Table 3 provides a detailed overview of their Scope 1 and Scope 2
emissions coverage in the most recent inventory year for ten major emitting economies.
Companies in these industrial (sub-)sectors are less likely to set absolute emission targets to date,
instead rather setting intensity targets for the short- to medium-term future. Existing data limitations
explained above, the exclusion of intensity targets from our analysis (except for a nine Indian companies,
three of which in these sub-sectors) prevents a more conclusive analysis for these sub-sectors.
7Table 3: Overview of number of companies and their Scope 1 and Scope 2 emissions in the last available inventory
year (MRY) in selected industrial sub-sectors (cement and concrete, chemicals, metal products manufacturing,
metal smelting, and refining and forming) for all high-emitting economies.
82 Quantification of greenhouse gas (GHG) emissions
reductions at national level
The quantification of greenhouse gas (GHG) emissions reductions at national level builds upon a
stepwise approach similar to the 2019 assessment. The potential GHG emissions reduction of actors
was aggregated using methods developed under previous phases of this project that were integrated
into the Climate Action Aggregation Tool (CAAT) developed under the Initiative for Climate Action
Transparency (ICAT, 2021).
The CAAT tool builds upon the aggregation methodology presented in Kuramochi et al. (Kuramochi et
al., 2020) used for the 2018 and 2019 global aggregation reports (Data-Driven Yale, NewClimate
Institute and PBL, 2018; NewClimate Institute et al., 2019) and the Non-State and Subnational Action
Guide of the Initiative for Climate Action Transparency (2020).
The CAAT develops a reference scenario on the actor level, using the sector-specific growth rates from
Current National Policies. This scenario is then compared to the scenario under target realisation,
assuming linear emissions reductions, to find the actor-level emissions reduction potentials. The
emissions reductions potentials are then aggregated, while accounting for overlaps between subnational
and non-state actors. Table 4 presents a high-level comparison between the two aggregation
methodologies.
Table 4: Comparison of aggregation methodologies of potential GHG emissions reductions by individual non-state
and subnational actors between Kuramochi et al. (2020) and the Climate Action Aggregation Tool (CAAT)
developed under the Initiative for Climate Action Transparency (ICAT, 2021)
Climate Action Aggregation Tool (ICAT,
Kuramochi et al. (2020)
2021)
Resolution of current
national policies
Economy-wide level Sector level
(baseline) scenario
emissions projections
General order of Largest emissions scope to smallest Smallest emissions scope to largest
overlap calculation 1) Regions 1) Corporates
among non-state and 2) Cities 2) Energy utilities
subnational actors 3) Corporates 3) Investors, civil society organisations, and
4) Energy utilities others
4) Cities
5) Regions
General approach to Chapter 2.3.2. of Kuramochi et al. (2020) Chapter 2.6.3 of Climate Action Aggregation
calculate overlap introduces the general approach: Tool (ICAT, 2021) introduces the general
among non-state and Geographical identifiers used for approach:
subnational actors overlap calculations between regions Emissions coverage for the collective set of
and cities NSAs of each actor type within a given sector
Assumption that end-use companies is calculated,
with commitments are geographically Resulting emissions coverage values for each
evenly spread over subnational actors actor type and sector are used as proxies for
with and without commitments to overlap within each sector,
calculate overlaps between energy Emissions coverage is used to calculate
end-use companies and subnational “quantified overlap” by multiplying the actors’
actor commitments emissions coverages with impacts at all lower
Assumption that electricity-generating levels,
companies with commitments are Quantified overlaps for each actor level are
geographically evenly spread over summed, resulting in the total overlap among
regions/cities calculate overlaps the actions within the assessment boundary.
between electricity-generating
9companies and all other NSA
commitments
Use of specific Yes, for calculation of cities’ overlap with No, underlying assumption that aggregated
geographical regions in each country actions have a geographically unbiased
identifier dispersion across a country, region or sector
Considerations of Yes, consideration for overlap between No
overlap in targets’ (1) regions and cities and (2) subnational
ambition actors and corporates
We added the impact of the analysed countries to derive the global total. We did not quantify the
mitigation potential outside the ten high-emitting economies, due to the relatively small scale of
commitments outside of these countries.
103 Individual actors aggregation: country results
We present all country-level results for the high-emitting economies in the following Section 3.1.1 to
Section 3.1.10. The following disclaimers should be taken into consideration when interpreting the
country-level results.
All energy utilities (n=68) for EU27+UK have been excluded from analysis given their coverage
under the EU Emissions Trading System (EU ETS).
The 2021 analysis filtered out 122 outliers for energy end use companies and energy utilities
due to incomplete or not verifiable data, incl. some larger emitters (e.g., Petróleo Brasileiro SA
– Petrobras due to a reported target of 0% in 2025 compared to baseline emissions in CDP
dataset).
The 2021 analysis does not include intensity targets by energy end use companies and energy
utilities given limited data availability except for a several companies located in India that were
collected manually and included in India’s assessment (n=9).
The 2021 analysis excludes all pre-2020 targets by regions, cities, and companies except for
peak year targets of Chinese cities and regions (n=11).
3.1.1 Brazil
Scenario analysis - Brazil
Potential greenhouse gas (GHG) emissions reductions resulting from the full implementation of individual subnational and
non-state actor commitments compared to the “current national policies” scenario
GHG emissions, incl. LULUCF (in Mt CO2e)
1,600
1,400
1,200
1,000
800
600
400
200
0
2015 2020 2025 2030
“Current national policies (CNP)” scenario
“CNP plus indiv idual actors’ commitments” scenario (Min)
“CNP plus indiv idual actors’ commitments” scenario (Max)
Figure 1: Potential greenhouse gas (GHG) emissions reductions for Brazil resulting from the full implementation of
individual subnational and non-state actor commitments compared to the “current national policies” (CNP) scenario.
Source: This study.
11Summary results - Brazil
Summary results for 2021 Individual Actor Aggregation analysis
All emission estimates numbers include LULUCF.
Unit 2021 Individual Actor Aggregation
End-use com panies # 165
Energy utilities # 13
Cities # 8
Regions # 2
Total # 188
Max Min
Current national policies (CNP)
Mt CO2e
scenario in 2018 1,454 1,454
Current national policies (CNP)
Mt CO2e
scenario in 2030 1,494 1,494
Mt CO2e 1,465 1,471
"CNP plus individual actions' %-reduction below CNP -1.9% -1.6%
com m itm ents" scenario in 2030 MtCO2e reduction below
29 23
CNP
Figure 2: Summary results for 2021 Individual Actor Aggregation analysis for Brazil.
3.1.2 Canada
Scenario analysis - Canada
Potential greenhouse gas (GHG) emissions reductions resulting from the full implementation of individual subnational and
non-state actor commitments compared to the “current national policies” scenario
GHG emissions, incl. LULUCF (in Mt CO2e)
800
700
600
500
400
300
200
100
0
2015 2020 2025 2030
“Current national policies (CNP)” scenario
“CNP plus indiv idual actors’ commitments” scenario (Min)
“CNP plus indiv idual actors’ commitments” scenario (Max)
Figure 3: Potential greenhouse gas (GHG) emissions reductions for Canada resulting from the full implementation
of individual subnational and non-state actor commitments compared to the “current national policies” (CNP)
scenario. Source: This study.
12Summary results - Canada
Summary results for 2021 Individual Actor Aggregation analysis
All emission estimates numbers include LULUCF.
Unit 2021 Individual Actor Aggregation
End-use com panies # 167
Energy utilities # 9
Cities # 28
Regions # 6
Total # 210
Max Min
Current national policies (CNP)
Mt CO2e
scenario in 2018 699 699
Current national policies (CNP)
Mt CO2e
scenario in 2030 724 724
Mt CO2e 482 508
"CNP plus individual actions' %-reduction below CNP -33.4% -29.8%
com m itm ents" scenario in 2030 MtCO2e reduction below
242 216
CNP
Figure 4: Summary results for 2021 Individual Actor Aggregation analysis for Canada.
3.1.3 China
Scenario analysis - China
Potential greenhouse gas (GHG) emissions reductions resulting from the full implementation of individual subnational and
non-state actor commitments compared to the “current national policies” scenario
GHG emissions, incl. LULUCF (in Mt CO2e)
16,000
14,000
12,000
10,000
8,000
6,000
4,000
2,000
0
2015 2020 2025 2030
“Current national policies (CNP)” scenario
“CNP plus indiv idual actors’ commitments” scenario (Min)
“CNP plus indiv idual actors’ commitments” scenario (Max)
Figure 5: Potential greenhouse gas (GHG) emissions reductions for China resulting from the full implementation of
individual subnational and non-state actor commitments compared to the “current national policies” (CNP) scenario.
Source: This study.
13Summary results - China
Summary results for 2021 Individual Actor Aggregation analysis
All emission estimates numbers include LULUCF.
Unit 2021 Individual Actor Aggregation
End-use com panies # 303
Energy utilities # 1
Cities # 30
Regions # 2
Total # 336
Max Min
Current national policies (CNP)
Mt CO2e
scenario in 2018 12,506 12,506
Current national policies (CNP)
Mt CO2e
scenario in 2030 13,740 13,740
Mt CO2e 13,312 13,433
"CNP plus individual actions' %-reduction below CNP -3.1% -2.2%
com m itm ents" scenario in 2030 MtCO2e reduction below
428 307
CNP
Figure 6: Summary results for 2021 Individual Actor Aggregation analysis for China.
3.1.4 European Union (EU27) + United Kingdom
Scenario analysis - EU27+UK
Potential greenhouse gas (GHG) emissions reductions resulting from the full implementation of individual subnational and
non-state actor commitments compared to the “current national policies” scenario
GHG emissions, incl. LULUCF (in Mt CO2e)
4,500
4,000
3,500
3,000
2,500
2,000
1,500
1,000
500
0
2015 2020 2025 2030
“Current national policies (CNP)” scenario
“CNP plus indiv idual actors’ commitments” scenario (Min)
“CNP plus indiv idual actors’ commitments” scenario (Max)
Figure 7: Potential greenhouse gas (GHG) emissions reductions for European Union (EU27) and the United
Kingdom resulting from the full implementation of individual subnational and non-state actor commitments
compared to the “current national policies” (CNP) scenario. Source: This study.
14Summary results - EU27+UK
Summary results for 2021 Individual Actor Aggregation analysis
All emission estimates numbers include LULUCF.
Unit 2021 Individual Actor Aggregation
End-use com panies # 2155
Energy utilities # 68
Cities # 1669
Regions # 35
Total # 3927
Max Min
Current national policies (CNP)
Mt CO2e
scenario in 2018 3,820 3,820
Current national policies (CNP)
Mt CO2e
scenario in 2030 2,855 2,855
Mt CO2e 2,718 2,781
"CNP plus individual actions' %-reduction below CNP -4.8% -2.6%
com m itm ents" scenario in 2030 MtCO2e reduction below
137 74
CNP
Figure 8: Summary results for 2021 Individual Actor Aggregation analysis for the European Union (EU27) and the
United Kingdom.
3.1.5 India
Scenario analysis - India
Potential greenhouse gas (GHG) emissions reductions resulting from the full implementation of individual subnational and
non-state actor commitments compared to the “current national policies” scenario
GHG emissions, incl. LULUCF (in Mt CO2e)
5,000
4,500
4,000
3,500
3,000
2,500
2,000
1,500
1,000
500
0
2015 2020 2025 2030
“Current national policies (CNP)” scenario
“CNP plus indiv idual actors’ commitments” scenario (Min)
“CNP plus indiv idual actors’ commitments” scenario (Max)
Figure 9: Potential greenhouse gas (GHG) emissions reductions for India resulting from the full implementation of
individual subnational and non-state actor commitments compared to the “current national policies” (CNP) scenario.
Source: This study.
15Summary results - India
Summary results for 2021 Individual Actor Aggregation analysis
All emission estimates numbers include LULUCF.
Unit 2021 Individual Actor Aggregation
End-use com panies # 184
Energy utilities # 2
Cities # 3
Regions # 1
Total # 190
Max Min
Current national policies (CNP)
Mt CO2e
scenario in 2018 2,829 2,829
Current national policies (CNP)
Mt CO2e
scenario in 2030 4,433 4,433
Mt CO2e 4,048 4,085
"CNP plus individual actions' %-reduction below CNP -8.7% -7.9%
com m itm ents" scenario in 2030 MtCO2e reduction below
385 348
CNP
Figure 10: Summary results for 2021 Individual Actor Aggregation analysis for India.
3.1.6 Indonesia
Scenario analysis - Indonesia
Potential greenhouse gas (GHG) emissions reductions resulting from the full implementation of individual subnational and
non-state actor commitments compared to the “current national policies” scenario
GHG emissions, incl. LULUCF (in Mt CO2e)
2,000
1,800
1,600
1,400
1,200
1,000
800
600
400
200
0
2015 2020 2025 2030
“Current national policies (CNP)” scenario
“CNP plus indiv idual actors’ commitments” scenario (Min)
“CNP plus indiv idual actors’ commitments” scenario (Max)
Figure 11: Potential greenhouse gas (GHG) emissions reductions for Indonesia resulting from the full
implementation of individual subnational and non-state actor commitments compared to the “current national
policies” (CNP) scenario. Source: This study.
16Summary results - Indonesia
Summary results for 2021 Individual Actor Aggregation analysis
All emission estimates numbers include LULUCF.
Unit 2021 Individual Actor Aggregation
End-use com panies # 93
Energy utilities # 0
Cities # 5
Regions # 3
Total # 101
Max Min
Current national policies (CNP)
Mt CO2e
scenario in 2018 1,409 1,409
Current national policies (CNP)
Mt CO2e
scenario in 2030 1,885 1,885
Mt CO2e 1,743 1,756
"CNP plus individual actions' %-reduction below CNP -7.5% -6.8%
com m itm ents" scenario in 2030 MtCO2e reduction below
142 128
CNP
Figure 12: Summary results for 2021 Individual Actor Aggregation analysis for Indonesia.
3.1.7 Japan
Scenario analysis - Japan
Potential greenhouse gas (GHG) emissions reductions resulting from the full implementation of individual subnational and
non-state actor commitments compared to the “current national policies” scenario
GHG emissions, incl. LULUCF (in Mt CO2e)
1,400
1,200
1,000
800
600
400
200
0
2015 2020 2025 2030
“Current national policies (CNP)” scenario
“CNP plus indiv idual actors’ commitments” scenario (Min)
“CNP plus indiv idual actors’ commitments” scenario (Max)
Figure 13: Potential greenhouse gas (GHG) emissions reductions for Japan resulting from the full implementation
of individual subnational and non-state actor commitments compared to the “current national policies” (CNP)
scenario. Source: This study.
17Summary results - Japan
Summary results for 2021 Individual Actor Aggregation analysis
All emission estimates numbers include LULUCF.
Unit 2021 Individual Actor Aggregation
End-use com panies # 227
Energy utilities # 4
Cities # 37
Regions # 45
Total # 313
Max Min
Current national policies (CNP)
Mt CO2e
scenario in 2018 1,172 1,172
Current national policies (CNP)
Mt CO2e
scenario in 2030 950 950
Mt CO2e 910 924
"CNP plus individual actions' %-reduction below CNP -4.2% -2.7%
com m itm ents" scenario in 2030 MtCO2e reduction below
40 26
CNP
Figure 14: Summary results for 2021 Individual Actor Aggregation analysis for Japan.
3.1.8 Mexico
Scenario analysis - Mexico
Potential greenhouse gas (GHG) emissions reductions resulting from the full implementation of individual subnational and
non-state actor commitments compared to the “current national policies” scenario
GHG emissions, incl. LULUCF (in Mt CO2e)
800
700
600
500
400
300
200
100
0
2015 2020 2025 2030
“Current national policies (CNP)” scenario
“CNP plus indiv idual actors’ commitments” scenario (Min)
“CNP plus indiv idual actors’ commitments” scenario (Max)
Figure 15: Potential greenhouse gas (GHG) emissions reductions for Mexico resulting from the full implementation
of individual subnational and non-state actor commitments compared to the “current national policies” (CNP)
scenario. Source: This study.
18Summary results - Mexico
Summary results for 2021 Individual Actor Aggregation analysis
All emission estimates numbers include LULUCF.
Unit 2021 Individual Actor Aggregation
End-use com panies # 157
Energy utilities # 5
Cities # 8
Regions # 4
Total # 174
Max Min
Current national policies (CNP)
Mt CO2e
scenario in 2018 687 687
Current national policies (CNP)
Mt CO2e
scenario in 2030 726 726
Mt CO2e 685 691
"CNP plus individual actions' %-reduction below CNP -5.7% -4.8%
com m itm ents" scenario in 2030 MtCO2e reduction below
41 35
CNP
Figure 16: Summary results for 2021 Individual Actor Aggregation analysis for Mexico.
3.1.9 South Africa
Scenario analysis - South Africa
Potential greenhouse gas (GHG) emissions reductions resulting from the full implementation of individual subnational and
non-state actor commitments compared to the “current national policies” scenario
GHG emissions, incl. LULUCF (in Mt CO2e)
600
500
400
300
200
100
0
2015 2020 2025 2030
“Current national policies (CNP)” scenario
“CNP plus indiv idual actors’ commitments” scenario (Min)
“CNP plus indiv idual actors’ commitments” scenario (Max)
Figure 17: Potential greenhouse gas (GHG) emissions reductions for South Africa resulting from the full
implementation of individual subnational and non-state actor commitments compared to the “current national
policies” (CNP) scenario. Source: This study.
19Summary results - South Africa
Summary results for 2021 Individual Actor Aggregation analysis
All emission estimates numbers include LULUCF.
Unit 2021 Individual Actor Aggregation
End-use com panies # 80
Energy utilities # 2
Cities # 3
Regions # 0
Total # 85
Max Min
Current national policies (CNP)
Mt CO2e
scenario in 2018 505 505
Current national policies (CNP)
Mt CO2e
scenario in 2030 492 492
Mt CO2e 464 470
"CNP plus individual actions' %-reduction below CNP -5.6% -4.4%
com m itm ents" scenario in 2030 MtCO2e reduction below
28 22
CNP
Figure 18: Summary results for 2021 Individual Actor Aggregation analysis for South Africa.
3.1.10 United States
Scenario analysis - United States
Potential greenhouse gas (GHG) emissions reductions resulting from the full implementation of individual subnational and
non-state actor commitments compared to the “current national policies” scenario
GHG emissions, incl. LULUCF (in Mt CO2e)
6,000
5,000
4,000
3,000
2,000
1,000
0
2015 2020 2025 2030
“Current national policies (CNP)” scenario
“CNP plus indiv idual actors’ commitments” scenario (Min)
“CNP plus indiv idual actors’ commitments” scenario (Max)
Figure 19: Potential greenhouse gas (GHG) emissions reductions for the United States resulting from the full
implementation of individual subnational and non-state actor commitments compared to the “current national
policies” (CNP) scenario. Source: This study.
20Summary results - United States
Summary results for 2021 Individual Actor Aggregation analysis
All emission estimates numbers include LULUCF.
Unit 2021 Individual Actor Aggregation
End-use com panies # 364
Energy utilities # 30
Cities # 138
Regions # 27
Total # 559
Max Min
Current national policies (CNP)
Mt CO2e
scenario in 2018 5,587 5,587
Current national policies (CNP)
Mt CO2e
scenario in 2030 5,402 5,402
Mt CO2e 4,421 4,596
"CNP plus individual actions' %-reduction below CNP -18.2% -14.9%
com m itm ents" scenario in 2030 MtCO2e reduction below
981 806
CNP
Figure 20: Summary results for 2021 Individual Actor Aggregation analysis for the United States.
21References
APERC (2019) APEC Energy Demand and Supply Outlook – 7th edition (Vol II). Tokyo, Japan: Asia
Pacific Energy Research Centre, The Institute of Energy Economics, Japan. Available at:
http://aperc.ieej.or.jp/file/2010/9/24/Outlook_Volume_II_4E.pdf.
CDP (2019) Global Climate Change Analysis 2018. CDP. Available at:
https://www.cdp.net/en/research/global-reports/global-climate-change-report-2018 (Accessed: 10
September 2019).
CDP (2021) CDP Climate Change 2020 Reporting Guidance.
CEIC (2019) China Premium Database. CEIC Data. Available at:
https://www.ceicdata.com/en/products/china-economic-database (Accessed: 1 August 2019).
Data-Driven Yale, NewClimate Institute and PBL (2018) Global Climate Action from cities, regions, and
businesses. Data-Driven Yale; NewClimate Institute; PBL Netherlands Environmental Assessment
Agency. Available at: http://bit.ly/yale-nci-pbl-global-climate-action.
GIO (2020) The GHG Emissions Data of Japan (1990-2018). Greenhouse Gas Inventory Office of
Japan, National Institute of Environmental Studies. Available at:
http://www.nies.go.jp/gio/en/aboutghg/jqjm1000000kb5qe-att/L5-7gas_2020-GIOweb_1.0.xlsx
(Accessed: 13 August 2020).
Hsu, A. et al. (2020) ‘ClimActor, harmonized transnational data on climate network participation by city
and regional governments’, Scientific Data, 7(1), p. 374. doi: 10.1038/s41597-020-00682-0.
ICAT (2020) Non-State and Subnational Action Guide: Integrating the Impact of Non-State and
Subnational Mitigation Actions into National Greenhouse Gas Projections, Targets and Planning. Berlin:
NewClimate Institute; Washington, D.C.: World Resources Institute: NewClimate Institute and World
Resources Institute for Initiative for Climate Action Transparency. Available at:
https://climateactiontransparency.org/wp-content/uploads/2020/04/Non-State-and-Subnational-Action-
Assessment-Guide.pdf.
ICAT (2021) Climate Action Aggregation Tool for NonState and Subnational Action. Methodology Note.
Initiative for Climate Action Trasparency, NewClimate Instittute, World Resources Institute. Available at:
https://climateactiontransparency.org/wp-content/uploads/2021/02/methodology-note.pdf.
IEA (2019) World Energy Outlook. Paris, France: International Energy Agency (IEA). doi:
10.1049/ep.1977.0180.
IGDP (2019) China Policy Mapping Tool. Innovative Green Development Program. Available at:
http://www.igdp.cn/policy-mapping-tool/ (Accessed: 1 August 2019).
IPCC (2014) Climate Change 2014: Synthesis Report. Contribution of Working Groups I, II and III to the
Fifth Assessment Report of the Intergovernmental Panel on Climate Change. Edited by R. K. Pachauri
and L. A. Meyer. Geneva, Switzerland, Switzerland: IPCC.
Kuramochi, T. et al. (2020) ‘Beyond national climate action: the impact of region, city, and business
commitments on global greenhouse gas emissions’, Climate Policy, 20(3), pp. 275–291. doi:
10.1080/14693062.2020.1740150.
Liu, Z. and Cai, B. (2018) High-resolution Carbon Emissions Data for Chinese Cities. Environment and
Natural Resources Program, Belfer Center. Available at: https://www.belfercenter.org/publication/high-
resolution-carbon-emissions-data-chinese-cities.
NewClimate Institute et al. (2019) Global climate action from cities, regions and businesses: Impact of
individual actors and cooperative initiatives on global and national emissions. 2019 edition. NewClimate
Institute, Data-Driven Lab, PBL Netherlands Environmental Assessment Agency, German Development
Institute/Deutsches Institut für Entwicklungspolitik (DIE), Blavatnik School of Government, University of
Oxford. Available at: https://newclimate.org/2019/09/18/global-climate-action-from-cities-regions-and-
businesses-2019/.
UN DESA (2014) World Urbanization Prospects, Undesa. doi: 10.4054/DemRes.2005.12.9.
22WRI (2016) CAIT Indonesia Climate Data Explorer (PINDAI) Data. Washington DC, USA: World
Resources Institute. Available at: https://www.wri.org/resources/data-sets/cait-indonesia-climate-data-
explorer-pindai-data (Accessed: 19 January 2020).
23You can also read