Harnessing transcriptionally driven chromosomal instability adaptation to target therapy-refractory lethal prostate cancer
←
→
Page content transcription
If your browser does not render page correctly, please read the page content below
Article

Harnessing transcriptionally driven chromosomal
instability adaptation to target therapy-refractory
lethal prostate cancer
Graphical abstract                                                  Authors
                                                                    Brittiny Dhital, Sandra Santasusagna,
                                                                    Perumalraja Kirthika, ..., Adam Ertel,
                                                                    Josep Domingo-Domenech,
                                                                    Veronica Rodriguez-Bravo

                                                                    Correspondence
                                                                    domingo-domenech.josep@mayo.edu
                                                                    (J.D.-D.),
                                                                    rodriguezbravo.veronica@mayo.edu
                                                                    (V.R.-B.)

                                                                    In brief
                                                                    Dhital et al. unveil a CIN tolerance
                                                                    mechanism in metastatic therapy-
                                                                    resistant PCa involving MASTL
                                                                    upregulation by atypical transcription
                                                                    factors to restrain lethal chromosome
                                                                    defects and ensure tumor cell survival.
                                                                    Targeting CIN adaptation triggers tumor
                                                                    cell death in metastatic therapy-
                                                                    refractory PCa, increasing survival of pre-
                                                                    clinical models.
Highlights
d   CIN adaptation ensures therapeutic barrier survival of lethal
    PCa

d   MASTL kinase restrains fatal CIN levels and promotes PCa
    cell fitness

d   AR-V7 and E2F7 transcriptional rewiring upregulate MASTL
    to promote CIN tolerance

d   CIN tolerance mechanisms are a therapeutic vulnerability of
    lethal PCa

           Dhital et al., 2023, Cell Reports Medicine 4, 100937
           February 21, 2023 ª 2023 The Author(s).
           https://doi.org/10.1016/j.xcrm.2023.100937                                               ll
ll
                                                                                                                        OPEN ACCESS

Article
Harnessing transcriptionally driven
chromosomal instability adaptation to target
therapy-refractory lethal prostate cancer
Brittiny Dhital,1,2,3,12 Sandra Santasusagna,1,2,12 Perumalraja Kirthika,1,2 Michael Xu,3 Peiyao Li,3 Marc Carceles-Cordon,2
Rajesh K. Soni,4 Zhuoning Li,4 Ronald C. Hendrickson,4 Matthew J. Schiewer,3 William K. Kelly,3 Cora N. Sternberg,5
Jun Luo,6 Amaia Lujambio,7 Carlos Cordon-Cardo,8 Monica Alvarez-Fernandez,9 Marcos Malumbres,10,11
Haojie Huang,1,2 Adam Ertel,3 Josep Domingo-Domenech,1,2,* and Veronica Rodriguez-Bravo1,2,13,*
1Biochemistry   and Molecular Biology Department, Mayo Clinic, Rochester, MN 55905, USA
2Urology  Department, Mayo Clinic, Rochester, MN 55905, USA
3Thomas Jefferson University, Sidney Kimmel Cancer Center, Philadelphia, PA 19107, USA
4Microchemistry and Proteomics Laboratory, Memorial Sloan Kettering Cancer Center, New York, NY 10065, USA
5Englander Institute for Precision Medicine, Weill Cornell Department of Medicine, Meyer Cancer Center, New York-Presbyterian Hospital,

New York, NY 10021, USA
6Urology Department, Brady Urological Institute, Johns Hopkins University School of Medicine, Baltimore, MD 21287, USA
7Oncological Sciences Department, Icahn School of Medicine at Mount Sinai, New York, NY 10029, USA
8Pathology Department, Icahn School of Medicine at Mount Sinai, New York, NY 10029, USA
9Head & Neck Cancer Department, Institute de Investigación Sanitaria Principado de Asturias (ISPA), Institute Universitario de Oncologı́a

Principado de Asturias (IUOPA), 33011 Oviedo, Spain
10Cell Division & Cancer Group, Spanish National Cancer Research Centre (CNIO), 28029 Madrid, Spain
11Cancer Cell Cycle group, Vall d’Hebron Institute of Oncology (VHIO), 08035 Barcelona, Spain. Institució Catalana de Recerca i Estudis

Avançats (ICREA), Barcelona, Spain
12These authors contributed equally
13Lead contact

*Correspondence: domingo-domenech.josep@mayo.edu (J.D.-D.), rodriguezbravo.veronica@mayo.edu (V.R.-B.)
https://doi.org/10.1016/j.xcrm.2023.100937

SUMMARY

Metastatic prostate cancer (PCa) inevitably acquires resistance to standard therapy preceding lethality. Here,
we unveil a chromosomal instability (CIN) tolerance mechanism as a therapeutic vulnerability of therapy-re-
fractory lethal PCa. Through genomic and transcriptomic analysis of patient datasets, we find that castration
and chemotherapy-resistant tumors display the highest CIN and mitotic kinase levels. Functional genomics
screening coupled with quantitative phosphoproteomics identify MASTL kinase as a survival vulnerability
specific of chemotherapy-resistant PCa cells. Mechanistically, MASTL upregulation is driven by transcrip-
tional rewiring mechanisms involving the non-canonical transcription factors androgen receptor splice
variant 7 and E2F7 in a circuitry that restrains deleterious CIN and prevents cell death selectively in metastatic
therapy-resistant PCa cells. Notably, MASTL pharmacological inhibition re-sensitizes tumors to standard
therapy and improves survival of pre-clinical models. These results uncover a targetable mechanism promot-
ing high CIN adaptation and survival of lethal PCa.

INTRODUCTION                                                          confer survival advantages to PCa cells after therapy
                                                                      exposure.11,12
Metastatic prostate cancer (PCa) remains a leading cause of             Moreover, high-throughput genomic profiling is providing a
death in men worldwide.7,8 Despite effective treatments,              more complete picture of the PCa mutational landscape during
including androgen receptor (AR) targeting and/or taxane              disease progression to lethal metastatic stages.1–3,6,13–16
chemotherapy,9,10 PCa inevitably progresses to a therapy-re-          Different genomic dataset meta-analyses indicate that lethal
fractory state. Therapy resistance in PCa is a consequence of         PCa displays chromosomal alterations and instability like high
cell rewiring mechanisms that can arise as adaptative re-             levels of copy number alterations, fraction of genome altered
sponses driven by transcription factors (TFs). For example,           (FGA), tumor mutational burden, or aneuploidy.2,6,15–20 Indeed,
AR amplification, gain-of-function mutations, generation of           chromosomal instability (CIN), the ongoing rate of chromosome
AR splice variants like AR splice variant 7 (AR-V7), or the           segregation errors that can lead to numerical and/or structural
action of master regulators TFs, among other mechanisms,              chromosomal alterations,21–26 is a main source of genome

                                                            Cell Reports Medicine 4, 100937, February 21, 2023 ª 2023 The Author(s). 1
                     This is an open access article under the CC BY-NC-ND license (http://creativecommons.org/licenses/by-nc-nd/4.0/).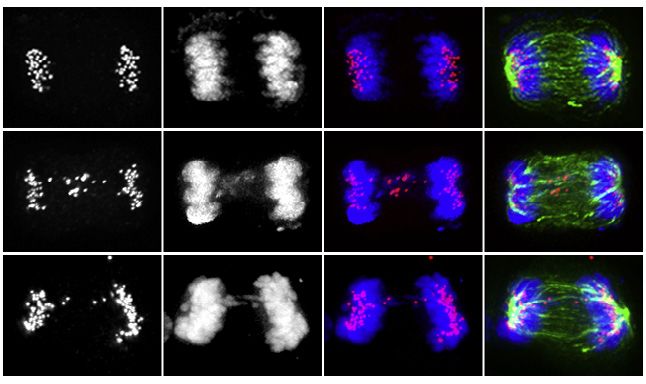
ll
     OPEN ACCESS                                                         Article

A                                                          B

C

D                                                      E       F

G

                                                                   (legend on next page)

2 Cell Reports Medicine 4, 100937, February 21, 2023
ll
Article OPEN ACCESS
changes, tumor heterogeneity, and therapy resistance promot- somal stability maintenance pathways in lethal PCa. Interrogation
ing tumor progression and poor clinical outcomes.27–38 Paradox- of the main cell division genes in three publicly available tran-
ically, severe chromosomal aberrations can also be detrimental scriptomic patient datasets identified a subset of genes deregu-
for cancer cell growth and survival.25,26,4,39–43 Thus, suggesting lated specifically in metastatic lethal PCa (Table S2), with a group
that CIN must be maintained under a tolerable threshold to pre- of mitotic kinases distinctively upregulated in metastasis
serve cancer cell homeostasis and may represent a vulnerability (Figure 1C). Remarkably, we identified a significant positive cor-
of aggressive tumors.43–45 In PCa, clinical correlative studies relation between FGA and mitotic kinase gene expression in the
indicate that aneuploidy and CIN associate to aggressive lethal Taylor dataset2 and, most important, in the SU2C dataset,6 which
disease46,47; however, the underlying causes of CIN, the adapta- only contains metastatic PCa samples (Figure 1D). Further inter-
tion mechanisms, and the potential therapeutic implications rogation of treatment annotations in this dataset revealed that
have not been studied. chemotherapy (taxane)-treated metastatic tumors displayed
Here, we investigated the molecular mechanisms promoting significantly higher mitotic kinase gene expression and FGA/
CIN tolerance in PCa. Interrogation of clinical patient datasets CIN than non-chemotherapy-treated metastases (Figure 1E).
and tissues showed that CIN is highest in metastatic castration Similar trends were observed when comparing chemo (n = 9) to
and chemotherapy-resistant PCa and is paralleled by an non-chemotherapy-treated (n = 7) metastatic tumors from the
elevated expression of cell division fidelity kinases. Functional Taylor dataset2 (Figure S1B). Of note, significantly higher chro-
genomic and phosphoproteomic studies identified the upregula- mosome mis-segregation was also observed in a cohort of doce-
tion of the mitotic kinase MASTL48–51 as a key survival depen- taxel-treated metastatic PCa tissues (Figure 1F). Thus, these an-
dency of high CIN lethal PCa. This CIN tolerance mechanism is alyses show increased correlation between CIN and mitotic
regulated through a transcriptional circuitry involving atypical kinase expression during PCa disease progression, being high-
TFs (AR-V7 and E2F7) and can be pharmacologically targeted est in metastases from taxane-treated patients.
with a MASTL small molecule inhibitor52 that, when combined, To functionally evaluate the contribution of the clinically upregu-
increases the efficacy of standard therapy in patient-derived lated mitotic fidelity kinases to the viability of PCa cells, we first
pre-clinical models. Our study uncovers CIN adaptation mecha- sought to identify suitable cell models recapitulating the high
nisms that can be exploited to target therapy-refractory PCa. FGA/CIN and mitotic kinase gene expression observed in lethal
PCa clinical samples. To this end, we scored chromosome mis-se-
RESULTS gregation by live imaging of cells expressing histone H2B-mCherry
(as a measure of total CIN) and mRNA levels of mitotic kinases in
Increased CIN and mitotic kinase gene expression a panel including normal prostate (RWPE1), primary (E006AA),
confer survival vulnerabilities in metastatic therapy- metastatic hormone sensitive (LNCaP, VCaP), metastatic castra-
refractory PCa cells tion resistant (22Rv1, DU145), and syngenic chemotherapy
To determine the levels of CIN during PCa progression to lethal (docetaxel)-resistant PCa cells (DR) we previously reported to
stages, we scored anaphase cells with chromosomal mis-segre- recapitulate highly aggressive and multi-drug-resistant pheno-
gation in a cohort of tissue samples containing primary and types of advanced lethal PCa.54–57 Similar to what is observed in
metastatic castration-resistant PCa (CRPC) tumors, as a proxy patient datasets, chromosome mis-segregation and mitotic
of total CIN, without distinguishing between numerical and/or kinases gene expression were increased in metastatic cells
structural changes (Figure 1A). We found that metastases display and highest in castration chemotherapy-resistant (DR) models
a higher rate of chromosome mis-segregation than primary tu- (Figures S1C–S1E). Of note, these differences were not due
mors. This CIN increase was corroborated by examining the to changes in cell cycle progression or proliferation between
FGA, as recently described,19 in a PCa publicly available patient syngenic chemosensitive parental and DR cells (Figures S1F and
dataset containing primary and metastatic tumors2 (Figure 1B). G). We next investigated the functional relevance of the elevated
Similar results were obtained when analyzing CIN gene signa- CIN/mitotic kinase expression in DR cells and the potential survival
tures reported to correlate well with genome instability4,53,5 and dependencies by performing a focused loss-of-function genetic
to predict lethality in PCa,47 in publicly available transcriptomic screen comparing the survival of syngenic parental and DR cells
PCa patient datasets1–3 (Figure S1A and Table S1). after knockdown of the 11 significantly increased mitotic kinases
Chromosome mis-segregation errors originate in mitosis; in patient datasets.1–3 Colony formation after depletion of at least
therefore, we sought to determine the status of mitotic chromo- 80% of target gene mRNA with two independent small interfering
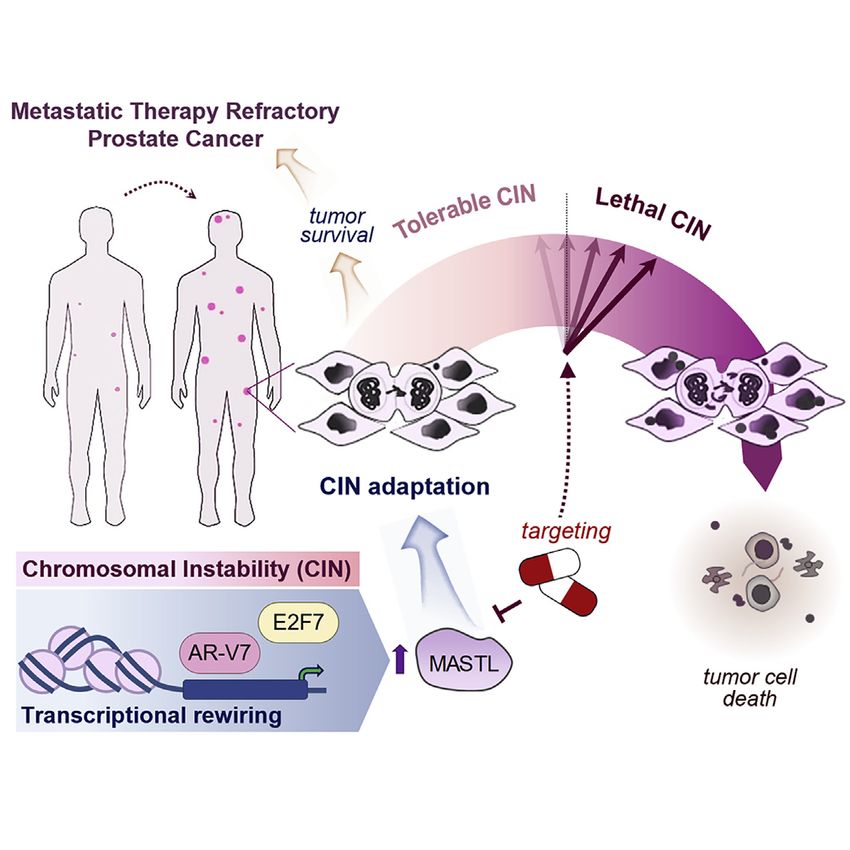
Figure 1. High CIN therapy-resistant PCa develops dependencies to specific chromosomal stability maintenance kinases
(A) Representative images and quantification of anaphases with chromosome segregation errors in primary and metastatic PCa patient tissue samples. Arrow
points lagging chromosomes or chromatin bridges. Scale bar, 5 mm. H&E, hematoxylin and eosin.
(B) FGA analysis in primary and metastatic tumor samples from indicated PCa dataset.2 p value, Wilcoxon’s test.
(C) Transcriptome heatmaps of mitotic kinases in publicly available PCa datasets.1–3 Fold change and statistical significance (false discovery rate [FDR]) of
differential gene expression between primary and advanced PCa shown as bar graph for each gene. Red = high, blue = low.
(D) Correlation (Pearson/Spearman) between FGA/mitotic kinase gene expression in indicated PCa databases.2,6
(E) Mitotic kinase gene expression, FGA, and CIN70 score in taxane-treated and naive metastatic tumor samples in SU2C.6 p values, Wilcoxon’s test.
(F) Percentage of anaphases with lagging chromosomes in taxane-treated and naive metastatic PCa patient tissue samples.
(G) Colony formation quantification of parental/chemoresistant (DR) cells after control or two siRNAs targeting each indicated mitotic kinase. Data represent the
mean ± standard deviation of at least three experiments. Unless indicated, *p % 0.05, determined by Student’s t test. See also Figure S1 and Tables S1 and S2.
Cell Reports Medicine 4, 100937, February 21, 2023 3
ll
      OPEN ACCESS                                                                                                                        Article

                    A                                                            B

           C                                                                     D

           E
                                                                                 F

                G
                                                                                                               H

Figure 2. SILAC quantitative phosphoproteomic analysis identifies MASTL as a top activated mitotic kinase in therapy-resistant PCa cells
(A) Workflow of SILAC-based discovery of phosphosite changes in metastatic chemoresistant PCa cells.
(B) Volcano plot of phosphopeptide log2 fold changes comparing 22Rv1-DR and parental cells. Red dots indicate significant changes by ANOVA.
(C) Gene ontology (GO) biological process enriched in DR cells phosphoproteome (g:Profiler). p value computed by Fisher’s test corrected with Benjamini-
Hochberg false discovery rate.
(D) List of top upregulated cell division phosphopeptides in DR cells.

                                                                                                                      (legend continued on next page)

4 Cell Reports Medicine 4, 100937, February 21, 2023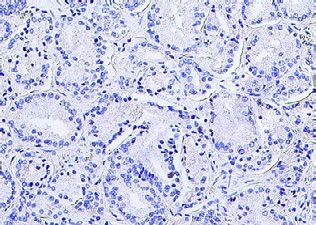
ll
Article                                                                                                                                OPEN ACCESS

RNAs (siRNAs) (Figures S1H and S1I) identified five top chromo-                   Last, we evaluated the clinical significance of MASTL by
somal stability genes (AURKA, BUB1, AURKB, TTK, and MASTL)                     immunohistochemistry (IHC) analysis in a cohort of patient tumor
that, when knocked down selectively, decreased cell viability                  samples, confirming the highest levels in metastatic taxane-
more significantly in DR than in parental cells (Figures 1G and                treated tumors (Figure 2G). Similarly, a MASTL mRNA increase
S1J). These results suggest a concomitant increase in CIN and                  was observed in taxane-treated metastatic samples from PCa
mitotic fidelity programs in advanced PCa, with a subset of kinases            patients (SU2C database)6 (Figure 2H). Overall, these data
to which metastatic chemotherapy-resistant cells become selec-                 indicate a clinically relevant upregulation of MASTL kinase in
tively dependent to survive.                                                   therapy-refractory lethal PCa, providing a rationale to mechanis-
                                                                               tically investigate its role in this disease context.
Quantitative phosphoproteomics identifies MASTL as a
top activated chromosomal stability kinase in therapy-                         Lethal therapy-resistant PCa cells upregulate MASTL to
resistant lethal PCa                                                           counteract deleterious CIN
To unbiasedly identify relevant protein dependencies of high CIN               Our experimental and patient specimen results point toward a clin-
metastatic therapy-resistant PCa cells, we applied a quantitative              ically significant role of MASTL upregulation in lethal therapy-re-
phosphoproteomic approach to compare phosphorylation                           fractory PCa. We further confirmed the selective MASTL survival
changes during cell division between DR and syngenic parental                  dependency in DR cells, as indicated by increased cell death
cells. 22Rv1-DR and parental cells were differentially labeled to              (cleaved PARP) and decreased colony formation after MASTL
perform stable isotope labeling by amino acids in culture                      depletion when compared with parental cells (Figures 3A, 3B
(SILAC) analysis58 and arrested in mitosis to identify relevant                and S3A). The same results were obtained using CRISPR-Cas9
phosphoproteomic changes when cells are close to chromo-                       to disrupt MASTL with a previously validated sgRNA62
some segregation (Figure 2A). Samples were subjected to                        (Figures 3C and 3D). Of note, the DR survival dependency was
phosphopeptide enrichment and mass spectrometry followed                       MASTL specific and dependent on its kinase activity as doxycy-
by bioinformatic analysis to determine statistically significant               cline inducible expression of wild-type (WT) siRNA-resistant
differences between cells. Phosphopeptide fold changes were                    FLAP-MASTL rescued colony formation and cell death when
determined between DR and parental cells (Figure 2B and                        compared with empty vector (EV) or MASTL kinase dead (KD;
Table S3) and main biological categories enriched in the DR                    G44S) (Figures 3E, 3F and S3B).
cells phosphoproteome identified through g:Profiler analysis,59                   Because the main known canonical biological function of
including cell division/mitosis and RNA processing and stability               MASTL is related to cell division fidelity, we investigated whether
(Figure 2C). We focused on changes in the chromosomal segre-                   chromosome segregation differences between DR and chemo-
gation fidelity group because of its causal connection to chromo-              sensitive cells could explain the high sensitivity of DR cells to
some mis-segregation and CIN. Notably, a-endosulfine (ENSA)                    MASTL loss of function. To this end, we scored anaphase lag-
and ARPP19 (cyclic AMP-regulated phosphoprotein 19) were                       ging chromosomes and kinetochores through immunofluores-
the top hyper-phosphorylated proteins in DR cells compared                     cence microscopy and found that MASTL depletion triggered a
with parental cells (Figure 2D and Table S4). Since these are                  greater increase in chromosome mis-segregation in DR cells
the only two known substrates of MASTL, a kinase controlling                   than in parental cells (Figure 3G), a phenotype rescued by WT
mitotic entry, progression, and genome stability,48,49,51 this                 MASTL kinase, but not by the catalytically inactive form (Fig-
approach unequivocally identified increased MASTL activity                     ure S3C). Similar results were obtained in a third metastatic
specifically in therapy-resistant metastatic PCa cells. The                    PCa cell model (VCaP-DR/VCaP) (Figure S3D) and by single-
increase in phosphorylated ENSA and ARPP19 in 22Rv1-DR                         cell live imaging to score lagging chromosomes in MASTL-
was corroborated in two other therapy-resistant cell models                    depleted histone H2B-mCherry cells (Figures S3E and S3F,
(DU145-DR and VCaP-DR) by immunoblot using a specific anti-                    and Video S1). In addition, acceleration of mitotic exit (Fig-
body against the phosphoresidues identified by SILAC (S67 and                  ure S3G) and increase in other deleterious mitotic errors like
S62, respectively) and described in the literature as unique sites             failed cytokinesis (multinucleation), centromere-positive and
of phosphorylation by MASTL.60,61 The higher phosphorylation                   -negative micronuclei, or multipolar spindles were also observed
was not due to an increase in total ENSA/ARPP19 protein, as                    in MASTL-depleted DR cells (Figures S3H and S3I). Of note,
indicated by immunoblot or by total proteome analysis per-                     doxycycline-induced MASTL upregulation in parental cells
formed in parallel (Figures 2E and S2A–S2C). These results                     lowered the rate of lagging chromosomes when compared
correlated with increased MASTL protein in DR cells in both                    with EV controls (Figures S3J and S3K).
mitotic and asynchronous populations (Figures 2F and S2D)                         Similar results were obtained in vivo comparing DR and
and, as shown above, are not associated with a higher accumu-                  parental cells stably expressing two inducible short hairpin
lation of DR cells in G2/M (Figures S1F and S1G).                              RNAs (shRNAs) targeting MASTL (Figure S3L) subcutaneously

(E) MASTL, total and phospho-ENSA/ARPP19 immunoblots in mitotic cell extracts.
(F) MASTL immunoblots in asynchronous or mitotic arrested cells.
(G) MASTL IHC images and quantifications in primary, metastatic taxane-treated, and naive tumor samples from PCa patient. *p % 0.05 determined by Student’s
t test.
(H) MASTL mRNA levels in taxane-treated and naive metastatic tumor samples in the SU2C patient dataset.6 p value determined by Wilcoxon’s test. Arrows,
MASTL mobility shift changes in mitosis. See also Figure S2 and Tables S3 and S4.

                                                                                            Cell Reports Medicine 4, 100937, February 21, 2023 5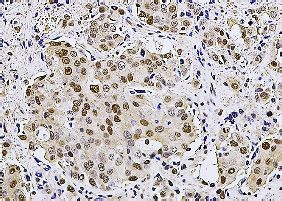
ll
     OPEN ACCESS                                                     Article

    A                                                  C

    B                                                  D

    E                                                  F

    G                                            H         I

                                                               (legend on next page)

6 Cell Reports Medicine 4, 100937, February 21, 2023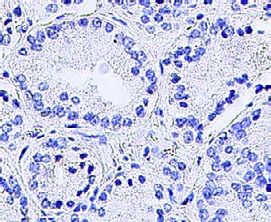
ll
Article                                                                                                                                 OPEN ACCESS

injected in the flanks of immunocompromised male mice.                         These results were confirmed in AR-V7-negative PCa cells
Doxycycline administration induced a significant decrease in                   (LNCaP and C4-2) (Figures S4G–S4I).
tumor weight mainly in DR shRNA MASTL xenografts (Fig-                            Next, we analyzed publicly available AR-V7 chromatin immuno-
ure 3H). Notably, DR shRNA MASTL established tumors dis-                       precipitation (ChIP)-sequencing data and identified MASTL pro-
played increased anaphases with chromosome segregation er-                     moter occupancy in PCa cells77 (Figure S4J) that we confirmed
rors (Figure S3M) and cell death (Figure 3I) than control tumors               in 22Rv1-DR cells, which display the highest MASTL levels, using
after 4 days of doxycycline exposure. Overall, these results                   the same validated AR-V7 ChIP-sequencing antibody77–79 (Fig-
suggest that therapy-refractory PCa displays a selective depen-                ure 4G). ChIP-quantitative PCR (qPCR) analyses corroborated
dency on MASTL kinase activity to survive high CIN.                            that AR-V7, and not AR-FL, occupies the identified ARV-PBS,
                                                                               but not adjacent regions, in the MASTL promoter (Figures 4H
                                                                               and S4K), and luciferase reporter assays further proved AR-V7
AR-V7 transcriptionally regulates MASTL expression in                          direct binding and activation of transcription from a WT MASTL
therapy-resistant lethal PCa cells                                             promoter, while mutation of the AR-V7 binding motif significantly
We next sought to investigate the upstream mechanisms pro-                     reduced this effect and AR-FL did not induce luciferase activity
moting CIN adaptation via MASTL upregulation in lethal PCa.                    (Figure S4L). Interestingly, we observed a higher AR-V7 enrich-
To this end, we performed an unbiased bioinformatic analysis                   ment at MASTL promoter in DR cells concomitant to increased
to determine TFs enriched in high CIN prostate tumors from pub-                AR-V7/MASTL protein expression (Figures 4I and 4J). These re-
licly available patient datasets,2,6,63 coupled with examination of            sults indicate that chemotherapy-resistant metastatic PCa cells in-
the MASTL promoter to identify binding sites of specific TFs64                 crease MASTL levels through AR-V7 direct promoter binding.
(Figure 4A and Table S5A). This analysis identified AR-V7 as                   Notably, AR-V7 depletion recapitulated the mitotic phenotypes
one of the top TFs positively correlated with FGA levels and                   of MASTL perturbation and were partially rescued by MASTL over-
CIN in patient PCa samples (Figures 4B and S4A–S4C, and                        expression, further supporting a relevant role of the AR-V7/MASTL
Tables S5A and S5B). AR-V7 is a constitutively active AR splice                axis in regulating chromosome segregation fidelity in metastatic
variant generated as an anti-androgen therapy resistance mech-                 therapy-resistant PCa cells (Figure S4M).
anism in metastatic CRPC patients and associated with disease                     To assess a potential role of the AR-V7/MASTL axis in promot-
progression.65–72 Despite being clinically relevant, AR-V7’s func-             ing survival to docetaxel, we transduced C4-2 cells (AR positive/
tional role in the biology of CRPC remains poorly understood.73                AR-V7 negative) with an AR-V7 or EV and assessed effects on
Based on our results and on the paramount clinical significance                docetaxel sensitivity. AR-V7 expression increased C4-2 cells
of AR signaling in PCa,74 we decided to investigate the role of                MASTL levels and activity (Figure 4K, left and middle) and sur-
AR-V7 in the transcriptional regulation of MASTL. Of note, anal-               vival to docetaxel when compared with EV controls (Figure 4K,
ysis of two recent datasets showed decrease in MASTL mRNA                      right), in addition to inducing growth in the absence of hormones
after AR variants (ARVs) depletion75,76 (Figure 4C), supporting                (charcoal stripped media) (Figure S4N). Of note, MASTL deple-
a potential role in MASTL transcriptional regulation. Furthermore,             tion significantly restored sensitivity to docetaxel in AR-V7-over-
the MASTL promoter contains an AR binding element that                         expressing cells (Figure S4O). Consistently, AR-V7 depletion
resembles previously reported ARV preferential binding sites                   induced a greater decrease in colony formation in 22Rv1-DR
(ARV-PBS)75 890 bp upstream of the transcription start site                    cells than in parental cells (Figure S4P) and re-sensitized DR cells
(TSS) (Figure 4D). To functionally dissect the role of AR signaling            to docetaxel (Figure S4Q). These results are in line with previous
in the transcriptional control of MASTL, we compared the impact                clinical studies72,80,81 showing that AR-V7 expression at baseline
of both AR full length (AR-FL) and AR-V7 depletion on its gene                 is primarily linked to resistance to anti-androgen therapy, but
expression in PCa cell models expressing AR-V7 and observed                    also confers worse clinical outcomes in taxane-treated CRPC
that, while AR-V7 knockdown significantly decreased MASTL                      patients.
mRNA and protein levels (Figures 4E, 4F, S4D and S4E),                            Finally, we assessed the clinical significance of the AR-V7/
AR-FL depletion had no effect (Figures 4E, 4F, S4E and S4F).                   MASTL axis in metastatic PCa patients (SU2C)6 and found that

Figure 3. Therapy-resistant lethal PCa exhibits a selective functional MASTL dependency to tolerate deleterious CIN
(A) Colony formation and quantifications comparing parental and DR cells after control or MASTL siRNAs.
(B) MASTL, total PARP, and cleaved PARP immunoblots in cells from (A), 72 h after siRNA.
(C) Colony formation and quantifications comparing parental and DR cells after control or MASTL CRISPR-Cas9-mediated knockout.
(D) MASTL, total PARP, and cleaved PARP immunoblots from cells in (C) 72 h after CRISPR-Cas9.
(E) Colony formation and quantifications of DR cells doxycycline-induced to express WT or KD (G44S, KD) FLAP-MASTL siRNA resistant (siR) compared with EV
(FLAP) after control or MASTL siRNAs.
(F) MASTL and cleaved PARP immunoblots of cells from (E) after 72 h.
(G) Representative immunofluorescence images and quantifications of anaphases with lagging chromosomes comparing parental and DR cells after control or
MASTL siRNAs. Centromeres (CREST), microtubules (alpha-tubulin). Red arrows point lagging chromosomes. Minimum of 100 cells scored per condition. *p %
0.05, compares MASTL-depleted cells. **p % 0.05, compares cells in siRNA control. Wilcoxon’s test. Scale bar, 5 mm.
(H) Representative images and tumor weight quantification in parental/DR subcutaneous xenografts expressing control (n = 20) or two doxycycline-induced
MASTL shRNAs (n = 10, each shRNA) for 28 days.
(I) Representative cleaved caspase-3 IHC images and quantification in same DR xenograft models as in (H) after 4 days of doxycycline. Unless indicated, data
represent the mean ± standard deviation of at least three experiments. *p % 0.05, determined by Student’s t test. See also Figure S3 and Video S1.

                                                                                             Cell Reports Medicine 4, 100937, February 21, 2023 7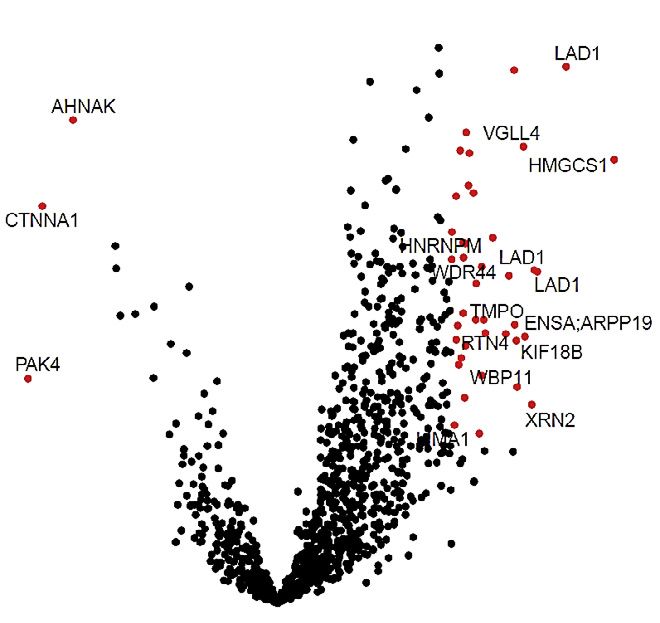
ll
OPEN ACCESS Article
A B C
Prostate Cancer FGA/TFs correlation
FGA/TFs expr. TF motif analysis 30 Kounatidou et al. He et al.
PCa patients NC ELK1
MASTL promoter ZNF623 siC siARVs Log2FC siC siARVs Log2FC
negative
Lethal PCa CIT AURKB
positive
TTK CDK1
Y 20 AR-V7 MASTL BUB1B
-Log10P
Z ZNF16 CDK1 AURKA
X TCLF5
E2F1 BUB1B TTK
PLK4 NEK2
0
MASTL promoter
10 ZNF367
E2F7
AURKA PLK1
MYBL2 BUB1 PLK4
FOXM1
CBX2
PLK1 BUB1
0 AURKB CIT
FGA/CIN AR NEK2 MASTL
TFs
0
-0.5
-1.0
-1.5
0
-1.2
-0.3
-0.6
-0.9
-1 -0.5 0 0.5 1 1.5 1 0.5 0 -0.5 -1 -1.5 1 0.5 0 -0.5 -1
Correlation
D E 22Rv1 22Rv1-DR VCaP VCaP-DR
AR-V7 TSS 1.25 * 1.25 * 1.25 * 1.25 *
MASTL mRNA
MASTL mRNA
relative to siC
relative to siC
1.00 1.00 1.00 1.00
0.75 0.75 0.75 0.75
ARVs-PBS
(-890 bp) 0.50 0.50 0.50 0.50
TTAAGGGGAGAACAGCCTTTACC 0.25 0.25 0.25 0.25
MASTL promoter 0.00 0.00 0.00 0.00
siRNA: C FL V7 C FL V7 siRNA: C FL V7 C FL V7
AR AR AR AR
F 22Rv1 22Rv1-DR VCaP VCaP-DR G H
AR AR AR AR AR AR AR AR 22Rv1-DR
siRNA: Cnt FL V7 Cnt FL V7 Cnt FL V7 Cnt FL V7 ChIP-seq MASTL neg region
kDa
enrichment (% input)
MASTL [0 - 14]
0.6
95 22Rv1-DR *
AR-V7
MASTL 0.5
AR-V7 ChIP
ratio: 1 0.94 0.4 1 0.93 0.25 1 1 0.24 1 0.95 0.15
0.4
AR-V7 72 [0 - 14] 0.3
input
FL 95 0.2
AR
Vs 72 0.1
0.0
Actin siRNA: C V7 C V7
MASTL
I 0.8
L N
enrichment (% input)
* Metastatic PCa (SU2C) Metastatic CRPC patient tumors
0.6
*
AR-V7 ChIP
No taxane Taxane
p= 0.0037 AR-V7 positive MASTL High
0.4
AR-V7 mRNA
4
0.2
0 2
Ab: IgG V7 IgG V7 IgG V7 IgG V7
22Rv1 22-DR VCaP VCaP-DR
0
parent. DR parent. DR AR-V7 negative MASTL Low
J kDa kDa
MASTL 95 MASTL 95 (n=123) (n=79)
AR-V7 AR-V7
72 72
Actin Actin M AR-V7 vs. MASTL
22Rv1 VCaP (Metastatic PCa) 40 Pm
K C4-2 C4-2 MASTL
AR-V7 expression
EV V7 kDa EV V7 kDa EV AR-V7 OE High Low p-value
% C4-2 colonies
120
MASTL 95
MASTL 130 100 * * *
95 80 Pos 9 0
AR-V7
AR-V7 P-ENSA/ 17 60 * 0.09
ARPP19 40
ENSA/
Neg 7 4
Actin 20
ARPP19 17
0
asynch.
SU2C
Actin 0 0.1 0.25 0.5 1 2.5
mitotic Docetaxel nM MASTL expression
(legend on next page)
8 Cell Reports Medicine 4, 100937, February 21, 2023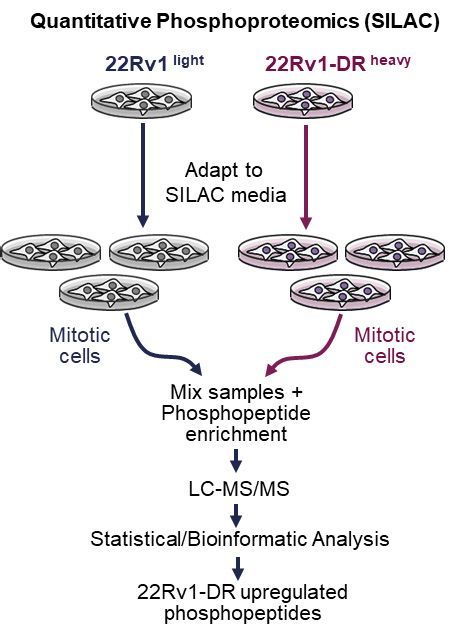
ll
Article                                                                                                                                      OPEN ACCESS

taxane-treated tumors display the highest AR-V7 expression                        did not impact MASTL levels (Figures S5H–S5M), further con-
(Figure 4L) and a positive correlation with MASTL mRNA expres-                    firming E2F7 as the main E2F regulating MASTL in PCa cells.
sion that is non-existent with AR-FL (Figures 4M and S4R). This                      The clinical relevance of these findings was confirmed in mul-
was confirmed at the protein level by IHC analysis of metastatic                  tiple publicly available PCa patient datasets1,6,63 in which E2F7/
heavily treated PCa tissue samples (Figure 4N). Overall, our data                 MASTL mRNA expression positively correlate (Figure 5F) and
indicate that AR-V7 expression plays a key role in the transcrip-                 E2F7 shows increase expression in taxane-treated metastatic
tional upregulation of MASTL in high CIN therapy-refractory met-                  tumors (Figure 5G). These results were validated at the protein
astatic PCa and provides mechanistic insights on how AR-V7                        level by IHC in a cohort of PCa tissue samples (Figure 5H).
may modulate taxane therapy response.                                                Because our data suggest that both AR-V7 and E2F7 can
                                                                                  transcriptionally regulate MASTL in therapy-resistant PCa cells,
E2F7 transcriptionally regulates MASTL by direct                                  we then investigated potential co-dependencies between both
promoter binding and through an AR-V7-dependent                                   TFs. Analysis of the expression of each TF under knockdown
circuitry in therapy-resistant lethal PCa cells                                   conditions in 22Rv1-DR cells showed that AR-V7 regulates
Since MASTL is also upregulated in therapy-resistant cells that                   E2F7 expression (Figures S5N and S5O), while AR-V7 levels
do not express AR-V7, we sought to determine additional mech-                     remain unchanged after E2F7 depletion (Figures S5P and
anisms of transcriptional regulation. Our bioinformatic analysis                  S5Q). Conversely, the overexpression of AR-V7 in C4-2 cells
had identified several E2F family members correlating with                        upregulates both MASTL and E2F7 (Figure S5R), results that
high FGA/CIN in PCa patient datasets, with E2F7 being the                         are in line with a previous report showing AR-V7 transcriptional
one with the strongest positive correlation (Figures 4B, S4B                      regulation of E2F7.75 These results indicate that AR-V7 can
and Tables S5A and S5B). E2F7 has been shown to increase dur-                     directly regulate MASTL gene expression by binding to its pro-
ing PCa disease progression and to correlate with poor patient                    moter and indirectly by transcriptionally upregulating E2F7 in
outcomes,75 but its biological role remains unexplored. In addi-                  PCa cells. Accordingly, the co-depletion of both TFs in 22Rv1-
tion, we identified an E2F7 binding motif 959 bp upstream of                      DR cells induced the greatest decrease in MASTL when
the MASTL TSS (Figure 5A), which prompted us to further inves-                    compared with single TF knockdowns (Figure 5I), and the stron-
tigate its function and potential role in MASTL transcriptional                   gest decrease in colony formation in docetaxel-treated and
regulation in PCa. Like MASTL, E2F7 levels increase in metasta-                   untreated cells (Figure 5J). Collectively, our data suggest that
tic PCa cells, being highest in DR models (Figures S5A and S5B),                  elevated expression of atypical TFs like AR-V7 and E2F7 help
which also displayed lower colony formation after its depletion                   to counteract deleterious CIN in therapy-refractory PCa.
than parental cells (Figure S5C). Moreover, E2F7 knockdown
(Figure S5D) reduced MASTL mRNA and protein levels in DR                          Targeting MASTL induces deleterious CIN selectively in
cells (Figures 5B and 5C) and in other AR-V7 negative cells                       therapy refractory PCa cells
(C4-2 and LNCaP) (Figure S5E). Subsequent ChIP-qPCR anal-                         Our findings that MASTL upregulation promotes survival to delete-
ysis confirmed E2F7 binding to the predicted element in the                       rious CIN gave a rationale to exploit this vulnerability for potential
MASTL promoter, with greater enrichment in DR cells                               therapeutic opportunities. To this end, we determined the efficacy
(Figures 5D, S5F and S5G). Functionally, E2F7 depletion induced                   of GKI-1, a first-generation small molecule MASTL inhibitor52 not
chromosome segregation errors that were partially rescued by                      tested previously in PCa. GKI-1 treatment decreased the phos-
MASTL overexpression (Figure 5E), thus confirming a relevant                      phorylation of MASTL targets ENSA and ARPP19, demonstrating
role of the E2F7/MASTL axis in PCa cells chromosomal stability                    efficient MASTL kinase inhibition in parental and DR cells
regulation. Of note, E2F1 and E2F8 also correlated with FGA/CIN                   (Figures 6A and S6A). Remarkably, MASTL inhibition decreased
in PCa patients (Figures 4B and S4B); however, their depletion                    colony formation more efficiently in 22Rv1-DR and DU145-DR

Figure 4. AR-V7 transcriptionally regulates MASTL in lethal PCa
(A) Workflow of bioinformatic analysis of TFs enriched in high FGA/CIN PCa patients’ tumors from publicly available datasets and MASTL promoter analysis of TF
binding motifs.
(B) TFs/FGA correlation volcano plot of publicly available patient datasets.2,6,63 NC, not correlated. p % 0.05 determined by Fisher z-transform.
(C) Transcriptomic heatmaps of mitotic kinases in control or ARVs depleted cells from two studies.75,76 Red = high, blue = low.
(D) MASTL gene promoter diagram indicating ARVs-PBS binding motif location.
(E) MASTL mRNA levels after 48 h of control, AR-FL, or AR-V7 siRNA in parental and DR cells.
(F) Immunoblots of cells from (E) 72 h after siRNA. FL = full length; Vs = variants. Vertical white lines separate non-adjacent lanes in the original blot.
(G) AR-V7 ChIP-sequencing profile at the MASTL locus in 22Rv1-DR cells.
(H) AR-V7 ChIP-qPCR occupancy at the MASTL promoter in 22Rv1-DR cells. Flanking control region (neg region). Data relative to IgG control.
(I) AR-V7 ChIP-qPCR occupancy at MASTL promoter comparing parental and DR cells.
(J) MASTL and AR-V7 immunoblots comparing parental and DR cells.
(K) (Left) MASTL and AR-V7 immunoblots in control (EV) and overexpressing AR-V7 asynchronous C4-2 cells (asynch.). (Middle) MASTL, total and phospho-
ENSA immunoblots in same cells in mitosis. (Right) Colony formation quantification of cells exposed to increasing concentrations of docetaxel for 72 h.
(L) AR-V7 mRNA levels in taxane-treated and naive metastatic PCa patient samples from the SU2C dataset.6 p value determined by Wilcoxon’s test.
(M) AR-V7 and MASTL gene expression correlation (Pearson/Spearman) in the SU2C dataset.6
(N) Representative IHC images and association between AR-V7 and MASTL protein expression in metastatic CRPC tissue samples (n = 20). p value determined
by Fisher exact (c2 test) test. Unless indicated, data represent the mean ± standard deviation of at least three experiments. *p % 0.05, determined by Student’s t
test. See also Figure S4 and Tables S5A and S5B.

                                                                                                 Cell Reports Medicine 4, 100937, February 21, 2023 9
ll
OPEN ACCESS Article
A B C
DU145 DU145-DR 22Rv1 22Rv1-DR DU145-DR 22Rv1-DR
1.25 1.25
change relative to siC
change relative to siC
* * *
MASTL mRNA fold
* siRNA: Cnt E2F7
MASTL mRNA fold
Cnt E2F7
TSS 1.00 1.00 kDa kDa
E2F7
MASTL
95 95
0.75 0.75 MASTL
ratio: 1 0.25 1 0.45
-959bp 0.50 0.50 130 130
TTTCCCGCGGAA E2F7
95
MASTL promoter 0.25 0.25 95
tubulin
0.00 0.00
siRNA: C E2F7 C E2F7 siRNA: C E2F7 C E2F7
D E
0.7
lagging chromatids (live)
50 50
lagging chromatids (live)
* 22Rv1-DR DU145-DR
0.6
enrichment (% input)
% Anaphases with
% Anaphases with
40 40
0.5 ** **
* *
E2F7 ChIP
0.4 * 30 30
*
0.3 *
20 20
0.2
10 10
0.1
0.0 0 0
neg MASTL neg MASTL neg MASTL neg MASTL siRNA: C E2F7 E2F7 C E2F7 E2F7
+ +
22Rv1 22Rv1-DR DU145 DU145-DR MASTL MASTL
F G
E2F7 vs. MASTL Metastatic PCa (SU2C)
E2F7 vs. MASTL E2F7 vs. MASTL (Metastatic PCa) No taxane Taxane
p= 0.05
3
E2F7 expression
E2F7 expression
E2F7 expression
E2F7 mRNA
2
1
0
TCGA Grasso SU2C
(n=123) (n=79)
MASTL expression MASTL expression MASTL expression
H
Metastatic CRPC patient tumor
E2F7 MASTL MASTL
High Low p-value
High 13 0
E2F7ll
Article OPEN ACCESS
cells than in syngenic parental cells (Figures 6B and S6B) and was cells (Figures 7A and S7B) without inducing general toxicity (Fig-
associated with increased cell death (cleaved PARP) (Figure 6C). ure S7C). Remarkably, IHC analysis of treated tumors showed
The lack of efficacy of GKI-1 in low MASTL-expressing cells was that GKI-1 efficacy was paralleled by an increase in chromosome
recapitulated in the LNCaP taxane-sensitive metastatic cell line segregation errors (Figure S7D) and higher apoptosis (cleaved
model (Figure S6C). No further decrease in colony formation was Caspase 3 expression) (Figure 7B) in DR models. Moreover,
seen after GKI-1 treatment of MASTL-depleted cells, suggesting when testing the efficacy of combining GKI-1 with standard
the observed phenotypes were mainly due to MASTL inhibition therapy, we observed that mice bearing CRPC-DR xenografts
and ruling out strong off target effects in our models (Figure S6D). treated with both GKI-1 and docetaxel displayed lower tumor
Next, histone H2B-mCherry-expressing parental and DR cells weights when compared with vehicle and each treatment alone
treated with GKI-1 were subjected to live imaging to analyze ef- (Figure 7C). Similar results were observed when administering
fects on chromosome segregation. Notably, GKI-1 dramatically GKI-1 to castrated mice bearing hormone-sensitive VCaP xeno-
increased the number of anaphases with lagging chromosomes grafts (Figure 7D). Finally, we further validated these results in a
specifically in DR cells (Figure 6D), induced faster mitotic exit, cohort of four PCa patient-derived xenograft (PDX) models
and led to increases in other mitotic errors (micronuclei, multinu- generated from circulating tumor cells of metastatic PCa pa-
cleated cells and multipolar spindles) (Figures S6E and S6F), all tients55,82 that had been previously treated with anti-androgen
of them reminiscent of MASTL loss of function. and/or taxane therapy (Figure S7E) and that express distinct
Since our data indicate that MASTL upregulation in metastatic levels of MASTL, AR-V7, and E2F7 (Figure 7E). Like observed
therapy-refractory PCa cells confers sensitivity to MASTL target- with cell line xenografts, PDXs with elevated MASTL expression
ing, we tested whether its overexpression in parental cells may displayed higher GKI-1 sensitivity. High-MASTL models (PDX#2
render them more sensitive to MASTL inhibition. Indeed, induced and #4) had smaller tumor volumes (Figure 7F), higher count of
MASTL upregulation in parental cells (Figure S6G) rendered lagging chromosomes (Figure 7G), increased cleaved PARP
them sensitive to GKI-1, as indicated by decreased colony for- expression (Figure S7F), and higher overall mice survival than
mation and induced apoptosis (Figures 6E and 6F), mimicking low-MASTL models (PDX#1 and #3) (Figure 7H). Remarkably,
the MASTL dependency of DR cells. In contrast, MASTL KD survival was significantly increased in mice bearing high-MASTL
overexpression did not induce the same effects (Figures S6H– PDX models treated with the GKI-1 plus docetaxel combination
S6J), further confirming that increased MASTL activity confers (Figure 7I). Interestingly, a similar result was observed in a high-
sensitivity to GKI-1. MASTL PDX model that partially responds to ADT (PDX#4), as
We next sought to determine whether MASTL inhibition could the combination with GKI-1 significantly improved survival (Fig-
sensitize DR cells to standard therapy. Indeed, the combination ure 7J). Overall, these studies suggest that targeting MASTL
of GKI-1 with docetaxel showed greater efficacy than each treat- may translate into a valuable therapeutic strategy for high CIN
ment alone in DR cells (Figure 6G). Of note, culturing metastatic metastatic therapy-refractory PCa.
hormone-sensitive PCa cells (VCaP) in androgen deprivation
conditions (ADT), with charcoal-stripped media, induced a DISCUSSION
concomitant upregulation of AR-V7, E2F7, and MASTL and
increased GKI-1 sensitivity (Figure 6H). Our results indicate Genomic abnormalities induced by CIN are pervasive events in can-
that AR-V7/E2F7/MASTL upregulation is a common mechanism cers that correlate with advanced disease stages and higher aggres-
in castration and/or chemoresistant PCa cells, rendering them siveness by driving tumor evolution, metastases, and drug resis-
more sensitive to MASTL inhibition. tance.27–34,38 In PCa, in which genome aberrations increase as a
function of disease progression,1,2,6,14–16,83 CIN and derived chro-
GKI-1 treatment increases survival of lethal PCa pre- mosomal errors have been associated with lethal disease,19,46,47
clinical models bearing MASTL-addicted therapy- but the mechanistic causes and consequences of CIN remain to
refractory tumors be investigated. In this framework, here we uncovered that CIN is
We then sought to validate our results in vivo using cell line and highest in castration chemotherapy-resistant metastatic PCa. The
patient-derived xenograft pre-clinical models. GKI-1 treatment fact that therapy-refractory tumors continue growing despite the
in mice bearing subcutaneous parental and chemoresistant known CIN detrimental consequences for cells25,4,39–42
luciferase-tagged xenografts showed that DR tumors, which suggests that PCa may develop adaptation mechanisms that
have greater MASTL expression (Figure S7A), had a significantly remain to be identified. To date, exploiting genomic instability as
lower tumor photon flux and tumor weight after GKI-1 treatment a therapeutic strategy in advanced PCa has mainly focused on
(5 days/week for 28 days) than tumors derived from parental targeting DNA repair defects.84–89 In contrast, CIN-targeting
(F) E2F7 and MASTL gene expression correlation (Pearson/Spearman) in publicly available PCa patient datasets.1,6,63
(G) E2F7 mRNA levels in taxane-treated and naive metastatic PCa patient samples from the SU2C dataset.6 p value determined by Wilcoxon’s test.
(H) Representative IHC images and association between E2F7 and MASTL protein expression in metastatic CRPC tissue samples (n = 20). p value determined by
Fisher exact (c2 test) test.
(I) MASTL, AR-V7, and E2F7 immunoblots in 22Rv1-DR cells 72 h after single or combined depletion of AR-V7 and E2F7.
(J) Colony formation quantifications in cells from (I) exposed 72 h to DMSO or docetaxel (75 nM). *p % 0.05, compared with control. **p % 0.05, compared with
combined AR-V7 + E2F7 with single siRNA. Unless indicated, data represent the mean ± standard deviation of at least three experiments. p values determined by
Student’s t test. See also Figure S5.
Cell Reports Medicine 4, 100937, February 21, 2023 11ll
OPEN ACCESS Article
A B
C D
E F
G H
Figure 6. MASTL pharmacological inhibition selectively induces deleterious CIN in therapy-resistant PCa cells
(A) MASTL, total, and phospho-ENSA/ARPP19 immunoblots of mitotic parental and DR cells treated with 10 mM GKI-1 for 2 or 4 h.
(B) Colony formation and quantifications of DR/parental cells treated 72 h with control (DMSO) or 5 mM GKI-1.
(C) Immunoblots of cleaved PARP in cells from (B).
(D) Quantification of percentage of anaphases with lagging chromosomes (live imaging) in cells treated with 10 mM GKI-1. Minimum of 100 cells scored. *p % 0.05,
compares GKI-1-treated cells. **p % 0.05, compares controls. p values determined by Wilcoxon’s test.
(E) Colony formation and quantifications of parental cells expressing (EV) or MASTL overexpression treated with vehicle (DMSO) or 5 mM GKI-1 for 72 h.
(F) Immunoblots of cleaved PARP in cells from (E).
(G) Colony formation and quantifications of DR cells treated with DMSO, docetaxel (75 nM 22Rv1-DR or 250 nM DU145-DR), 5 mM GKI-1, or a combination.
(H) AR-V7, E2F7, and MASTL immunoblots in VCaP cells naive or grown 2 weeks in charcoal-stripped media (ADT). Right, population doubling of cells expose to
vehicle (DMSO), 5 mM GKI-1, ADT, or a combination. Unless indicated, data represent the mean ± standard deviation of at least three experiments. *p % 0.05,
determined by Student’s t test. See also Figure S6.
12 Cell Reports Medicine 4, 100937, February 21, 2023ll
Article OPEN ACCESS
A
B
C D
E F G
H
I J
Figure 7. Targeting MASTL-dependent CIN tolerance in vivo increases survival of lethal PCa pre-clinical models
(A) Representative images and quantification of tumor photon flux bioluminescence of parental and DR luciferase-expressing xenografts in mice treated 28 days
with vehicle (n = 10) or GKI-1 (n = 10).
(B) Cleaved caspase-3 IHC and quantification in xenografts of mice treated as in (A) for 4 days (n = 12 each group).
(C) Representative images and tumor weight quantification of DR subcutaneous xenografts of mice treated 28 days with vehicle, GKI-1, docetaxel or combi-
nations. Twenty tumors per treatment condition were analyzed. *p % 0.05; **p % 0.05 in GKI-1 vs. GKI + Doc.
(legend continued on next page)
Cell Reports Medicine 4, 100937, February 21, 2023 13ll
OPEN ACCESS Article
strategies are unexplored in PCa because the molecular underpin- indicate that they can cooperate to ensure CIN tolerance as
nings and consequences of CIN remain poorly understood. Of part of a transcriptional circuitry in which AR-V7 can also tran-
note, recent studies have shown that cells harboring aneuploidy or scriptionally upregulate E2F7. Altogether, our results support
whole-genome doubling can be specifically targeted.90,91 It is the far-reaching hypothesis that the expression of unconven-
feasible to assume, then, that unveiling mechanisms underlying tional TFs confers a survival advantage to lethal PCa tumors
CIN tolerance in advanced PCa can turn a major force behind tumor accumulating CIN.
progression into a source of tumor vulnerability that could be ex- Finally, here we provide experimental proof of concept that
ploited therapeutically. the pharmacological inhibition of MASTL, as a strategy to induce
Here, we elucidated molecular and cellular processes allowing tumor lethal CIN, increases the survival of mice bearing therapy-
metastatic therapy-resistant PCa to tolerate and survive high CIN resistant high MASTL prostate tumors. Although we demon-
levels. Our findings indicate that metastatic tumors that had been strate MASTL on-target effects of GKI-1 in inducing deleterious
treated with anti-androgen and chemotherapy (taxane) display CIN in cells, the future development of more potent and selective
increased FGA/CIN and mitotic fidelity kinase gene expression. compounds is warranted to improve the therapeutic index of this
Phosphoproteomic and functional analysis pinpointed a key treatment strategy. Still, our data indicate that the AR-V7/E2F7/
role of MASTL as a top upregulated actionable kinase to which MASTL axis may be a common molecular mechanism arising
chemoresistant PCa cells become selectively addicted to survive after exposure to different types of therapy and that combination
by preventing the buildup of an extremely high burden of chromo- of MASTL inhibition with standard therapy (ADT or docetaxel)
somal aberrations. MASTL has an established role in regulating significantly improves survival of patient-derived pre-clinical
cell cycle and mitosis,48,49,51 has been associated with cancer, PCa models.
and is proposed as a potential therapeutic target,62,92–96 but In summary, this study identified a mechanism of high CIN
the mechanisms underlying its deregulation and function in adaptation in metastatic therapy-resistant PCa. This functional
PCa remain unknown. Our data indicate that the selective sensi- dependency, mediated through AR-V7/E2F7 transcriptional
tivity observed in MASTL-depleted or inhibited therapy-resistant rewiring and the upregulation of MASTL to avoid extreme CIN
PCa is due to elevation of CIN above a tolerable survival levels in metastatic cells, ensures tumor survival and progres-
threshold. We uncovered that this is a functional dependency sion. By targeting this vulnerability, we propose that CIN can
that transcriptionally can be driven by AR-V7, supporting previ- be exploited as a therapeutic strategy for lethal PCa.
ous reports proposing ARVs separate roles from full-length AR
in modulating genome integrity genes.68,75,76,97–101 Despite the Limitations of the study
recognized clinical relevance of AR-V7 in promoting resistance The methods used do not discern between structural and nu-
to anti-androgen therapy in metastatic PCa,65–72,80 its biological merical CIN. Future studies should define causes and adaptation
functions have remained more elusive. In this context, our study mechanisms of different CIN types in PCa considering diverse
uncovers a previously unknown function for AR-V7 in restraining disease contexts, tumor genetic backgrounds, the status of
deleterious CIN in therapy-resistant lethal PCa. From a clinical genome integrity checkpoints, and mitotic error correction path-
perspective, our data agree with previous studies showing that ways in cell models and tumor samples. It is feasible that multiple
AR-V7-positive tumors correlate with poor patient response to mechanisms of CIN tolerance could cooperate, with MASTL
anti-androgen therapy, but also with worse response to taxane upregulation being one of them. In addition, the specific down-
therapy.72,80,81 Thus, our work provides insight into an AR-V7- stream targets, and molecular mechanisms by which MASTL
regulated mechanism promoting tumor survival to distinct stan- regulates chromosomal stability, remain to be elucidated to
dard therapies. Our findings also suggest that transcriptionally further understand implications in cancer.
regulated CIN adaptation in PCa cells can be orchestrated by
other TFs such as E2F7, which can also bind and regulate MASTL STAR+METHODS
irrespective of AR-V7 expression. This confirms previous studies
suggesting that atypical E2Fs can promote cancer aggressive- Detailed methods are provided in the online version of this paper
ness in a context-dependent manner,102–104 further supporting and include the following:
the proposed relevant role of E2Fs in regulating chromosomal
stability in cancer105–107 and opens the door to future studies to d KEY RESOURCES TABLE
dissect transcriptional programs regulated by distinct atypical d RESOURCE AVAILABILITY
E2Fs. In addition to the role of AR-V7 and E2F7 alone, our data B Lead contact
(D) Representative images of VCaP subcutaneous xenografts of mice treated with vehicle, GKI-1, ADT (castration), or a combination for 28 days. Twenty tumors
per treatment condition were analyzed.
(E) MASTL, AR, AR-V7, and E2F7 immunoblots in lethal PCa PDX models.
(F) Tumor weights from PDX models in mice treated 28 days with vehicle or GKI-1. Twenty tumors per treatment condition were analyzed.
(G) Percentage of anaphases with lagging chromosomes in PDX xenografts from mice treated for 4 days with vehicle or GKI-1 (n = 12 each group).
(H) Kaplan-Meier survival curves of mice intracardially injected with MASTL low or MASTL high PDX cells treated with vehicle or GKI-1.
(I) Kaplan-Meier survival curves of MASTL low or high PDX cells intracardially injected mice treated with docetaxel alone or with GKI-1.
(J) Kaplan-Meier survival curves of mice intracardially injected with MASTL high PDX4 cells treated with ADT (castration) or in combination with GKI-1. Vehicle,
DMSO. GKI-1: 100 mg/kg/day i.p. Docetaxel: 10 mg/kg/weekly i.p. Unless indicated, p values determined by Student’s t test.
(H–J) Ten mice for each treatment group analyzed. *p % 0.05, log-rank test at the two-sided 0.05 level. See also Figure S7.
14 Cell Reports Medicine 4, 100937, February 21, 2023ll
Article OPEN ACCESS
B Materials availability ing, B.D., S.S., M.J.S., M.C.-C., J.D.-D., and V.R.-B.; research supervision,
B Data and code availability funding acquisition, and project administration, V.R.-B.
d EXPERIMENTAL MODEL AND SUBJECT DETAILS
DECLARATION OF INTERESTS
B Cell lines and prostate cancer xenografts models
B Human prostate cancer tissue samples
The authors declare no competing financial interests.
B Animal experimental models, husbandry and surgical
castration INCLUSION AND DIVERSITY
d METHOD DETAILS
B Focused loss-of-function genetic screen of clinically One or more of the authors of this paper self-identifies as an under-repre-
sented ethnic minority in science, as a gender minority in their field of research
up-regulated cell division kinases
and/or received support from a program designed to increase minority repre-
B RNA extraction and quantitative RT-PCR
sentation in science.
B Genetic editing by CRISPR/Cas9 system
B Inducible shRNAs Received: August 12, 2022
B Plasmids and viral transduction Revised: September 27, 2022
B Colony formation assays Accepted: January 18, 2023
B Population doubling assays Published: February 13, 2023
B Quantitative proteomics (SILAC) methods
REFERENCES
B Bioinformatic analysis
B Cell synchronization, extract preparation and immuno- 1. Grasso, C.S., Wu, Y.M., Robinson, D.R., Cao, X., Dhanasekaran, S.M.,
blotting Khan, A.P., Quist, M.J., Jing, X., Lonigro, R.J., Brenner, J.C., et al.
B Immunofluorescence microscopy (2012). The mutational landscape of lethal castration-resistant prostate
B Live-cell imaging cancer. Nature 487, 239–243. https://doi.org/10.1038/nature11125.
B Immunohistochemistry 2. Taylor, B.S., Schultz, N., Hieronymus, H., Gopalan, A., Xiao, Y., Carver,
B.S., Arora, V.K., Kaushik, P., Cerami, E., Reva, B., et al. (2010). Integra-
B Evaluation of chromosome segregation errors in tumor
tive genomic profiling of human prostate cancer. Cancer Cell 18, 11–22.
tissue samples https://doi.org/10.1016/j.ccr.2010.05.026.
B Chemical treatments
3. Lapointe, J., Li, C., Giacomini, C.P., Salari, K., Huang, S., Wang, P., Fer-
B Chromatin immunoprecipitation (ChIP) rari, M., Hernandez-Boussard, T., Brooks, J.D., and Pollack, J.R. (2007).
B Luciferase reporter assays Genomic profiling reveals alternative genetic pathways of prostate
B Tumor growth in vivo tumorigenesis. Cancer Res. 67, 8504–8510. https://doi.org/10.1158/
B Mouse intracardiac injections in vivo bioluminescence 0008-5472.Can-07-0673.
imaging 4. Birkbak, N.J., Eklund, A.C., Li, Q., McClelland, S.E., Endesfelder, D., Tan,
B General toxicity monitoring P., Tan, I.B., Richardson, A.L., Szallasi, Z., and Swanton, C. (2011). Par-
adoxical relationship between chromosomal instability and survival
d QUANTIFICATION AND STATISTICAL ANALYSIS
outcome in cancer. Cancer Res. 71, 3447–3452. https://doi.org/10.
1158/0008-5472.can-10-3667.
SUPPLEMENTAL INFORMATION 5. Carter, S.L., Eklund, A.C., Kohane, I.S., Harris, L.N., and Szallasi, Z.
(2006). A signature of chromosomal instability inferred from gene expres-
Supplemental information can be found online at https://doi.org/10.1016/j. sion profiles predicts clinical outcome in multiple human cancers. Nat.
xcrm.2023.100937. Genet. 38, 1043–1048. https://doi.org/10.1038/ng1861.
6. Abida, W., Cyrta, J., Heller, G., Prandi, D., Armenia, J., Coleman, I., Cieslik,
M., Benelli, M., Robinson, D., Van Allen, E.M., et al. (2019). Genomic corre-
ACKNOWLEDGMENTS
lates of clinical outcome in advanced prostate cancer. Proc. Natl. Acad. Sci.
USA 116, 11428–11436. https://doi.org/10.1073/pnas.1902651116.
We thank all lab members; the CHTN for tumor specimens; Stephen Elledge
for the pInducer20 plasmid; TJU Genomics Core ChIP-seq assistance; Matt 7. Sung, H., Ferlay, J., Siegel, R.L., Laversanne, M., Soerjomataram, I., Je-
Miele and Lisa Mohr for proteomic technical help; Mark Fortini for manuscript mal, A., and Bray, F. (2021). Global cancer statistics 2020: GLOBOCAN
proofreading; and the Knudsen lab, S. Barilla, C. Martos-Rus, J. Carter, and V. estimates of incidence and mortality worldwide for 36 cancers in 185
Miguela for technical help. Research was supported by NIH/NCI grants countries. CA. Cancer J. Clin. 71, 209–249. https://doi.org/10.3322/
P30CA08748 (to R.C.H.); R01CA207311 and R01CA261925 (to J.D.-D.); caac.21660.
K22CA207458 and R01CA237398 (to V.R.-B.); and funding to V.R.-B. from 8. Siegel, R.L., Miller, K.D., Fuchs, H.E., and Jemal, A. (2022). Cancer sta-
the Mayo Clinic Foundation, The Margaret Q. Landenberger Research Foun- tistics, 2022. CA. Cancer J. Clin. 72, 7–33. https://doi.org/10.3322/
dation, The W.W. Smith Charitable Trust, The AACR, and The Prostate Cancer caac.21708.
Foundation (PCF). 9. Sumanasuriya, S., and De Bono, J. (2018). Treatment of advanced pros-
tate cancer-A review of current therapies and future promise. Cold
Spring Harb. Perspect. Med. 8, a030635. https://doi.org/10.1101/
AUTHOR CONTRIBUTIONS
cshperspect.a030635.
Conceptualization, J.D.-D. and V.R.-B.; methodology, validation, investiga- 10. Rebello, R.J., Oing, C., Knudsen, K.E., Loeb, S., Johnson, D.C., Reiter,
tion, and analysis, B.D., S.S., K.P., P.L., M.C.-C., M.X., A.E., J.D.-D., and R.E., Gillessen, S., Van der Kwast, T., and Bristow, R.G. (2021). Prostate
V.R.-B; bioinformatics, A.E.; resources, pathology, clinical relevance, and cancer. Nat. Rev. Dis. Primers 7, 9. https://doi.org/10.1038/s41572-020-
pre-clinical work assistance, M.M., M.A.-F., A.L., J.L., C.N.S., M.J.S., 00243-0 (2021.
W.K.K., C.C.-C., H.H., J.D.-D., and V.R.-B.; proteomic support, R.K.S., L.Z., 11. Carceles-Cordon, M., Kelly, W.K., Gomella, L., Knudsen, K.E., Rodri-
and R.C.H.; writing draft with co-authors’ input, V.R.-B.; draft review and edit- guez-Bravo, V., and Domingo-Domenech, J. (2020). Cellular rewiring in
Cell Reports Medicine 4, 100937, February 21, 2023 15You can also read