House View 2nd Quarter 2021 - Recovery. Rebound. Rotation - Hewett Wealth
←
→
Page content transcription
If your browser does not render page correctly, please read the page content below

2 nd   Quarter 2021
      House View
  Recovery. Rebound. Rotation.

  Hewett Wealth (Pty) Ltd is an Authorised Financial Services Provider (FSP No: 46645)
DISCLAIMER: Hewett Wealth (Proprietary) Limited is a licensed Financial Services Provider (“FSP”) in terms of the Financial Advisory and Intermediary Services Act, 37 of
2002 (“FAIS Act”), with FSP number 46645, regulated by the Financial Sector Conduct Authority.

This document and any other information supplied in connection with the financial product (“product”) is not “advice” as defined and/or contemplated in terms of the FAIS
Act and investors are encouraged to obtain their own independent advice prior to investing in the product. Any investment is speculative and involves significant risks and
therefore, prior to investing, investors should fully understand the product and any risks associated with the product.

Investments in securities are generally medium to long term investments. The value of the product may go down as well as up and past performance is not necessarily a
guide to the future.

Hewett Wealth (Proprietary) Limited and its affiliates disclaims and assumes no liability for any loss or damage (direct, indirect or consequential) that may be suffered from
using or relying on the information contained herein.

Talking Points

Q1 MARKET RECAP   THEMES SHAPING MARKETS   ASSET ALLOCATION VIEWS

                                                                    3
Agenda
Historic Asset Class Returns
 Total Returns (ZAR) – As of 31 March 2021

Source: Morningstar

Agenda
Historic Asset Class Returns
Total Returns (USD) – As of 31 March 2021

Source: Morningstar

2020Agenda
     Review: Offshore Markets
S&P 500 Index Sector Returns - 26 March 2021      US Fixed Income Maturity and Quality Returns

MSCI World Index Sector Returns – 26 March 2021   European Fixed Income Maturity and Quality Returns

Source: Goldman Sachs, Bloomberg
Agenda
Q1 2021 Review: Local Markets
FTSE/JSE Sector Returns

Source: Bloomberg

Agenda Review: Local Markets
Year-to-date
FTSE/JSE Sector Returns     All Share Index 5 Largest Companies: 51,41% combined weight
                                      Collectively = +6,86% Q1 2021 return (Alsi: +11,91% YTD)

                                  Index           Index            Index           Index          Index
                                 Weight:         Weight:          Weight:         Weight:        Weight:
                                 18,20%          12,3%             9,1%            8,8%           3,0%
                                   YTD            YTD              YTD              YTD           YTD
                                  Return:        Return:          Return:          Return:       Return:
                                 +16,97%         +9,89%           +8,64%          +19,74%        +1,14%

   Source: JSE, Bloomberg
1 Year Anniversary Since C-19 Market Crash

           10 Best Performers: MSCI World Index                                                    Distribution of S&P 500 1Yr Returns
                              Members             Ticker Last Price   YTD      -1Y                                     (March 4 1957 – Present)
                  MSCI WORLD                     MXWO      2806,07    4,31%   14,06%
                  All Members
             1)   TESLA INC                      TSLA         699,6 -0,86% 743,44%
             2)   ENPHASE ENERGY INC             ENPH        165,34 -5,77% 571,53%
             3)   PELETON INTERACTIVE INC-A      PTON        117,65 -22,46% 434,23%
             4)   MODERNA INC                    MRNA        140,47 34,46% 434,10%
             5)   SUNRUN INC                     RUN          63,46 -8,53% 402,39%
             6)   ZOOM VIDEO COMMUNICATIONS-A    ZM          355,17   5,29% 395,77%
             7)   CLOUDFARE INC - CLASS A        NET          76,61   0,82% 345,43%
             8)   DRAFTKINGS INC - CL A          DKNG         71,61 53,80% 335,14%
             9)   ZSCALER INC                    ZS          188,87 -5,43% 329,48%
            10)   CROWDSTRIKE HOLDINGS INC - A   CRWD         205,8 -2,84% 324,74%

            10 Worst Performers: MSCI World Index
                              Members             Ticker Last Price   YTD      -1Y
                  MSCI WORLD                     MXWO      2806,07    4,31%   14,06%
                  All Members
             1)   CARNIVAL CORP                  CCL         27,47 26,82% -56,89%
             2)   GALAPAGOS NV                   GLPG        69,54 -13,59% -56,85%
             3)   OCCIDENTAL PETROLEUM CORP      OXY         30,98 78,97% -56,63%
             4)   AIR CANADA                     AC          29,67 30,30% -53,06%
             5)   ROLLS-ROYCE HOLDINGS PLC       RR/         113,8   2,29% -52,55%
             6)   ABN AMRO BANK NV-CVA           ABN          10,2 27,18% -50,55%
             7)   UNIBAIL-RODAMCO-WESTFIELD      URW         70,98   9,91% -49,89%            Source: S&P Dow Jones Indices. Data as of Mar 22, 2021. Based on rolling one-year percentage
             8)   INPEX CORP                     1605          810 45,68% -49,14%             changes in the S*P 500 price index except final data point based on Mar 23, 2020 – Mar 22, 2021.
             9)   SUNCOR ENERGY INC              SU          28,83 35,04% -47,70%
            10)   OIL SEARCH LTD                 OSH          4,41 18,73% -46,82%
           Source: Bloomberg

▪   With the one-year anniversary of the market bottom, global stock-market performances over the last 12 months has been exceptionally strong. The
    market rebound has been powered by expectations for the economic recovery and a rebound in corporate profits.
▪   Three primary drivers include: (1) the vaccine (first development, then distribution), (2) monetary-policy stimulus, and (3) fiscal aid (stimulus checks, etc.).
                                                                                                                                                                                                 10
Front of Mind Today
COVID-19 is no longer the biggest ‘tail risk’
What do investors consider the biggest ‘tail risk’?
Higher than expected Inflation
A “tantrum” in the bond market
COVID-19 vaccine rollout
A bubble on Wall Street
Higher taxes
Greater regulation
Other
Source: BofA Global Fund Manager Survey; BofA Global Research
▪ This has been the best 12 months for the S&P 500 ever.
▪ However, investors primary concerns are (1) higher than expected inflation and (2) a bond market “tantrum” right now
11Macroeconomics
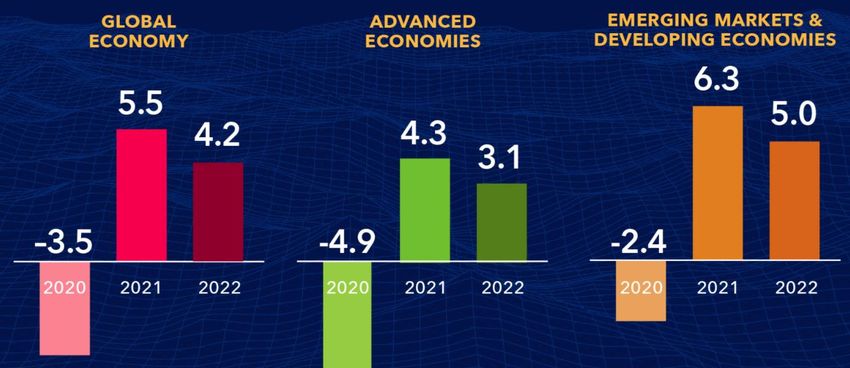
2021 Global Economic Recovery

                                 World Economic Outlook: Growth Projections
                                                            Latest Update – January 2021

                      Source: International Monetary Fund

▪   The rollout of the vaccine will boost growth & the recovery will be shaped by the extent of further policy support.
▪   The global economy is forecast to return to growth in 2021, rebounding by 5.5%, followed by more modest growth of 4.2% in 2022.
▪   But the recovery is expected to be uneven and unequal.

                                                                                                                                      13
2021 Global Economic Recovery
Latest World Economic Outlook Growth Projections
Sources: IMF, and the World Economic Outlook
14Have Authorities Delivered Too Much Stimulus?
Measures of policy responses & economic scarring relative to the GFC
Policy Response Economic Scarring
Source: Fairtree, Bloomberg, BCA Research, Bars represent peaks and bottoms during the CFC and Covid Covid crisis. As at 31 Jan 2021
15UNITED STATES The U.S. economy expanded by an annualised 4.3% in Q4 2020. The expansion was much slower compared to the 33.4% growth in Q3, as COVID-19 cases continued to rise, and restrictions hampered consumer spending. The outlook for 2021 seems brighter than a few months ago as the vaccination campaign continues and the $1.9 trillion aid bill, one of the largest economic stimulus measures in US history, was approved with some Americans already receiving stimulus checks. President Biden also recently unveiled a $2.25 trillion infrastructure plan that aims to revitalize U.S. transportation infrastructure, water systems, broadband and manufacturing, among other goals. He plans to fund this spending by increasing the corporate tax rate to 28% and implementing measures designed to prevent offshoring of profits.
UNITED STATES

                          U.S. expectations for now are:                               COVID-19 vaccine doses administered per 100
                                                                                                                                   people
               Overview                    Actual   Q1     Q2     Q3     Q4     2022

         GDP Growth Rate (%)                4.30    2.5    2.5    2.9    1.7     1.7
     GDP Annual Growth Rate (%)             -2.40   0.2    3.4    3.7    3.8     2
       Unemployment Rate (%)                6.20     6      6     5.9    5.7     5
            Inflation Rate (%)              1.70    1.5    1.6    1.6    1.7     1.6
            Interest Rate (%)               0.25    0.25   0.25   0.25   0.25   0.25
     Government Debt to GDP (%)            107.60   125    125    125    125    122
     Business Confidence (points)           60.80   61.2   58     56     53.4   53.4
          Services PMI (points)             60.00   60     55     52     50.5   50.8
      Manufacturing PMI (points)            59.00   59     54     52     51      51
   Non Manufacturing PMI (points)           55.30   53     51     51     50      52
    Consumer Confidence (points)            84.90   83     85     82     84      84
         Retail Sales MoM (%)               -3.00   4.5    1.3    0.4    2.4     2.4
                                                                                       Source: Our World in Data – 31 March 2021, Official data collated by Our World in Data
Source: Trading Economics, 31 March 2021
UNITED STATES
Inflation Rate Retail Sales
Business Confidence Consumer Confidence
Source: Trading Economics, 31 March 2021EUROPE
The Eurozone economy shrank by 0.7 percent in the three months to
December 2020, following a record 12.5 percent expansion in the
previous three-month period. Among the bloc's largest economies,
France, Italy and the Netherlands contracted in the fourth quarter,
while GDP growth in Germany and Spain slowed sharply. For the year
2020, GDP fell by 6.6 percent, following a 1.3 percent expansion in
2019.
Manufacturing PMI jumped to a record high of 62.4 in March of 2021,
beating forecasts of 57.7, as global demand continues to recover from
the pandemic hit.
The EU parliament has agreed to fast track a digital vaccine
certificate to help European travel and kickstart the tourism industry.EUROPE
Euro Area expectations for now are: COVID-19 vaccine doses administered per 100
people
Overview Actual Q1 Q2 Q3 Q4 2022
GDP Growth Rate (%) -0.70 -1.2 1.4 3.2 1 0.5
GDP Annual Growth Rate (%) -4.90 -5.2 12.6 7.5 4 2.7
Unemployment Rate (%) 8.10 8.4 9.1 9.6 9.4 8.5
Inflation Rate (%) 1.30 1.3 1.3 1.2 1.4 1.7
Interest Rate (%) 0.00 0 0 0 0 0
Government Debt to GDP (%) 77.60 98 98 98 98 96
Business Confidence (points) -0.14 -0.2 0.5 0.3 0.4 1
Manufacturing PMI (points) 62.40 62.4 54 53.2 52 52
Services PMI (points) 48.80 48.8 53.6 52.5 51 55
Consumer Confidence (points) -10.80 -10.8 -16 -11 -12 -8
Retail Sales MoM (%) -5.90 1 0.9 -0.6 0.7 0.6
Source: Trading Economics, 31 March 2021
Source: Our World in Data – 31 March 2021, Official data collated by Our World in DataEUROPE
Consumer Confidence Business Confidence
Manufacturing PMI Services PMI
Source: Trading Economics, 7 January 2021UNITED KINGDOM
UK GDP expanded 1.3 percent in the three months to December
2020, supported by spending from government towards healthcare
and education and the further easing of lockdown restrictions.
Still, the contraction for 2020 was revised to 9.8%, from the first
estimate of a 9.9% decline.
The UK has implemented one of the more successful vaccination
programmes, with half of their adult population having received a jab
by mid March. This is crucial for the UK’s much needed economic
recovery as they suffered the worst recession in G7 and had one of
the highest coronavirus death rated in the world.UNITED KINGDOM
United Kingdom expectations for now are: COVID-19 vaccine doses administered per 100
Overview Actual Q1 Q2 Q3 Q4 2022
people
GDP Growth Rate (%) 1.30 -2.6 2.1 4.2 2.3 0.9
GDP Annual Growth Rate (%) -7.30 -4 17.5 7.5 3.8 6.5
Unemployment Rate (%) 5.00 5.2 5.5 5.8 5.6 6.1
Inflation Rate (%) 0.40 0.8 1.4 1.6 1.8 2
Interest Rate (%) 0.10 0.1 0.1 0.1 0.1 0.1
Government Debt to GDP (%) 100.20 107 107 107 107 110
Business Confidence (points) -22.00 -8 -10 -16 -8 -6
Services PMI (points) 56.80 56.8 54 53.2 52 52.9
Manufacturing PMI (points) 57.90 57.9 55 53.6 52 52.6
Consumer Confidence (points) -16.00 -16 -14 -10 -8 -6
Retail Sales MoM (%) 2.10 1 -1.6 -0.8 0.6 0.7
Source: Trading Economics, 31 March 2021 Source: Our World in Data – 31 March 2021, Official data collated by Our World in DataJAPAN
The Japanese economy advanced 2.8 percent in the three
months to December of 2020. Capital expenditure rose by 4.3
percent (vs -2.4 percent in Q3) and household consumption
advanced by 2.2 percent (vs 5.1 percent in Q3).
On an annualized basis, GDP expanded 11.7 percent in the
quarter.
Japan is bracing for a fourth coronavirus wave as infections
resurge across the country. The country plans to start vaccinating
the general public by April 12 but has stated that the effects of the
vaccine on overall case numbers won't become evident until July.
They have also become the latest country to issue digital
vaccine passports.JAPAN
Japanese expectations for now are: COVID-19 vaccine doses administered per 100
people
Overview Actual Q2 Q3 Q4 Q1 2021
GDP Growth Rate (%) 2.80 0.9 1.5 0.6 0.5 0.5
GDP Annual Growth Rate (%) -1.40 -1 8.5 4 2.6 2
Unemployment Rate (%) 2.90 2.9 2.7 2.6 2.6 2.5
Inflation Rate (%) -0.40 -0.2 0 0.4 0.3 0.7
Interest Rate (%) -0.10 -0.1 -0.1 -0.1 -0.1 -0.1
Government Debt to GDP (%) 236.60 255 255 255 255 260
Business Confidence (points) -10.00 -2 2 4 5 10
Manufacturing PMI (points) 52.00 52 52 51 51 50.5
Services PMI (points) 46.50 46.5 51 52 51.9 51.6
Consumer Confidence (points) 33.80 36 42 43 42 42
Retail Sales MoM (%) 3.10 0.8 1.2 0.3 0.7 0.6
Source: Trading Economics, 31 March 2021
Source: Our World in Data – 31 March 2021, Official data collated by Our World in DataCHINA
The Chinese economy advanced 2.6% yoy in Q4 2020. This was the
weakest quarterly growth since a contraction in the first quarter of
2020. For full 2020 however, the economy expanded 2.3 percent and
China is likely to be the only major economy to avoid contraction due to
the COVID-19 shocks. Overall, in 2020, the country's GDP expanded
2.3%, the slowest pace in more than four decades.
Rising global demand for medical equipment and work-from-home
technology boosted exports in 2020. While China’s exports surged in
the first two months of the year, reflecting strong global demand for
manufactured goods.CHINA
China’s expectations for now are: COVID-19 vaccine doses administered per 100
Overview Actual Q2 Q3 Q4 Q1 2021 people
GDP Growth Rate (%) 2.60 1.6 1 1.1 1.3 1.1
GDP Annual Growth Rate (%) 6.50 6.7 5.1 5.3 5.6 5.9
Unemployment Rate (%) 5.50 5.5 5.4 5.4 5.1 5.2
Inflation Rate (%) -0.20 0.2 1.1 1.8 3.1 3.1
Interest Rate (%) 3.85 3.85 3.85 3.85 3.85 4.25
Cash Reserve Ratio (%) 12.50 12.5 12.5 12.5 12.5 12.5
Government Debt to GDP (%) 52.60 65 65 65 65 70
Business Confidence (points) 51.90 51.1 51.7 52 52 52
Services PMI (points) 51.50 53 52.9 53 52.2 51.5
Non Manufacturing PMI (%) 56.30 51.9 51.4 51 53 52.9
Manufacturing PMI (points) 50.90 51.2 53 52 51.7 50.7
Consumer Confidence (points) 122.80 128 124 124 120 120
Retail Sales MoM (%) 0.56 1.8 0.4 0.3 0.3 0.5
Source: Trading Economics, 31 March 2021
Source: Our World in Data – 31 March 2021, Official data collated by Our World in DataCHINA
Manufacturing PMI Non-Manufacturing PMI
Business Confidence Consumer Confidence
Source: Trading Economics, 31 March 2021United States - China Trade Deal
Unattainable Trade Targets
Target for Chinese purchases of U.S. goods in trade out of reach
Sources: Bloomberg calculations based on Chinese customs data
29Global Investment Themes
Global Economic Rebound

•   As the world emerges from the COVID-19 crisis, expectations are for an economic
    rebound in 2021-2022.

•   Vaccine rollouts and the extent of further policy support will shape the recovery.

•   The strength of the recovery is projected to vary significantly across countries,
    depending on access to (1) medical interventions, (2) effectiveness of policy
    support and (3) structural characteristics entering the crisis.
Inflation Concerns
Source: Bloomberg
• It was a tough quarter for bonds.
• Not even the Federal Reserve’s insistence that it will keep financial conditions as
lenient as possible has been enough to keep longer-dated bond yields down.
• As a result, the Bloomberg Barclays Treasuries index has fallen more than 4% for
the quarter, the first time this has happened since the first and third quarters of 1980.
• The assumption in the market, is that more inflation is coming; and that the Fed
will have to raise rates in due course to deal with it.Inflation Concerns
The Fed’s Dot Plot Inflation Fears
Sources: FOMC, GSAM Source: Bloomberg
• 10-year inflation break-evens are at their highest since 2014 – albeit still
• Relative to the December meeting, more committee members expect
at historically low levels
higher rates by 2023 year-end.
• This shouldn’t be a concern for the Fed that appears to mean it when it says
• Still, the majority of members anticipate a policy hold through 2023,
that it wants inflation to average above 2% for a while. And actual
against market expectation for ~2.5 rate hikes.
measures of consumer prices are still unremarkable, and well below 2%.
• But the shift in market psychology has been very swift, with the prospect
of a return to secular inflation discussed seemingly everywhere.
33Inflation Concerns
For Now, Inflation Under Control “Pockets "of Demand
Source: Bloomberg Sources: Bloomberg, International Center for Finance at Yale University, GS Global Investment Research
• The base effect caused by the shutdown together with higher crude oil • inflation has been more pronounced within a subset of goods such as
prices compared to 12-months ago are reasons to expect higher used cars, sporting goods, and electronics, driven both by an unexpected
inflation. increase in consumer demand and temporary supply chain constraints.
• However, current data doesn’t look alarming with U.S. core U.S. • “While pent-up demand, supply-chain bottlenecks and the comparison with
consumer prices (excluding fuel and food) in Feb (1,4%) below very weak price pressures last year will drive prices higher”, the Fed chair
expectations and remains somewhat benign. said, “Our best view is that the effect on inflation will be neither particularly
large nor persistent.”
34USD Weakness • Higher yields in the U.S. attract flows to the U.S. which strengthen the dollar. • A higher dollar tends to dampen inflation. • Over the last four years, there is a distinct tendency for the currency to follow the path set by the gap between U.S. and German bond yields, with a lag of a couple of months. • The dollar’s rebound has taken many by surprise, and it could change much of the presiding narrative of a big reflation this year. It could also derail investment in emerging markets.
Value vs. Growth

    Source: Bloomberg

•   Value stocks have underperformed for most of the previous decade.

•   In recent months, the belief that inflation is coming has seen investors rotate out
    of growth stocks into value stocks that are believed to benefit from economic
    reflation, or even inflation.

•   In general, when growth is less scarce, then growth companies — bought for their
    expanding profits — are less exciting.

•   It is at such points that value stocks outperform.
Value vs. Growth
U.S. Value vs. Growth Stocks Share of the Biggest Sector in the U.S.
10-year Annualised Returns The largest equity sector has typically reflected the key drivers of the economy
Source: BofA Research Investment Committee, Fama & French Source: Datastream, Worldscope, Goldman Sachs Global Investment Research
37A Commodities Revival
Source: Bloomberg
• President Joe Biden’s proposed $2.1 trillion infrastructure spending program, along
with numerous other countries infrastructure spending programs provide a strong
demand underpin for infrastructure and infrastructure related industries.
• This segment of the market fared very well during the first years of this century on the
back of the “BRICS” phenomenon, but post the GFC, they have underwhelmed.
• Industrial metals a natural beneficiary.
• Cuts in brent crude oil production by OPEC+ has seen a rebound in prices in Q1
2021Market Bubble?
S&P 500 Index
Source Data: Robert Sheller (Cyclically Adjusted PE Ratio or CAPE)
• With many equity markets reaching new highs, and record issuance and deal
activity, there have been growing concerns over a developing financial market
bubble.
• The CAPE Ratio is an acronym for the Cyclically-Adjusted Price-to-Earnings Ratio.
The ratio is calculated by dividing a company's stock price by the average of the
company's earnings for the last ten years, adjusted for inflation.
• Right now, the CAPE Ratio is the 2nd most expensive it's been in history.Characteristics of bubbles
Most famous financial bubbles Hallmarks of most financial bubbles
around their peak and the S&P 500 include the following characteristics:
Rebased price performance, 1 year before bubble peak = 100
1. Excessive price appreciation & extreme valuations
2. New valuation approaches justified
3. Increased market concentration
4. Frantic speculation and investor flows
5. Easy credit, low rates & rising leverage
6. Booming corporate activity
7. New Era narrative and technology innovations
8. Late Cycle economic boom
9. The emergence of accounting scandals and irregularities
Sources: Bloomberg, International Center for Finance at Yale University, Goldman Sachs Global Investment Research
40The Current Scorecard
Summary table of Bubble Characteristics and Risks
Current Market Conditions
Source: Goldman Sachs Global Investment Research
• There are signs of complacency and heightened optimism in the market.
• Nevertheless, the fundamental factors that drive the market and the early stage of the economic cycle would suggest that we are far away from a
bubble or bear market.
41And as a reminder
The difficulties of trying to time the market
Bank of America looked at the impact of missing the market’s best and worst days each decade.
Source: Bank of America, S&P 500 returns
• Looking at data going back to 1930, if an investor missed the S&P 500's 10 best days each decade, the total return would stand at 28%. If, on the other hand,
the investor held steady through the ups and downs, the return would have been 17,715%.
• "Remaining invested during turbulent times can help recover losses following bear markets - it takes about 1,100 trading days on average to recover losses
after a bear market,"
42Global Outlook
▪ Financial markets continue to look forward to the second half of 2021 and the expected strong economic recovery for the global economy as the world
emerges from the pandemic.
▪ There is still significant fiscal and monetary support being offered to the major economies of the world.
▪ Investors have also been encouraged by the successful roll-out of the vaccine programs in select countries in recent months.
▪ However, the rollout of vaccines (and access) has been unequal across the globe, creating a “K-shaped” recovery.
▪ This bullish sentiment around economic growth has been further boosted by significant fiscal stimulus from the new Biden administration ($1.9trn
stimulus package passed and a further $2,25trn longer-term infrastructure program proposed).
▪ This positive landscape needs to be measured against extended asset class valuations.
▪ Whilst central banks including the Fed’s “language” to financial markets has remained accommodative, investors are pricing in higher inflation
expectations – this is best reflected in U.S. Treasury yields.
▪ As a result of higher growth expectations (and inflation), an important theme prevalent in markets at the moment is the reflationary trade and with it, the
switch from growth orientated stocks to value stocks.
▪ Strengthening U.S. Treasury yields may also limit recent weakness in the U.S. Dollar. This will in turn be a headwind for emerging markets.
▪ The current market environment is likely to see a greater dispersion in returns across markets and asset classes, requiring investors to focus on
fundamentals.
▪ To this end, we are advocating a measured approach across all our strategies with a constructive view on risk assets.South African Landscape
SOUTH AFRICA

South Africa's economy grew by an annualised 6.3 percent
in the fourth quarter of 2020, with manufacturing, construction
  and trade leading the growth as government’s response to
COVID-19 remained dynamic. Considering the full year of 2020,
 the GDP shrank 7%, the most since 1946, as the devastating
     impact of COVID-19 weighed heavily on the economy.

  President Ramaphosa has emphasized the crucial need for
 South Africans to remain cautious of the virus, while vaccines
 start to roll out across South Africa, in order to avoid a third
 and deadlier COVID-19 wave. The political landscape remains
     in the spotlight as moves against corruption intensify.
SOUTH AFRICA
South Africa’s expectations for now are: COVID-19 vaccine doses administered per 100
Overview Actual Q1 Q2 Q3 Q4 2022 people
GDP Growth Rate (%)
6.30 -1.3 0.8 1.4 2 2.1
GDP Annual Growth Rate (%)
-4.10 -0.2 1.3 3.4 3.8 2.4
Unemployment Rate (%)
32.50 29 27 27.4 27.1 26.2
Inflation Rate (%)
2.90 3.2 4.9 4.5 4.7 4.4
Interest Rate (%)
3.50 3.5 3.75 3.75 4 4
Government Debt to GDP (%)
83.00 90 90 90 90 92
Business Confidence (points)
35.00 35 30 32 35 38
Manufacturing PMI (points)
53.00 55 52 54 52.2 51.7
Consumer Confidence (points)
-9.00 -9 -12 -10 -3 8
Retail Sales MoM (%) -1.60 -1 -0.7 2.3 -2.4 1.3
Source: Trading Economics, 31 March 2021
Source: Our World in Data – 31 March 2021, Official data collated by Our World in DataSA’s Confidence Crisis
This level of confidence was last felt in 1985’s Rubicon Speech
Sources: IMF, and the World Economic Outlook
Source: Fairtree
47SA’s Confidence Crisis
Lack of economic confidence shows in the numbers
Source: Corion Capital Source: Economists.co.za
48SA Leading Indicator
The upward trend in the leading indicator signals that the
South African economy is on track to recover
Source: Fairtree
49Recovery comes at a cost
A Number of EM Countries are projected to Be Highly Indebted by 2025
Sources: Goldman Sachs Global Investment Research
50The Rand(om)
The rand relative to the US Dollar over 25 Years
Source: Trading Economics, 6 April 2021
▪ After appreciating by 23% over the past 12 months, the Rand looks to remain relatively stable over the oncoming months, although
consensus suggests possible future depreciation relative to the dollar.
▪ Stronger commodity prices and relative attractiveness of emerging markets remain a tailwind for the rand against weak
economic fundamentals.
51South African Outlook
▪ Stronger commodity prices resulting from fiscal stimulus programs across the globe to benefit South Africa.
▪ There have been some “green shoots” in recent months with corporate profits and economic data surprising to the upside.
▪ Foreign interest in our local market has also regained some momentum.
▪ Nevertheless, South Africa’s fundamentals remain weak, with government spending relative to tax collection under severe
pressure - this is not sustainable.
▪ Eskom continues to be a headache for the country’s economy and remains a headwind to an economic recovery.
▪ After looking cheap for most of 2020, the rand has quickly moved to “fair value” (and beyond) - Fair Value R/$ 15.00 – 16.00.
Nevertheless, the rand has a tendency of “overshooting”.
▪ The SARB has priced in two rate hikes in 2021 of 25bps each. This suggests that the rate cutting cycle has bottomed.
▪ President Ramaphosa’s campaign to route out corruption within the ANC continues to gain momentum whilst infighting amongst
the ruling party still poses a major risk.
▪ SA’s real yield remains attractive for global investors (search for yield).MARKET RISKS
Risk Rating
    Market Risks
                            1   2     3     4   5
Global Economic Rebound               3
   COVID-19 Variants            2
   Vaccine Inequality                       4
Global Inflation Concerns                   4
      SA Recovery                     3
     SA Debt Crisis                   3
Market Expectations
AgendaReturns: Major Asset Classes
Expected
                                               Equities: CAPE Ratio

                         Current
                         Median
                         Fair Value

   Source: Research Affiliates, 6 April 2021
AgendaReturns: Major Asset Classes
Expected
10 Year Expected Return vs. Volatility
Source: Research Affiliates, 6 April 2021AgendaReturns: Global Bonds
Expected
Core Bonds: 10 Year Expected Returns
Source: Research Affiliates, 6 April 2021AgendaReturns: Global Credit
Expected
Credit: 10 Year Expected Returns
Source: Research Affiliates, 6 April 2021AgendaReturns: Yield Assets
Expected
Index Current Yield Capital Appreciation Total Return (rolling 12 m) in ZAR
SA Listed Property 10,0% 5,0% 15,0%
SA Preference Shares 6,5% 5,0% 11,5%
SA 10 Year Bond 8,8% 1,6% 10,4%
Global REIT 2,6% 3,0% 5,6%
Emerging Market Bonds 4,8% -0,7% 4,1%
SA Money Market 3,7% 0,0% 3,7%
Investment Grade Corporate Bonds 3,1% -1,3% 1,8%
US 10 Year Treasury 1,6% -1,1% 0,5%
12 M LIBOR 0,0% 0,0% 0,0%
Source: StrategiQ CapitalAgenda Price-Earnings (PE): Major Indices Source: Bloomberg, StrategiQ Capital
Agenda
Price-Earnings (PE): South African Indices

Source: Bloomberg, StrategiQ Capital
AgendaReturns: SA Government Yield
Expected

                               SA 10 year is cheap    As of 31 March 2021

                                        US 10 Yr             1,72
                                 SA CPI (1 YR Avg)           3,03
                             US Core CPI (1 YR Avg)         (1,09)
                              SA Sovereign Spread            2,33
                                       SA 10yr FV            5,99
                                       Trading @             9,54
                               Cheap / (Expensive)         355bps

Source: Bloomberg, StrategiQ Capital
ASSET ALLOCATION
OFFSHORE MARKETS

                           Q2     Q1
Global Asset Allocation                                                                            Comments
                          2021   2021

                                          We remain marginally over-weight equities. We expect a cyclical upswing in economic activity in 2021 which will be
                                          supportive of company earnings. However, markets have already partially priced this in with valuation multiples looking
                                          expensive. Importantly though, this view needs to be measured in relation to extremely accommodative conditions with
   Offshore Equity                        record amounts of stimulus in the global financial system, providing an underpin to equities. We acknowledge the
                                          market’s view of higher future inflation and the rotation from growth orientated businesses towards value orientated
                                          opportunities. We however prefer to own high quality growth stocks through an investment cycle and will be mindful of
                                          this in our portfolio construction process.

                                          An anticipated cyclical upswing in economic activity in 2021 together with attractive valuation multiples are reasons to be
  Offshore Property        N       N      positive on the global property sector. However, structural changes to consumer behaviour caused by C-19 lockdowns
                                          remain unclear and therefore we remain tactically neutral the sector in the second quarter of 2021.

                                          With real yields declining amid rising inflation expectations, we remain underweight sovereign debt. We still prefer credit,
Offshore Fixed Income                     albeit credit spreads have compressed in recent months. In this globally low yield environment, we also favour emerging
                                          market debt and inflation-linked bonds.

                                          Given the potential for inflation risk facing fixed income assets, cash currently provides multi-asset portfolios with a more
    Offshore Cash          N              sensible hedge against market volatility associated with risk assets.

                                                                N
                                 Underweight   Moderately     Neutral   Moderately    Overweight
                                               underweight              overweight
LOCAL MARKETS
Q2 Q1
SA Asset Classes Comments
2021 2021
We upgrade our view on SA equity to moderately over-weight after recent company results have shown SA Inc. to be
more resilient than initially expected. Encouraging economic and sentiment trends further support this view. Overall,
SA Equity N local equity valuations require economic growth to further unlock value which we will be closely monitoring. We prefer
resource shares that are likely to benefit from a global upswing in 2021 with selective buying amongst the industrial and
financial sectors.
SA government bonds offer good relative value with real yields in excess of >300bps in hard currency which can't be
SA Fixed Income ignored if the carry trade remains relevant for SA bonds. We are less constructive on SA credit.
With the South African Reserve Bank cutting interest rates by 350 bps last year to 63-year lows, the positive real return
SA Cash opportunity in cash-like strategies has been eroded away. After costs, cash-like investments now carry a negative real
return.
The South African listed property market screens extremely cheap. However, the impacts of C-19 has had a
devastating impact on the sector over the short-to-medium term, both from an occupancy and rental escalation
SA Listed Property N perspective. The attractive bottom-up long-term opportunity needs to therefore be considered against the tough macro
backdrop facing the sector. As macro-economic factors have improved in recent months, we upgrade the asset class to
moderately over-weight.
In a low yield environment, preference shares offer an attractive yield and favourable tax treatment. The majority of the
Preference Shares sector is also trading at meaningful discounts to their par values and the SARB has indicated that the rate cutting cycle
may have bottomed.
The potential for short-term rand strength to be driven by a weakening U.S. trade-weighted dollar and positive emerging
$/R (+ for ZAR strength) market momentum was quickly priced into the rand in recent months, driving our view to be marginally under-weight the
rand.
N
Underweight Moderately Neutral Moderately Overweight
underweight overweightTHANK YOU | Q&A 27 (0)10 597 7506 | enquiries@hewettwealth.co.za | www.hewettwealth.co.za
You can also read