How Packaging Materials influence the Consumers' Purchase Intention.
←
→
Page content transcription
If your browser does not render page correctly, please read the page content below

How Packaging Materials influence the
  Consumers’ Purchase Intention.
        The Mediation Role of Perceived Quality.

       Carolina Pinto Gama de Castro Pereira

           Dissertation written under the supervision of
  Prof. Daniel Fernandes with the collaboration of industry expert
                         Paulo Romeiro

 Dissertation submitted in partial fulfilment of requirements for the MSc in
Management with Specialization in Strategic Marketing, at the Universidade
                    Católica Portuguesa, January 2021.
ABSTRACT

Title: “How Packaging Materials influence the Consumers’ Purchase Intention. The Mediation
Role of Perceived Quality.”

Author: Carolina Pinto Gama de Castro Pereira
Nowadays, the Global Warming and Climate Change urgency have become undeniable. The
disposal practice is universally recognized as one of the main causes of this societal challenge.
As a consequence, the introduction of Environmentally Friendly (EF) Packaging Materials
(PM) is part of the solution. Nevertheless, several questions must be raised. How do consumers
perceive different PM in terms of quality? Are consumers translating their environmental
concerns into actual purchasing behavior?
This study intends to evaluate how PM influence consumers’ purchase intentions (PIs),
considering Perceived Quality (PQ) as a mediator and Ethically Minded Consumer Behavior
(EMCB) as a moderator. After choosing two different beverages (Gin and Whisky), the study
went through four different steps: a focus group, the creation of stimuli, interviews and an
online survey. The focus group unveiled three PM (Glass, Paper and Plastic), that were
materialized under fictitious brands. The interviews aimed to test the acceptance of the stimuli.
Furthermore, a quantitative analysis using IBM SPSS Statistics was performed based on 512
questionnaires.
Results show Glass as the preferred PM in both beverages, and Paper overcome Plastic PQ and
PI’s levels. This result suggests that consumers are willing to give up on Plastic for Paper, EF
packaging options. This change of paradigm indicates the increasing reliability of consumers
on EF options. This study also demonstrated the role of PQ as a moderator on the relationship
between different PM and PIs, which was not proven in this study for the EMCB variable.

Keywords: Packaging Materials, Perceived Quality, Ethically Minded Consumer Behavior,
Beverages, Alcoholic Beverages Industry

                                                                                               ii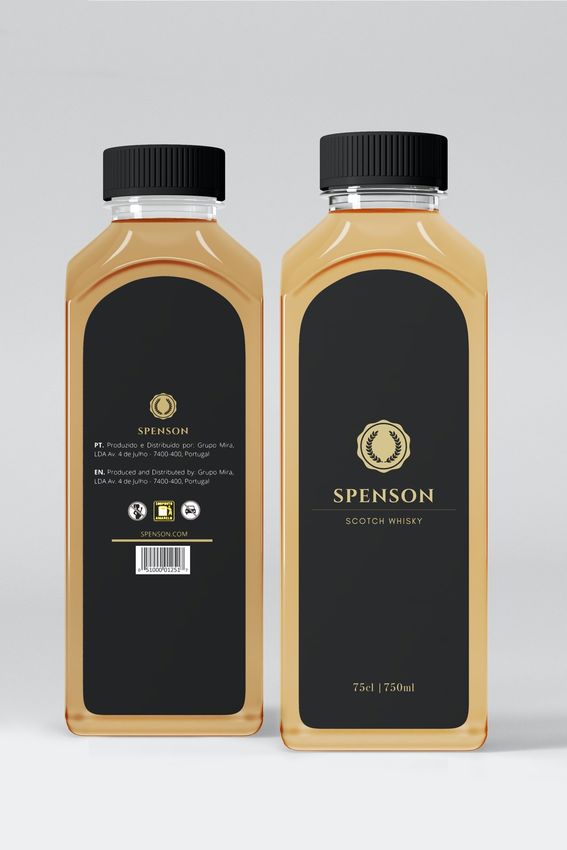
SUMÁRIO

Título: “De que forma os Materiais das Embalagens influenciam a Intenção de Compra dos
Consumidores. O efeito mediador da Qualidade Percepcionada.”

Autor: Carolina Pinto Gama de Castro Pereira
Atualmente, a urgência para responder ao Aquecimento Global e às Mudanças Climáticas
tornou-se inegável. A prática comum do descartável é universalmente reconhecida como uma
das causas destes problemas ambientais. Assim, a utilização de materiais ecológicos nas
embalagens é parte da solução. Contudo, diversas questões devem ser colocadas. Como
percepcionam os consumidores diferentes materiais, em termos de qualidade? Estarão os
consumidores a traduzir as suas preocupações ambientais no seu comportamento de compra?
Este estudo visa avaliar como os materiais das embalagens podem influenciar a Intenção de
Compra (IC), considerando a Qualidade Percepcionada (QP) como mediador e o
Comportamento Ético do Consumidor (CEC) como moderador. Após a escolha de duas bebidas
(Whisky e Gin), quatro passos foram realizados: um focus group, a criação dos estímulos,
entrevistas e um questionário online. O focus group desvendou três diferentes materiais (Vidro,
Papel e Plástico), posteriormente materializados sob marcas fictícias. As entrevistas visaram
testar a aceitação dos estímulos. Por último, foi realizada uma análise quantitativa tendo como
base 512 questionários utilizando o programa IBM-SPSS-Statistics.
Os resultados obtidos neste estudo evidenciaram que Vidro é o preferido e Papel supera
Plástico, tanto na QP como na IC das duas bebidas. Constata-se que os consumidores estão
dispostos a desistir do Plástico para o Papel, uma opção mais ecológica. Esta mudança de
paradigma indica o aumento de credibilidade em opções mais ecológicas. Esta conclusão reflete
o impacto da QP como moderador da relação entre os materiais e as suas intenções de compra,
o que não se verifica para o CEC.

Palavras-chave: Materiais das Embalagens, Qualidade Percepcionada, Comportamento Ético
do Consumidor, Bebidas, Indústria de Bebidas Alcoólicas

                                                                                             iii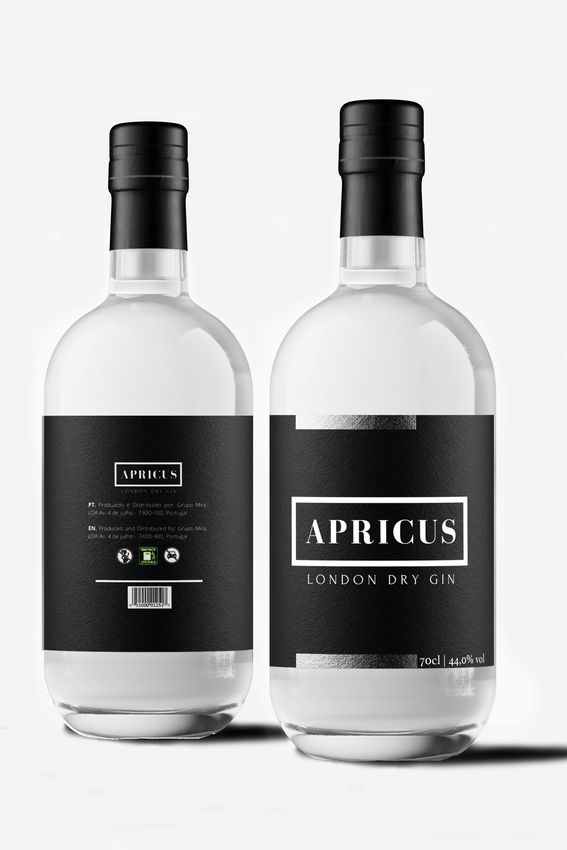
ACKNOWLEDGEMENTS

I would like to start by sharing my gratitude to my advisor, Professor Paulo Romeiro. Your
guidance was fundamental and precious to develop the theme I had in mind when I decided to
embrace this new challenge of my academic path. Thank you for your time and availability in
giving support throughout this research by sharing your knowledge, experience and
paradigmatic vision, crucial in uncertain moments. A special thanks to my supervisor, Professor
Daniel Fernandes, for your attention and availability during this journey.

A heartfelt appreciation to my parents for being an example and for your endless support
throughout my academic journey, for providing me the best conditions to get an outstanding
education. I would also like to express my gratitude to my brothers and family for the support.

Ana, my unconditional right arm during this academic milestone. I am really thankful for your
support, for being present on every step of this journey, always with your vision and availability
to listen.

A special thanks to my friend and professional photographer, Sofia. Without your expertise and
time, it could not have been possible to materialize the products as we idealized virtually.

To all of my friends, thank you for listening to my ideas and nourishing my passion for the
Consumer-Packaged Goods industry with all your contributions during this journey. I am also
grateful for your insights and support by participating in my focus group and spreading my
survey to reach as many people as possible. A special thanks to my dearest friend Inês, for all
your support and encouragement.

Thank you, all the respondents, for answering my survey!

Por fim, gostaria de dedicar a minha tese aos meus queridos avós, Maria Ana e Elísio. Muito
obrigada por todos os vossos ensinamentos e por serem a minha inspiração em querer fazer
sempre um pouco melhor a cada dia que passa, ao apostar na disciplina e ao colocar a nossa
dedicação em tudo o que fazemos.

                                                                                                iv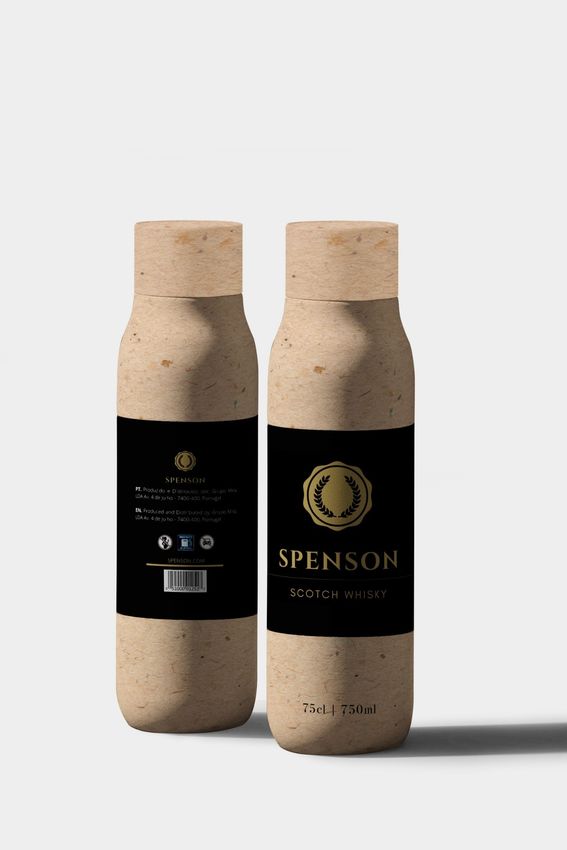
TABLE OF CONTENTS

ABSTRACT ......................................................................................................................................... ii
SUMÁRIO .......................................................................................................................................... iii
ACKNOWLEDGEMENTS ................................................................................................................iv
TABLE OF CONTENTS .....................................................................................................................v
TABLE OF FIGURES ...................................................................................................................... vii
TABLE OF TABLES ....................................................................................................................... viii
TABLE OF APPENDICES ................................................................................................................ix
GLOSSARY OF ACRONYMS ...........................................................................................................x
CHAPTER 1: INTRODUCTION .......................................................................................................1
   1.1 BACKGROUND AND PROBLEM STATEMENT ....................................................................1
   1.2 RELEVANCE ..............................................................................................................................3
   1.3 RESEARCH METHODS .............................................................................................................4
   1.4 DISSERTATION OUTLINE .......................................................................................................4
CHAPTER 2: LITERATURE REVIEW AND CONCEPTUAL FRAMEWORK .........................5
   2.1 PURCHASE INTENTION ...........................................................................................................5
   2.2 THE ROLE OF PACKAGING ....................................................................................................6
   2.1.1 PACKAGING MATERIALS ....................................................................................................7
   2.1.1.1 THE IMPACT OF PACKAGING MATERIALS ON CONSUMERS’ SUSTAINABLE
   PERCEPTIONS .................................................................................................................................8
   2.1.1.2 THE IMPACT OF PACKAGING MATERIALS ON CONSUMERS’ PERCEIVED
   QUALITY ..........................................................................................................................................9
   2.3 PERCEIVED QUALITY ........................................................................................................... 10
   2.4 ETHICALLY MINDED CONSUMER BEHAVIOR ................................................................. 11
   2.5 CONCEPTUAL FRAMEWORK ............................................................................................... 12
CHAPTER 3: METHODOLOGY .................................................................................................... 13
   3.1 RESEARCH APPROACH ......................................................................................................... 13
   3.2 SECONDARY DATA................................................................................................................ 14
   3.2.1 CHOICE OF THE SPIRIT DRINKS ....................................................................................... 14
   3.3 PRIMARY DATA...................................................................................................................... 14
   3.3.1 PACKAGING MATERIALS SELECTION............................................................................ 15
   3.3.1.1 DATA COLLECTION ......................................................................................................... 15
   3.3.1.2 MEASUREMENT / INDICATORS ..................................................................................... 16

                                                                                                                                                    v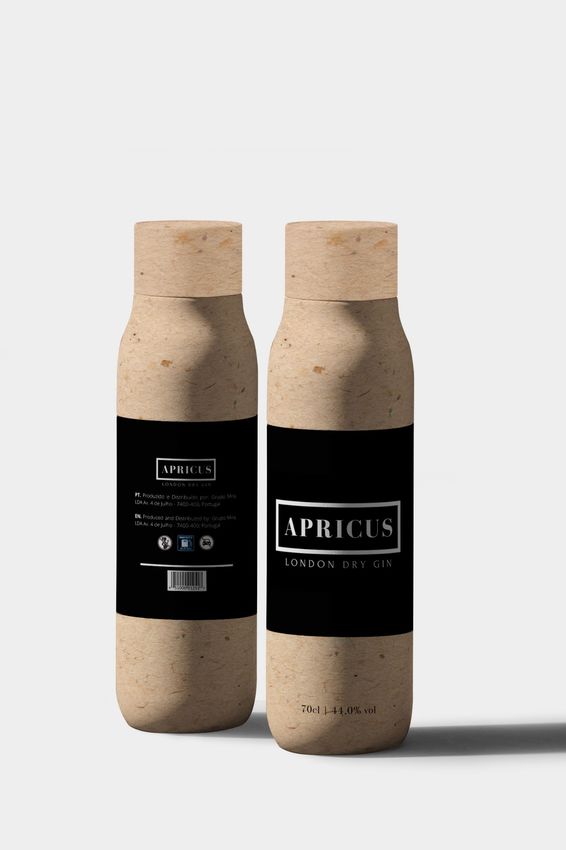
3.3.1.3 DATA ANALYSIS .............................................................................................................. 16
   3.3.2 STIMULI CREATION AND INTERPRETATION ................................................................ 17
   3.3.2.1 DATA COLLECTION ......................................................................................................... 18
   3.3.2.2 RESULTS............................................................................................................................. 18
   3.3.3 ONLINE SURVEY ................................................................................................................. 26
   3.3.3.1 PILOT TESTING ................................................................................................................. 26
   3.3.3.2 DATA COLLECTION ......................................................................................................... 26
   3.3.3.3 RESEARCH DESIGN .......................................................................................................... 26
   3.3.3.4 MEASUREMENT................................................................................................................ 27
   3.3.3.5 DATA ANALYSIS .............................................................................................................. 27
CHAPTER 4: RESULTS AND DISCUSSION ................................................................................ 29
   4.1 DATA PREPARATION ............................................................................................................ 29
   4.2 SAMPLE CHARACTERIZATION ........................................................................................... 29
   4.3 MEASUREMENT RELIABILITY ............................................................................................ 30
   4.4 MANIPULATION CHECK ....................................................................................................... 30
   4.5 HYPOTHESIS TESTING AND RESULTS............................................................................... 31
   4.5.1 PACKAGING MATERIALS AND BEVERAGES ................................................................ 31
   4.5.1.1 HYPOTHESIS 1................................................................................................................... 32
   4.5.1.2 HYPOTHESIS 2................................................................................................................... 33
   4.5.1.3 HYPOTHESIS 3................................................................................................................... 34
   4.5.1.4 TESTING THE BEVERAGE IMPACT ............................................................................... 36
   4.5.2 CONDITIONAL PROCESS ANALYSIS ............................................................................... 36
   4.5.2.1 HYPOTHESIS 4................................................................................................................... 36
   4.5.2.2 HYPOTHESIS 5................................................................................................................... 37
   4.5.2.3 FULL MODEL ..................................................................................................................... 39
CHAPTER 5: CONCLUSIONS AND LIMITATIONS .................................................................. 41
   5.1 MAIN FINDINGS ...................................................................................................................... 41
   5.2 ACADEMIC AND MANAGERIAL IMPLICATIONS ............................................................. 43
   5.3 LIMITATIONS AND FURTHER RESEARCH ........................................................................ 43
REFERENCE LIST ............................................................................................................................. I
APPENDICES ................................................................................................................................ VIII

                                                                                                                                               vi
TABLE OF FIGURES

Figure 1: Conceptual Framework ............................................................................................. 12
Figure 2: Research Approach – Process ................................................................................... 14
Figure 3: Focus Group – Individual Questionnaire .................................................................. 16
Figure 4: Focus Group – Results .............................................................................................. 17
Figure 5: Fictitious brands – Gin and Whisky ......................................................................... 17
Figure 6: Stimulus Interpretation – Results.............................................................................. 19
Figure 7: Whisky packaged with a Glass Bottle ...................................................................... 20
Figure 8: Gin packaged with a Glass Bottle ............................................................................. 21
Figure 9: Whisky packaged with a Paper Bottle ...................................................................... 22
Figure 10: Gin packaged with a Paper Bottle........................................................................... 23
Figure 11: Whisky packaged with a Plastic Bottle................................................................... 24
Figure 12: Gin packaged with a Plastic Bottle ......................................................................... 25
Figure 13: Model 5 – Mediation (M) with Moderation (W) of the direct effect of an Independent
Variable (X).............................................................................................................................. 28
Figure 14: Hypothesis 1 – Results............................................................................................ 33
Figure 15: Hypothesis 2 – Results............................................................................................ 34
Figure 16: Hypothesis 3 – Results............................................................................................ 35
Figure 17: Testing the Beverage Impact – Results .................................................................. 36
Figure 18: Statistical Model – Mediation – Coefficients ......................................................... 37
Figure 19: Statistical Model – Moderation – Coefficients ....................................................... 38
Figure 20: Interaction Effect of PM*EMCB on PI – Moderation............................................ 39
Figure 21: Full Model .............................................................................................................. 40

                                                                                                                                          vii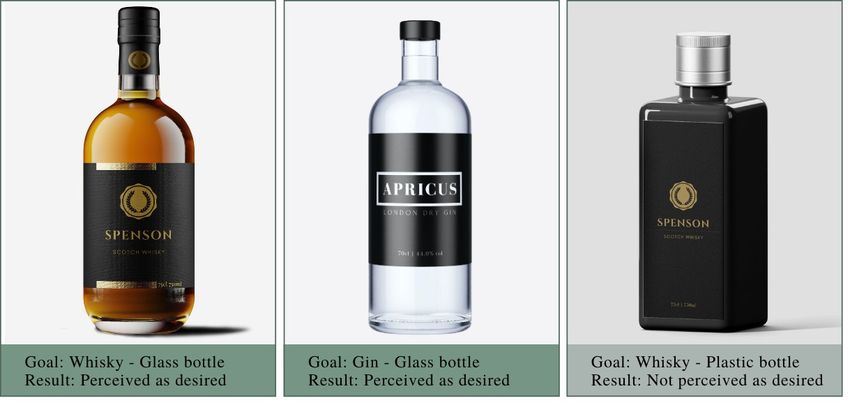
TABLE OF TABLES

Table 1: Operational Model ..................................................................................................... 27
Table 2: Illustration of the valid responses by stimulus ........................................................... 29
Table 3: Cronbach’s alpha test results ...................................................................................... 30

                                                                                                                               viii
TABLE OF APPENDICES

Appendix 1: Focus Group – Participants Demographics ...................................................... VIII
Appendix 2: Focus Group – Discussion Guide ..................................................................... VIII
Appendix 3: Semi-structured interviews – Participants Demographics................................... IX
Appendix 4: Online Survey ...................................................................................................... IX
Appendix 5: Construct Details ............................................................................................... XV
Appendix 6: Main Study – Demographics ............................................................................ XVI
Appendix 7: Main Study – Habits and Drives of consumption ......................................... XVIII
Appendix 8: Main Study – Cronbach’s Alpha Analysis .................................................... XVIII
Appendix 9: Manipulation Check – Descriptive Statistics ................................................... XIX
Appendix 10: Manipulation Check – Tests of Normality – Kolmogorov-Smirnov .............. XX
Appendix 11: Manipulation Check – Mann-Whitney U-Test ................................................ XX
Appendix 12: Hypothesis – Tests of Normality – Kolmogorov-Smirnov ............................ XXI
Appendix 13: Hypothesis – Levene's Test for Equality of Variances – PQ ......................... XXI
Appendix 14: Hypothesis – Levene's Test for Equality of Variances – PI ........................... XXI
Appendix 15: Hypothesis 1.a – PQ ....................................................................................... XXI
Appendix 16: Hypothesis 1.b – PI ....................................................................................... XXII
Appendix 17: Hypothesis 2.a – PQ .................................................................................... XXIII
Appendix 18: Hypothesis 2.b – PI ..................................................................................... XXIII
Appendix 19: Hypothesis 3.a – PQ .................................................................................... XXIV
Appendix 20: Hypothesis 3.b – PI ...................................................................................... XXV
Appendix 21: Beverages Testing – PQ ............................................................................... XXV
Appendix 22: Beverages Testing – PI ................................................................................ XXVI
Appendix 23: Mediation (PQ) – Model 4 ......................................................................... XXVII
Appendix 24: Moderation (EMCB) – Model 1 ................................................................... XXX
Appendix 25: Full Model – Model 5 ............................................................................... XXXIII

                                                                                                                                 ix
GLOSSARY OF ACRONYMS

PM       Packaging Materials
PI       Purchase Intention
PQ       Perceived Quality
EMCB     Ethically Minded Consumer Behavior
EF       Environmentally Friendly
Non-EF   Non-Environmentally Friendly
CPQ      Capable to Preserve the Quality
IPQ      Incapable to Preserve the Quality

                                              x
CHAPTER 1: INTRODUCTION
1.1 Background and Problem Statement
Due to the increasingly fast path of consumer’s buying behavior, packaging has taken on
different roles, besides being used to fulfill its primary purpose of responding to functional
necessities (Siddiqui, 2019). Nowadays, the packaging is considered an indispensable
marketing tool, and essential to optimize logistics activities (Rundh, 2005).
Because of the aggressive competition’s environment to captures customers’ attention by
companies, also justified by the fast standard of living, the packaging is perceived as a crucial
vehicle for brand communication, and as a means of obtaining a competitive advantage over
competitors (Hussain et al., 2015). Past literature has shown that around two-thirds of
supermarket purchases are decided in-store (Schoormans & Robben, 1997), which confirms the
power of packaging in influencing consumers’ Purchase Intention (PI) (Hussain et al., 2015).
Besides the crucial impact that packaging has on consumers’ daily lives, Packaging Materials
(PM) are used to produce the packaging as a whole, which will ensure the life cycle of the
product. After usage, the packaging becomes unnecessary (Steenis et al., 2017) . However, the
disposable practice has been adopted all over the world, negatively contributing to the
environment. The conventional plastic packaging is one of the major reasons for this bad
practice that confronts society with serious pollution problems since it is predominantly chosen
by most companies due to its low price and capability to be adapted for any type of products
(Cooper, 2013). In fact, the usage of plastic materials exceeds in a large-scale other material
such as paper, paperboard, metal and glass. In Europe, plastic has resulted in around 30 kg
packaging waste annually per inhabitant in 2017 (Eurostat, 2020). Consequently, one of the
biggest challenges of the 21st century concerns the necessity to protect the environment of the
large amount of waste produced by human activity, which can only be minimized by adapting
the world economy practices on behalf of environmental necessities (Geueke et al., 2018). To
do so, the introduction of Environmentally Friendly (EF) packaging can be part of the solution
(Geueke et al., 2018).
In fact, with the undeniable urge to adapt the world economy practices on behalf of
environmental necessities, in the Consumer-Packaged Goods industry, several companies have
started recently to embrace programs for reducing their ecological footprint by using
1sustainable PM. The alcoholic beverage industry has been a pioneer on this matter, being the
British global leader Diageo Plc one of them. This company will launch on the market the
“world’s first plastic-free paper-based spirits bottle” in 2021, under their sub-brand Johnnie
Walker (Diageo, 2020; Forbes, 2020). This innovative bottle is made of paper leaving apart the
iconic Johnnie Walker glass bottle. Another example of this kind of innovation is Carlsberg,
which is working on the first paper beer bottle in the world, fully recyclable and made from
wood fibers (Carlsberg, 2019).
Nevertheless, it is important to highlight that besides the shift made by companies for adopting
EF PM, a sustainable world can only be possible if consumer’s perceptions of this type of
material are considered as part of the equation. It is scientifically evidenced that is through
packaging that consumers infer quality perceptions (Becker et al., 2011; van Rompay et al.,
2016), a variable studied to influence significantly consumers’ PI (T. Z. Chang & Wildt, 1994;
Ketelsen et al., 2020; Mugge & Schoormans, 2012). Having this in mind, it becomes crucial for
companies to understand if their shifts for EF PM will generate a good acceptance by the
consumers regarding Perceived Quality (PQ) of their products.
Having this said, this investigation aims to understand how different PM affect consumers’
perceptions. To do so, several PM will be studied regarding their Environmental Friendliness
and Capability to Preserve the Quality of the product. In addition, a special attention will be
given to evaluate how the ethical behavior of consumers impacts the relation between
packaging material towards PI.
In summary, the problem statement can be defined as:
How does Perceived Quality and Ethical Minded Consumer Behavior impact the
Consumers’ Purchase Intention for different Packaging Materials?
The following research questions were developed to address the problem statement:
RQ1: What is the impact of different Packaging Materials on Consumers’ Purchase Intentions?
RQ2: Does Perceived Quality mediates Consumers’ Purchase Intention for different
Packaging Materials?
2RQ2a: Do Purchase Intention and Perceived Quality differ across Packaging Materials
for different beverages?
RQ3: How does Ethically Minded Consumer Behavior impact the Consumers’ Purchase
Intention for different beverage Packaging Materials?
In this way, this study aims to shed new light on how consumers perceived quality towards
different packaging materials across alcoholic beverages, without neglecting the effect of
ethical behavior and the consequent effect on consumers’ PI.
1.2 Relevance
It is unquestionable the urge to adapt consumption habits and behaviors, in favor of
environmental sustainability, by reducing the ecological footprint of human beings. This topic
was chosen to be explored in this thesis for being vital for the future of society. It is of current
interest since several companies have already started to develop projects to respond to this
societal challenge by applying packaging sustainability procedures. However, for this new
strategy of companies to be successful, it is necessary to be aware that, accordingly to the
available literature, PM can affect consumers’ quality perceptions (Ketelsen et al., 2020).
Despite this finding’s relevance, there is a lack of investigation for understanding how PM can
influence consumers’ purchase perception (Steenis et al., 2017).
The irrefutable power of color (Rettie & Brewer, 2000) or the use of typefaces (Celhay &
Trinquecoste, 2015) on every single packaging are features with a greater impact in consumers’
perceptions. Nevertheless, little attention was paid to the possible influence of PM in PQ that
is one of the variables more valuable for consumers (Ketelsen et al., 2020). For this reason, this
new study aims to contribute to a better understanding of the relationships between different
PM and consumers’ PQ, with implications for PI and how the EMCB can play a role in this
process.
In academic terms, this thesis intends to understand how consumers perceive different PM in
terms of their Environmental Friendliness and Capability to Preserve the Quality of products,
and how those perceptions of different PM are reflected on PIs. Additionally, PQ will be tested
as a possible mediator of this relationship and EMCB as a possible moderator.
3Concerning the managerial relevance, this study aims to highlight, for both managers and
marketers, which PM are better perceived by consumers and how those perceptions can
influence their consumption decisions in the alcoholic beverages industry. Thereby,
understanding how consumers perceive each packaging material, companies can align their
main goal of satisfying consumers’ needs by choosing specific PM, ensuring the best of
consumers’ perceptions and, at the same time, sustainable practices.
1.3 Research Methods
To address the problem statement above-mentioned, both secondary and primary data, will be
considered. Concerning secondary data, a review of the existing literature will be conducted to
critically highlight the main findings regarding the variables studied under this investigation.
Past literature will also be used to support the formulated hypothesis and to evidence the best
constructs to use when studying the selected variables. After having decided the two alcoholic
beverages to carry out this research, based on secondary data, three different studies will be
done, each one with a different purpose. In the beginning, a focus group will be designed to
understand consumer’s perceptions on Environmental Friendliness and the Capability to
Preserve the Quality of the products. After defining the PM, different stimuli will be created.
To ensure the accuracy of those stimuli and consequent consumers’ acceptance, semi-structured
interviews (Saunders, M., Lewis, P., Thornhill, 2009) will be performed with real consumers.
Furthermore, an online survey will be conducted to gather data, which would be a useful step
to test the formulated hypothesis and answer the main research questions of this study after
conducting a statistical analysis using IBM SPSS Statistics.
1.4 Dissertation Outline
This dissertation will present five chapters in total. The first and introductory chapter is
followed by the second chapter, where a literature review is conducted addressing the chosen
variables under this investigation, and the conceptual framework is presented. The third chapter
aims to provide a detailed description of the research methods applied to collect data. In
addition, the procedures performed for the statistical analysis of the obtained data are also
presented. Furthermore, the fourth chapter presents the results of the statistical analysis and the
consequent interpretation of the formulated hypothesis. Lastly, in the fifth chapter, the main
conclusions and the major limitations of the study are presented, followed by research
opportunities in this area of research.
4CHAPTER 2: LITERATURE REVIEW AND CONCEPTUAL FRAMEWORK
The following chapter presents a theoretical framework regarding the research topics covered
in this thesis. It consists of a detailed analysis of the existing literature, i.e., state of the art, for
supporting the foundation of the formulated research hypotheses. As a final note, is presented
a conceptual framework.
2.1 Purchase Intention
PI is of the utmost importance within the marketing world (Morrison, 1979). PI can be defined
as a preliminary stage of consumer behavior that, under the influence of others’ attitudes and
of unexpected situations factors, leads the purchase decision on a product (Keller, 2013).
Likewise, Howard & Sheth, in 1969, argued that large differences can be noticed during the
purchase process because situational facts are unconsciously considered by the consumer, from
the moment the consumer has the intends to purchase a product until effectively decides for it
(Clawson, 1971).
Several studies have recognized a positive relationship between PI and purchase behavior
(Bemmaor, 1995; Clawson, 1971), and consequently, its ability to serve as a proxy for purchase
behavior (Morwitz et al., 2007). On the other hand, PI is useful to predict actual purchases (T.
Z. Chang & Wildt, 1994). For this reason, it is a common practice to use the PI to support
strategic decisions regarding existing products, to predict future demand (Morrison, 1979), or
to create new products (Morwitz et al., 2007). Additionally, PI is useful to decide on which
markets and for which customer segments products should be launched (Sewall, 1981).
Moreover, consumers tend to trend their PI to a large extent for the packaging (Steenkamp,
1990), a process which is influenced by several factors such as the perceived value and the PQ
(T. Z. Chang & Wildt, 1994; Mugge & Schoormans, 2012). This finding confirms that
packaging has a crucial effect on PI (Hussain et al., 2015), mainly on the food (Vilnai-Yavetz
& Koren, 2013) and the beverages (H. P. Chang et al., 2020) industries. This behavior is
justified because consumers tend to exam the package design to create a brand impression (Orth
& Malkewitz, 2008), an action that will determine whether they will effectively buy the product
or not.
52.2 The role of Packaging
The available literature shows that there is no consensus in the scientific community on the
definition of packaging.
Among researchers, the packaging is considered as an attribute of the product or is an attribute
not-product-related. When considered packaging as a product’s attribute, the literature has three
distinct currents of thoughts for its sub-division, being considered as: (1) an intrinsic attribute,
i.e., it can only be changed by modifying the physical composition of the product; (2) an
extrinsic attribute, that is not part of the product itself or (3) either both intrinsic and extrinsic
(Underwood, 2003). Contrarily, packaging can also be defined as an attribute not-product-
related, being considered one of the five elements needed to the brand identity of any brand,
along with brand name, logo & symbol, characters, and slogans (Keller, 2013). Nevertheless,
packaging assumes a predominant role in the purchase process, the moment when consumers
scan packages closely during their decision-making process (Orth & Malkewitz, 2008). The
packaging was even considered the “salesman on the shelf” by Pilditch (Rettie & Brewer,
2000).
Although those different definitions, it is universally known as the basic functions of packaging:
protection and consequential preservation, storage, and transportation of the product (Rundh,
2005). Those functions are complemented by the role of being a communicator to the final
consumer (Oki & Sasaki, 2000). As time goes by, packaging has been assuming more functions
in consumers’ life. From the user convenience as well as from the managerial point of view,
packaging serves as a marketing tool by ensuring the promotion of the product itself, and also
as a logistic tool by enabling efficiency on storage and distribution activities (Rundh, 2005).
For those reasons, packaging plays a crucial role in the competitive food (Rundh, 2005) and
beverages (H. P. Chang et al., 2020) industries due to its power to influence consumers’ PI
(Hussain et al., 2015). Moreover, the packaging is seen as an essential tool to create and develop
a consumer-based relationship, mainly for low involvement consumer nondurable products
(Underwood, 2003).
As a consequence of the fast standard of living and of the extremely competitive environment
to capture customers’ attention by companies, the packaging is perceived as a crucial vehicle
for brand communication and the advisable weapon to get a competitive advantage over
competitors (Hussain et al., 2015). Schoormans & Robben (1997) alleged that around two-
thirds of supermarket purchases are decided in-store. This statement was corroborated by
6Frontiers in 1996, who showed that it is at the point of sale that 73% of a purchase decision is
made (Rettie & Brewer, 2000). This finding is evidence of the power of packaging at the point
of sale (Kumar Agariya et al., 2012). For this reason, companies keep innovating every day to
improve their presence on the shelf. An example of this act is Walmart, an American retailer
and the actual leader the list of the world’s Top 250 global retailers (Deloitte Touche Tohmatsu
Limited, 2020), which exhaustively test whether consumer perceives the brand promise
transmitted by the package until three seconds up to 15 feet from the shelf (Keller, 2013).
2.1.1 Packaging Materials
Besides considering packaging as a whole, is essential to explore its different components and
to recognize its impact during the consumers’ decision process.
Packaging can be defined by physical evidence of the product container (Kumar Agariya et al.,
2012), including features such as shape, color, and materials (Becker et al., 2011). Those
features are considered aesthetic components of packaging (Keller, 2013) and essentials tools
for marketers to address consumers’ needs (Underwood, 2003). Consumers draw conjectures
about the product based on symbolic information given by the product’s features, and this action
is considered an implicit rather than a deliberate process (Becker et al., 2011).
There are many studies for evaluating the power of color and shape on packaging performance
(Becker et al., 2011; Grossman & Wisenbilt, 1999), in comparison with the existing variety of
PM (Ketelsen et al., 2020). Nevertheless, PM play a crucial role in consumer’s life, for having
a significant impact when comes to (1) preserve and protect the product from external factors,
(2) draw attention to new product innovation, and (3) create a positive perception regarding the
product itself (Hussain et al., 2015). In this way, PM are considered an essential means to
enhance the positioning of the brand (Becker et al., 2011) and also to influence consumers’
perceptions.
In addition to those competencies, due to the undeniable urge to adapt the world economy
practices on behalf of environmental necessities, the Consumer-Packaged Goods industry starts
to notice the change in PM used by companies to reduce their ecological footprint by using EF
materials (Ketelsen et al., 2020). Nevertheless, associated with the shift in changing PM,
literature has invoked that those changes could affect consumers’ sustainability perceptions as
well as the PQ of the product and, consequently, taste perceptions (Ketelsen et al., 2020; Steenis
et al., 2017).
72.1.1.1 The Impact of Packaging Materials on Consumers’ Sustainable Perceptions
In practical terms, PM are used to ensure the life cycle of the product, and after usage, it
becomes unnecessary (Steenis et al., 2017), voicing the disposal practice around the globe.
Conventional plastic packaging plays a role in this matter since it is a cheap material and could
be easily customized for any product. Albeit, plastic material results in many years to
accomplish environmental degradation, characteristics that contribute to littering problems,
including the catastrophic ocean pollution (Cooper, 2013). In fact, from the 50 million tons of
plastic employed in Europe, only 10% are effectively recycled due to the lack of proper
infrastructures to collect and recycle the material in several countries (Cooper, 2013). In turn,
one of the biggest challenges of the 21 st century concerns the necessity to protect the
environment from the large amount of waste produced by human activity and ensure sustainable
development of our planet (Zheng, 2012). Minimizing the enormous increase in waste and
accumulated garbage (Oki & Sasaki, 2000), such as plastic, can be done by adapting the world
economy practices on behalf of environmental necessities (Geueke et al., 2018). Thus, the
introduction of EF packaging might be part of the solution (Geueke et al., 2018).
In the available literature, the discussion on the use of the EF packaging to minimize
environmental risks has not yet addressed all aspects of this societal challenge. Several terms
have been used by researchers to classify this type of packages, such as sustainable, green
packaging, and eco-friendly packaging (Ketelsen et al., 2020). According to several
researchers, sustainable packaging can be defined as “the endeavor to reduce the product’s
footprint through altering the product’s packaging, for example, by using more EF materials”
(Magnier et al., 2016). Notwithstanding, other researchers defined sustainable packaging
according to three different levels: raw materials, production process, and waste management
(Ketelsen et al., 2020). Despite those different perspectives, it is now clear that EF materials
are crucial to shape a better future based on sustainable practices.
Two decades ago, consumers did not include in their purchase decision sustainable options.
This happened because of their limited knowledge regarding EF PM (Van Dam, 1996).
Moreover, over the last years, influenced by the Climate Change and Global Warming urgency,
several studies have shown that sustainable consumption became a real concern for consumers
(Herbes et al., 2020). Consumers perceive the PM as the main supporter of environmental
consequences (Lindh et al., 2016), and thus they are starting to choose EF packaging instead of
the standard one (Ketelsen et al., 2020).
82.1.1.2 The Impact of Packaging Materials on Consumers’ Perceived Quality
It is well-accepted in the literature that packaging quality and consequently, its materials,
significantly affect consumers’ PIs (Siddiqui, 2019). Packaging perceived as good quality are
correlated to higher taste perceptions (Elder & Krishna, 2010) and also leads to a positive
perception regarding the product itself (Hussain et al., 2015).
As stated before, one of the functions of PM is the preservation of the product (Oki & Sasaki,
2000; Rundh, 2005). Thus, the willingness of consumers to choose a certain product over others
will depend on consumers’ PQ established towards PM. As so, PQ is a variable meticulously
studied to be incorporated into companies’ strategies having as a final goal the power to
influence significantly consumers’ PI ( Chang & Wildt, 1994; Ketelsen et al., 2020; Mugge &
Schoormans, 2012).
In the case of the beverage packaging, researchers have demonstrated that consumers are
willing to jeopardize barely all the product’s attributes, for EF beverage packaging, excluding
the quality of the taste and price (van Birgelen et al., 2009). In other words, before choosing an
environmental beverage packaging, only two attributes need to be fulfilled, quality of the flavor
and price. Albeit price is considered a key factor by consumers for deciding to buy a product,
this topic is not considered in this study to avoid monetary biases when comparing other
product’s attributes. In this way, excluding the price, this investigation will focus on the PQ
followed by PM.
In light of the foregoing, a two-by-two matrix was created, including two different axes. PM
were characterized as being EF vs Non-Environmentally Friendly (NEF) and Capable to
Preserve the Quality (CPQ) of the product vs Incapable of Preserving the Quality (IPQ), which
results in four quadrants. The fourth quadrant was excluded since it corresponds to the
combination of both variables negatively conceptualized, i.e., packaging considered as NEF
and IPQ. The results obtained in previous studies show that the fourth quadrant is rejected by
consumers. This happens because consumer gives more value to the capability to preserve the
flavor’s quality than to the EF PM when choosing a particular product. As a consequence, from
a managerial and business view, the fourth quadrant would not also be viable.
According to the aforementioned, the following hypotheses are formulated:
Hypothesis 1.a: A PM perceived as EF and CPQ is preferred in terms of PQ over a
PM perceived as EF and IPQ.
9Hypothesis 1.b: A PM perceived as EF and CPQ is preferred in terms of PI over a PM
perceived as EF and IPQ
Hypothesis 2.a: A PM perceived as EF and CPQ is preferred in terms of PQ over a
PM perceived as Non-EF and CPQ
Hypothesis 2.b: A PM perceived as EF and CPQ is preferred in terms of PI over a PM
perceived as Non-EF and CPP
Hypothesis 3.a: A PM perceived as Non-EF and CPQ is preferred in terms of PQ over
a PM perceived as EF and IPQ
Hypothesis 3.b: A PM perceived as Non-EF and CPQ is preferred in terms of PI over
a PM perceived as EF and IPQ
2.3 Perceived Quality
When evaluating a product, PQ is one of the key aspects taken into consideration by consumers
(Zeithaml, 1988). Despite the constant effort made by companies in adjusting manufacturing
processes and the product design itself, greater attention is also given to improve product quality
perceptions through advertising strategies (Steenkamp, 1990).
Across the literature, instead of conceptualizing the variable as “quality”, researchers decided
to use the term “perceived quality”, since quality judgments can be affected by the needs,
perceptions, and goals of the consumers (Steenkamp, 1990). In respect of theoretical
definitions, PQ can be defined as the degree that functional attributes of the product can fulfill
the consumers’ needs (Box, 1983). Other researchers argued that PQ can be considered as the
ability of a product to offer higher levels of satisfaction to consumers relative to the available
alternatives (Steenkamp, 1990). In other words, PQ can be defined as the judgment made by a
consumer on the product’s superiority over the other options (Zeithaml, 1988). From another
perspective, PQ has to do with objective attributes of the product, which evokes consumer
satisfaction (Oxenfeldt, 1950).
It is consensual that consumers draw quality perceptions towards products’ attributes (Zeithaml,
1988). As previously mentioned, the product’s attributes were conceptualized into intrinsic cues
concerning the physical composition of the product, and extrinsic cues, which are not part of
the product but are related. Using the beverage industry as an example, intrinsic cues include
10the color, flavor, texture (Jacoby et al., 1971) and extrinsic cues concern the brand name,
warranty, and package (Zeithaml, 1988). In reality, most of the time, consumers cannot taste a
new product before purchase it. As a consequence, extrinsic cues become the only source of
credibility for consumers (Zeithaml, 1988), a fact that enhances the importance of the packaging
on consumers’ decisions, being considered the key aspect for consumers to infer quality
perceptions.
Alongside the embracing of EF materials by companies on their packages, justified by the
undeniable necessity of adopting sustainable practices, PQ should not be neglected. In fact, the
main barrier recognized by consumers to buy sustainable packaging is the lower quality
perceived (Ketelsen et al., 2020), fact that corroborates with the urge to evidence product’s
quality and taste through packaging (Steenis et al., 2017).
Therefore, the following hypothesis is formulated:
Hypothesis 4: PQ mediates the effect of PM on PI.
2.4 Ethically Minded Consumer Behavior
Nowadays, one of the main concerns of consumers is how companies behave ethically,
regarding the possible impact of their products on the environment (Bone & Corey, 2000), a
concern which has contributed to the adaptation of EF lifestyles (Liu et al., 2017).
Nevertheless, within the field of consumer behavior, it is oftentimes recognized the “attitude-
behavior gap” phenomenon, also known as the “intention-behavior gap” (Fishbein & Ajzen,
1977; Ketelsen et al., 2020). This phenomenon evidences the different behavior that exists
between the consumers who have intentions to include in their purchasing decision-making
ethical choices and those who truly translate those intentions into actual purchase decisions
(Ketelsen et al., 2020). Thus it is important to ask the consumers about what they really do
rather than measuring hypothetical situations or intentions (Sudbury-Riley & Kohlbacher,
2016).
When analyzing ethical consumer behavior, both ecological and social issues should be
addressed (Sudbury-Riley & Kohlbacher, 2016). Several well-known scales have been applied
to study ethical issues, such as the New Environmental Paradigm (Dunlap & Van Liere, 1978)
and the Consumer Ethics Scale (Muncy & Vitell, 1992), but those measurements lack on
reflecting effective behavior, concerning only beliefs and attitudes. In this way, the Ethically
11Minded Consumer Behavior (EMCB) dimension is adopted for this study because it measures
the actual behavior of consumers regarding several attitudes, such as (1) deliberation when
comparing EF products over traditional options; (2) recycling behaviors; (3) deliberation when
purchasing products with social and environmental issues associated and (4) the willingness to
buy for an ethical product. As so, the EMCB level, inherent of each respondent, is expected to
moderate how consumers behavior on their consumption habits (Sudbury-Riley & Kohlbacher,
2016).
Having this said, the following hypothesis is formulated:
Hypothesis 5: EMCB moderates the relationship between PM and PI.
2.5 Conceptual Framework
The following conceptual framework illustrates the relationship between the different variables
analyzed under this investigation (Figure 1).
Figure 1: Conceptual Framework
12CHAPTER 3: METHODOLOGY
The following chapter aims to describe the research methods used in this study. The main goal
of this section is to develop a reliable scientific method to get a robust dataset suitable for testing
the hypothesis previously mentioned. The explanation of the research plan and methods to
obtain the primary data is followed by a description of the secondary data used.
3.1 Research Approach
The main goal of this dissertation is to understand the impact of beverage PM on consumers’
PIs. For this purpose, the PQ is tested as a mediator and the EMCB as a moderator, following
a conceptual framework designed based on past literature.
To answer the research questions previously formulated, a research approach (Figure 2)
conceived to enable the practical execution was applied. This research approach was useful to
translate the conceptual framework and the hypothesis into an operational plan. Both
exploratory (semi-structured interviews and focus group) and explanatory methods (survey)
were implemented (Saunders, M., Lewis, P., Thornhill, 2009).
A first decision to be made was the selection of an industry and a product category. The
alcoholic beverage industry was chosen due to the recent effort of the world’s larger producers
in introducing sustainable packaging on the market (Forbes, 2020). To prevent the choice of
the researcher from being biased, two alcoholic beverages, Gin and Whisky, were chosen based
on the Portuguese consumers’ consumption patterns (Marktest, 2016). This decision also
allowed the two to be compared, and in particular, comparing their PM.
Secondly, a focus group was performed to discuss how participants would perceive different
PM (the independent variable of the study), regarding the Environmental Friendliness and the
CPQ of the product. This methodology allowed the selection of three different PM: Glass,
Plastic, and Paper.
Thirdly, six stimuli were created to be further included in the main study by considering the
two spirit drinks and the focus group’s findings. Nevertheless, to confirm the truthfulness under
consumers’ eyes about the stimuli created, semi-structured interviews were conducted. This
procedure was fundamental to understand if the stimuli were properly designed for being
perceived as expected and to get a sense of whether some changes were needed.
Finally, an online survey was performed with the purpose of gathering the data that was later
statistically analyzed. The questionnaire aimed to gather quantitative data, essential to test the
conceptual framework and the hypothesis, by answering the research questions previously
mentioned.
13Figure 2: Research Approach – Process
3.2 Secondary Data
To acquire a better understanding of the main variables presented on the conceptual framework
and to frame with accuracy the problem statement, secondary data was gathered from academic
journals. The information gathered through bibliographic research was essential to formulate
the research questions, to design the hypothesis, and to determine which constructs to use on
this investigation.
Additionally, the investigation was conducted considering seven PM: Plastic, Glass, Paper,
Aluminum (Ketelsen et al., 2020), Bamboo, Wood (Nurul Fazita et al., 2016), and Tetra pak
(Korkmaz et al., 2009).
3.2.1 Choice of the Spirit Drinks
The choice of the two spirit drinks was based on secondary data.
Whisky – “The classy alcoholic beverage.”
In 2015, Whisky signified almost a third of the Share of Shelf of the spirit drinks category,
being considered the beverage in this category with the highest representation (Marktest, 2016).
The segment has registered a stable representation over the last years, and in 2018 recorded an
increase of 3% in volume in comparison with the previous year, according to Nielsen
(DistribuiçãoHoje, 2019).
Gin – “The trendy alcoholic beverage.”
In 2015, Portugal registered more than one million gin consumers and the beverage represented
13% of the Share of Shelf of the spirit drinks category, which corresponds to the third beverage
with the highest representation. Over time, across the Portuguese market, Gin has registered a
significant market penetration registering a significant increase between 2011 (4,9%) and 2020
(14,3%) (Marktest, 2020).
3.3 Primary Data
Several steps were chronologically implemented to collect original data next to real consumers:
(1) PM Selection; (2) Stimuli Creation and Interpretation, and (3) Main Study.
143.3.1 Packaging Materials Selection
Considering the two beverages previously chosen, a subsequent step was required to understand
how consumers perceive PM regarding the Environmental Friendliness and the Capability to
Preserve the Quality of the product. For this purpose, a focus group was carried out.
3.3.1.1 Data Collection
A focus group was performed via Zoom, an online platform, given the limitations of personal
contacts resulting from the Covid-19 pandemic’s constraints, to collect data from real
consumers. This methodology was conducted to promote a self-disclosure among participants
and instigate group interaction. The focus group was carefully planned to foment a relaxed and
informal atmosphere across a homogenous group of participants. The participants were around
the same age range, from 5 different nationalities, and shared the same business academic
background (Appendix 1).
The activities program of the focus group was divided into four parts (Appendix 2). The rules
for each part were explained at the beginning of each activity.
In the first part – Warm-up – the moderator showed appreciation to all attendees for
participating in this activity and has clarified the purpose of the study as well as the rules to
comply with. Straight after, the moderator presented herself and encouraged everyone to follow
the example.
During the second part – PM Classification – participants were asked to classify individually
specific PM on a sheet of paper, according to their perception regarding the Environmental
Friendliness and the CPQ of the product, without voicing their own opinions. After completing
the individual task, the moderator asked them to send her a photo of their responses by private
message to ensure the data confidentiality.
In the third part – Role-Playing Situation – participants were asked to imagine themselves in
three real situations at the supermarket, where they had to decide on a specific beverage
packaging material to buy for a third person. For each setup, enough details were given to ensure
the formulation of a structured and realistic scenario by characterizing the third person
regarding Environmental Consciousness and Degree of preference regarding different qualities
of beverages (Appendix 2). This projective technique (Malhotra & Birks, 2007) meant to create
a deliberation among the focus group, where a balanced reasoning was required to reach an
agreement, concerning the third person characterization and the perceptions of the participants
towards different materials previously characterized on the second part of the focus group.
Thereby, it was possible to gather qualitative data regarding the different PM which were under
this study (Figure 4). The moderator started the group discussion by reading out loud each
15You can also read